All topics: trading questions and answers
Learn what trading indicators measure and where their signals can mislead. Each short answer links to the relevant written explanation.
1. Understanding indicator signals
Trading indicators
What is a trading indicator?
It is a calculation based on market data, usually price or volume.
Indicator crossovers
Is an indicator crossover enough to trade?
Arapov does not use a crossover alone as an entry. He also looks at levels and volume because crossovers can repeat without a lasting price move.
Indicator divergence
What is divergence in trading?
Divergence means price and an indicator are not making matching highs or lows. It can suggest that the price movement is losing strength, but it is not a complete entry signal.
Divergence confirmation
Does divergence guarantee a reversal?
No. A strong trend can continue through several divergences. Define what price response would confirm the idea and what would invalidate it; a disagreement alone is not confirmation that the market has turned.
Indicators in chart reading
Which indicators does Arapov find useful?
Trading volume is part of Arapov’s core chart reading. He gives calculated indicators a supporting role when they add a clear observation; the course does not establish a separate RSI or MACD entry system.
2. Measuring trend strength
ADX indicator
What does ADX measure?
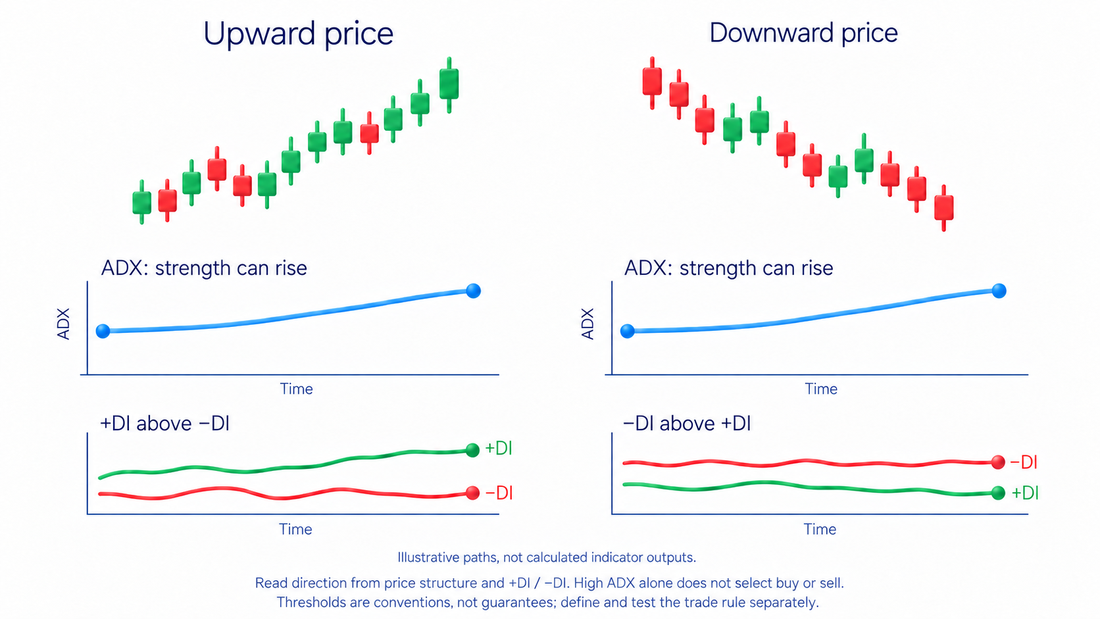
ADX measures trend strength, not direction. A high reading does not tell you whether price is moving up or down.
ADX trend strength
What does a high or low ADX mean?
Below 20 and above 25 are commonly used guides to weaker and stronger directional movement, not exact market boundaries. A high reading does not choose direction or prove that a move has ended.
ADX directional lines
What are +DI and −DI?
These lines describe upward and downward directional movement. ADX measures the strength of that movement, so the lines serve different purposes.
ADX trend filter
Can ADX help distinguish a trend from a range?
It can help describe whether movement is strongly directional or weak. That can guide the choice of approach, but does not provide a trade by itself.
ADX trade direction
Does a high ADX mean I should buy?
No. ADX measures directional strength without choosing its side. It can rise while price falls. Read direction separately from +DI and −DI and from price highs and lows.
ADX settings
What does the ADX period change?
It changes how much recent data is used and how quickly the indicator reacts. A 14-period setting is common, but changing it does not remove reliance on past movement.
3. Measuring price fluctuations
ATR volatility
What does ATR measure?
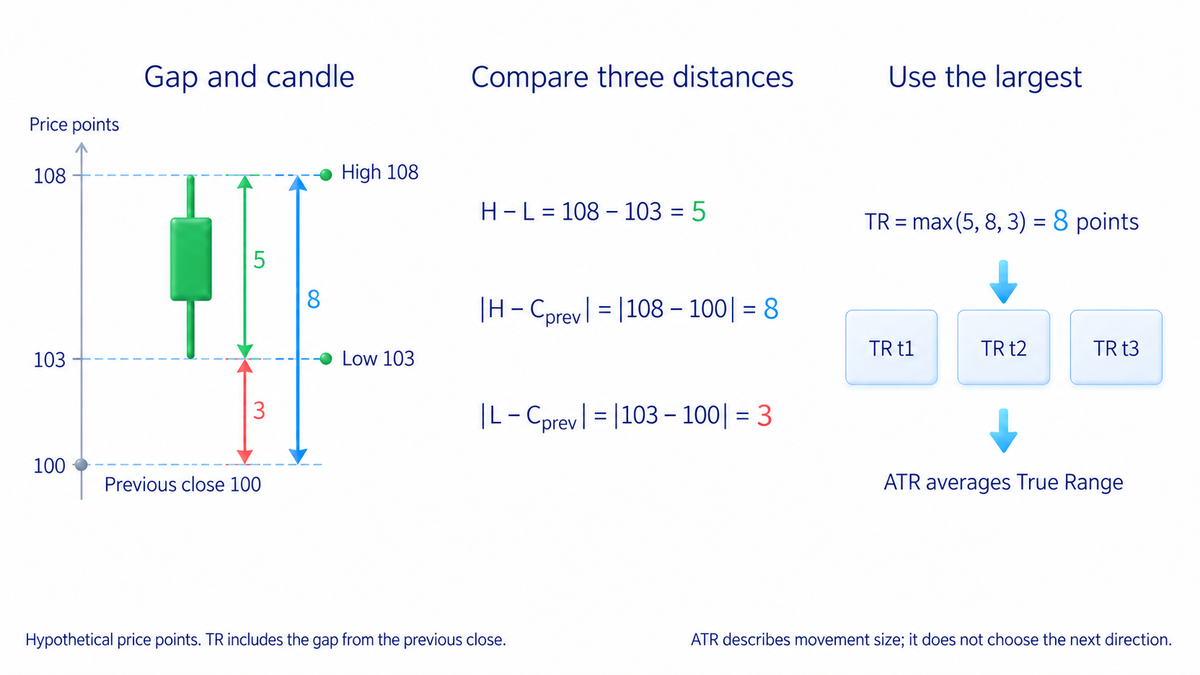
ATR averages the size of price fluctuations over a chosen period, including gaps. It can rise during either an upward or downward move.
ATR stop-loss
How can ATR help choose a stop distance?
First define the price change that would invalidate the trade, then compare the exit distance with recent ATR. Before entry, a wider necessary distance calls for a smaller position if the loss budget is unchanged. No ATR multiplier guarantees that ordinary movement will not trigger a stop.
ATR and position size
Why adjust position size when an ATR stop gets wider?
Before entry, a wider necessary stop distance calls for a smaller quantity to fit the same money risk. Rising ATR after entry does not authorize moving the stop farther away or increasing the original loss budget.
High ATR
What can an unusually high ATR mean?
It means recent price ranges are large. Arapov treats an extreme reading as a reason to review the trade and its exit, rather than an automatic reversal signal.
Low ATR
Does low ATR tell me which way price will break?
No. Low ATR describes smaller recent true ranges, not the direction of the next breakout. Check how price behaves after crossing the boundary; ATR does not distinguish a lasting breakout from a failed one.
True Range
How does True Range account for gaps?
It compares the candle's high-low range with the distances from the previous close to the high and low. The largest distance is used.
Chandelier Exit
What is a Chandelier Exit?
Chandelier Exit calculates a line a multiple of ATR below a period high for a buying position or above a period low for a position opened to benefit from a fall. The line can move in either direction. Protective-order update and execution rules must be defined separately.
4. Comparing price averages
MACD indicator
What is MACD?
MACD compares two averages of past prices, one using a shorter period and one a longer period. Its signal line smooths that difference. These readings describe price movement rather than predict future prices.
MACD signals
What signals can MACD show?
Traders watch the MACD line cross its signal line or zero, the histogram (the difference between the MACD and signal lines), and divergence, a disagreement between price and indicator highs or lows. Each describes a different comparison, not a guaranteed entry.
MACD settings
What do 12, 26 and 9 mean in MACD?
They are the periods used for the two moving averages and the signal line. Faster settings react sooner but can produce more short-lived signals.
Conflicting indicator signals
Why can MACD and stochastic disagree?
They use price data differently, so their readings can conflict. Arapov checks the chart and volume instead of deciding by whichever indicator looks more convincing.
MACD limitations
Why does Arapov avoid trading on MACD alone?
The course puts price structure, levels and trading activity before indicators. MACD processes prices already received and cannot replace a reason for entry or a loss limit. This is the course's general supporting role for indicators, not evidence of a separate personal MACD strategy.
MACD timeframes
Why can MACD differ on hourly and daily charts?
Each chart uses a different set of price periods. A short pullback can therefore appear against a broader trend.
5. Comparing gains and losses
RSI indicator
What is RSI?
RSI compares averaged price gains and losses on a scale from 0 to 100. It measures their relative size, not the number of buyers or sellers or the probability of a reversal.
RSI overbought and oversold
Does RSI above 70 mean I should sell?
No. RSI can stay high during a strong uptrend or low during a downtrend. Check the market situation rather than treating 70 and 30 as automatic commands.
RSI divergence
What is RSI divergence?
RSI divergence occurs when corresponding price and RSI extremes disagree: a lower price low with a higher RSI low, or a higher price high with a lower RSI high. It does not set a reversal time and needs a separate price condition before a trade.
RSI signals
Can RSI tell me exactly when to enter?
No. RSI processes price changes already received. It does not reveal future news or orders. The course treats indicators as supporting tools; entry, exit and permitted loss need their own rules.
RSI settings
Which RSI settings should a beginner learn first?
Begin with ordinary RSI using a 14-period length and closing prices. Record the chart period and source, and test one fixed rule before changing the settings. A shorter length reacts faster; a longer one smooths more, but neither is universally best.
Perfect indicator settings
Is there a perfect RSI setting?
No setting turns RSI into a forecast. Fix the settings and observation time, with separate entry, exit and permitted-loss rules. Compare the same rule with and without the RSI condition, including failures and costs, rather than changing thresholds after each outcome.
RSI calculation
How is RSI calculated in simple terms?
It compares average gains with average losses over a period, then converts the ratio to a value between 0 and 100. Larger relative gains produce a higher reading.
6. Locating price within a range
Stochastic oscillator
What does the stochastic oscillator show?
It compares the closing price with the recent high-low range. Its main line, %K, and smoothed line, %D, are shown on a scale from 0 to 100.
Stochastic settings
What do 14, 3 and 3 mean?
They describe the lookback period and smoothing used by the indicator. They are common starting settings, not a formula for guaranteed trades.
Stochastic signals
Does stochastic above 80 mean price must fall?
No. A high reading describes a calculated position near the range’s upper end; smoothed readings also include earlier values. It can persist while price keeps rising. A threshold alone does not confirm a reversal.
Stochastic in trends
Why can stochastic stay overbought for a long time?
In a strong uptrend, price can keep closing near the top of its range. Signals against that trend may therefore fail repeatedly.
Too many indicators
Does adding more indicators make a trade safer?
Not necessarily. Several indicators may repeat the same price information. Arapov prefers a clear chart with levels and volume to a stack of conflicting signals.
7. Following average prices
SMA vs EMA
How is an SMA different from an EMA?
An SMA gives equal weight to prices in its period. An EMA gives more weight to recent prices, so it usually reacts faster. Both use past data.
Moving-average signals
Why do moving averages give false signals?
They react after price moves and may cross repeatedly in a range. Changing the period trades off quicker reactions against more noise.
Moving-average support
Can a moving average act as support or resistance?
Price sometimes reacts near a moving average during a trend. The line does not display pending orders or prove why the reaction happened. Define the required price response before treating it as an extra condition.
200-day moving average
What is the 200-day moving average used for?
On a daily chart, a 200-day average provides a reference for longer-term movement. Position relative to the line can be a filter condition, but it does not choose an entry or guarantee continuation.
Golden cross vs death cross
What are a golden cross and a death cross?
A golden cross is a faster moving average crossing above a slower one. A death cross is the reverse. The 50- and 200-period averages are commonly used.
8. Weighting prices by volume
VWAP indicator
What is VWAP?
VWAP is the average traded price weighted by volume. A session VWAP starts again each session and is mainly used for intraday analysis.
VWAP execution benchmark
Why do large traders compare trades with VWAP?
They can use it to assess the average price achieved while buying or selling a large amount. This makes VWAP an execution reference as well as a chart line.
Price above or below VWAP
What does price above VWAP mean?
It means the current price is above the volume-weighted average for the selected period. This comparison alone is not a buy signal; specify the price reaction being checked before testing it.
VWAP reclaim and rejection
What are a VWAP reclaim and rejection?
A reclaim is a move back across VWAP followed by holding on the other side. A rejection is an approach followed by a turn away. Define the observation period and what counts as holding before testing either condition.
Anchored VWAP
How is anchored VWAP different from session VWAP?
Anchored VWAP starts at a chosen event or chart point rather than resetting each session. It can therefore cover a longer move.
VWAP with price levels
Why combine VWAP with support and resistance?
Their overlap can provide context, but both may reflect the same price history rather than independent confirmations. Observe the subsequent reaction and test whether VWAP adds information to the price-level rule.
9. Watching changing price ranges
Bollinger Bands
What do Bollinger Bands show?
They show bands around a moving average based on how widely prices vary. Wider bands reflect greater recent variation; narrower bands reflect less.
Bollinger Band touches
Should I trade whenever price touches a band?
No. Price can follow a band during a sustained trend. A touch describes its position relative to the recent mean, not a confirmed reversal. Check the actual price movement before treating a touch as a trade condition.
Bollinger squeeze
What is a Bollinger squeeze?
It is a narrowing of the bands as price variation decreases. It flags a quieter market, but does not determine the direction of the next move.
BandWidth and Keltner Channels
How can BandWidth help spot a squeeze?
BandWidth measures how narrow the Bollinger Bands are. Comparing them with Keltner Channels can help define a squeeze, but still does not predict its direction.
Bollinger breakout
How does Arapov assess a breakout from the bands?
The course treats indicators as supporting tools after price structure, levels and trading activity. It does not establish a separate personal Bollinger-band breakout rule. Describe price movement first, then test whether band width or position adds a useful condition. Fix the settings and retain failed patterns instead of changing them after seeing the outcome.
10. Reading the cloud and its lines
Ichimoku lines
What are the Ichimoku lines based on?
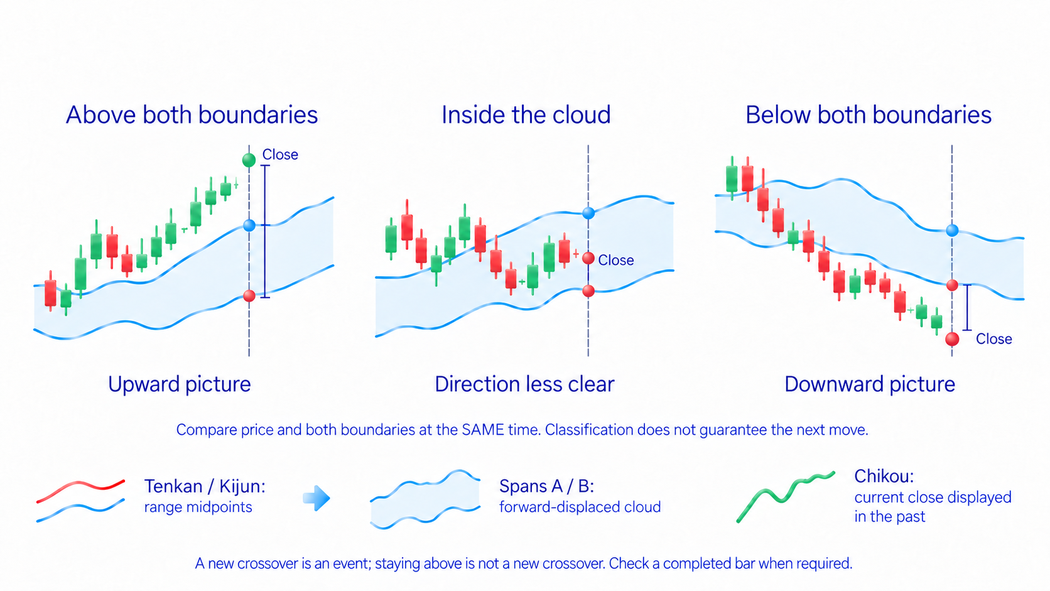
The five plots use different calculations. Tenkan and Kijun are range midpoints, Spans A and B form the forward-displaced cloud, and Chikou is the current close displayed in the past. These shifts do not reveal future prices.
Ichimoku cloud
What does price above or below the cloud mean?
Compare price with both cloud boundaries on the same vertical line. Above both is conventionally an upward picture, below both a downward picture, and inside the cloud direction is less clear. That classification does not guarantee the next move.
Tenkan-Kijun crossover
What is a Tenkan-Kijun crossover?
It is a new crossing of Tenkan and Kijun, not simply one line staying above the other. A bullish crossing above the aligned cloud agrees with an upward picture; below it the conditions conflict. Check a completed bar if the rule requires one, rather than treating the crossing as an automatic trade.
Learning Ichimoku
Should a beginner start with Ichimoku?
Arapov suggests first learning to read trends and levels directly. You can study the cloud later once the basic chart makes sense.
About these learning materials
This section draws on the ArapovTrade library and Igor Arapov’s educational videos. It offers definitions, instrument comparisons, explanations of market mechanics and the author’s trading approach.
The library’s author is Igor Arapov, a practicing trader since 2013. The detailed lessons explain each subject in context; these short answers provide a starting point.




