The stochastic oscillator compares the closing price with the highest and lowest prices in a selected number of bars, or chart periods. A high reading places the close toward the upper end of that range; a low reading places it toward the lower end. This describes received price data, not the probability of the next rise or fall.
Before using a reading, distinguish the raw calculation, the smoothing of its lines and the condition you intend to test. Then a number above 80 does not become an automatic sale, and a line crossing does not become a promise of profit.
What stochastic measures and how it is calculated
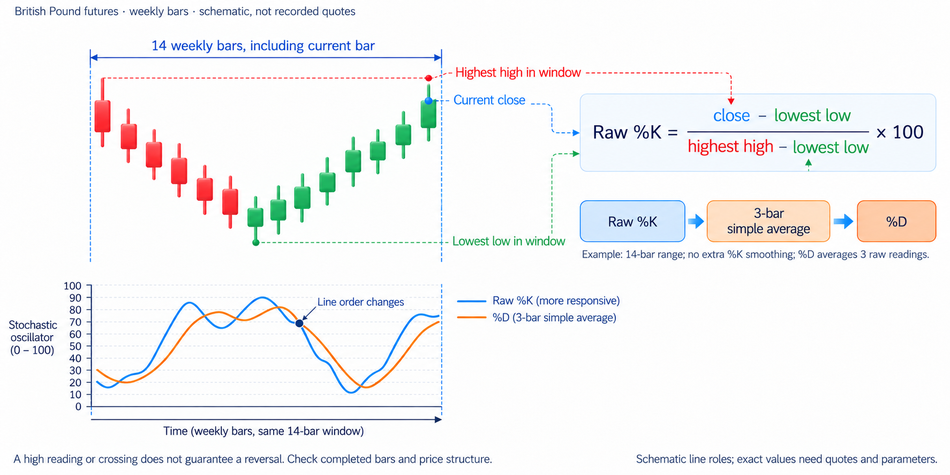
The indicator's development is associated with George Lane and his colleagues in the 1950s. It compares a close with a recent price range. The usual display has two lines: %K is the main line, and %D averages its values to provide a smoother signal line.
For the raw, unsmoothed reading, take the current close, the lowest low and the highest high within the selected window. The highest high minus the lowest low gives the range width. Raw %K = (close − lowest low) / (highest high − lowest low) × 100. Include the current bar in the selected window.
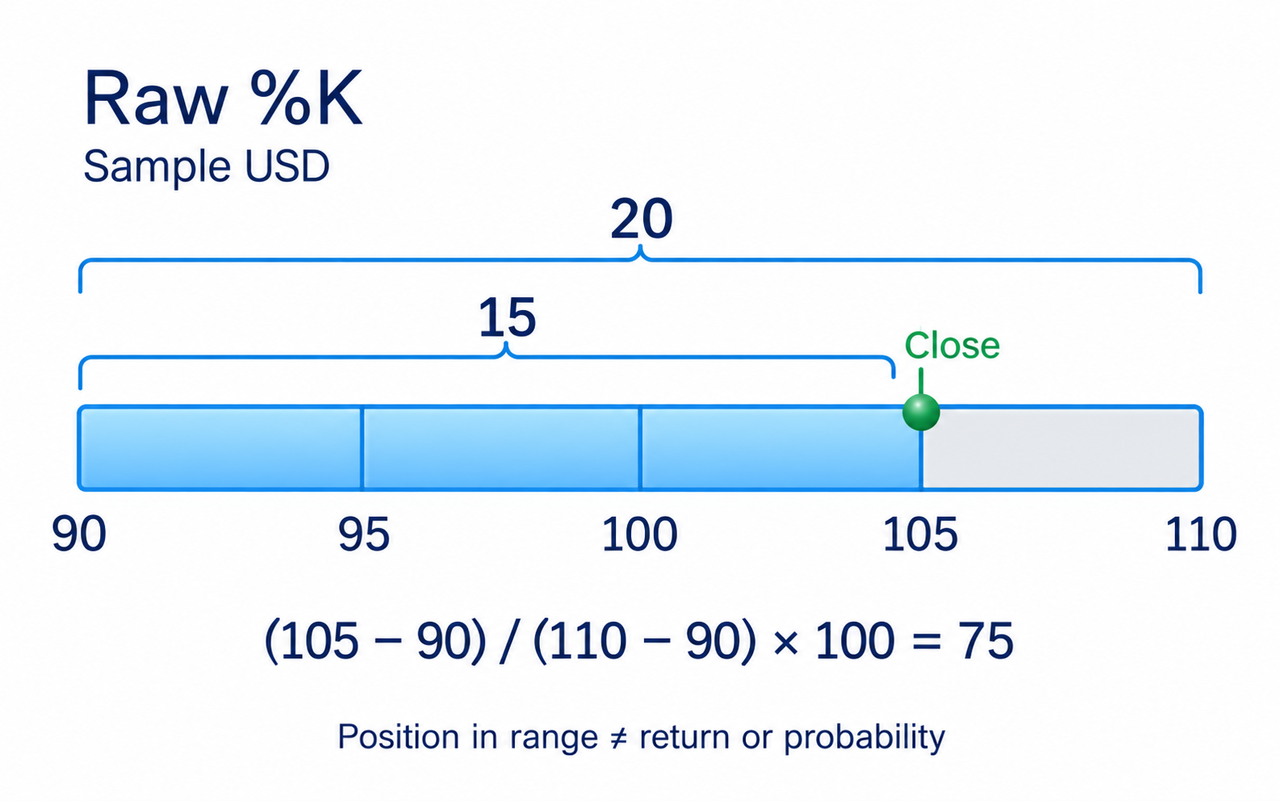
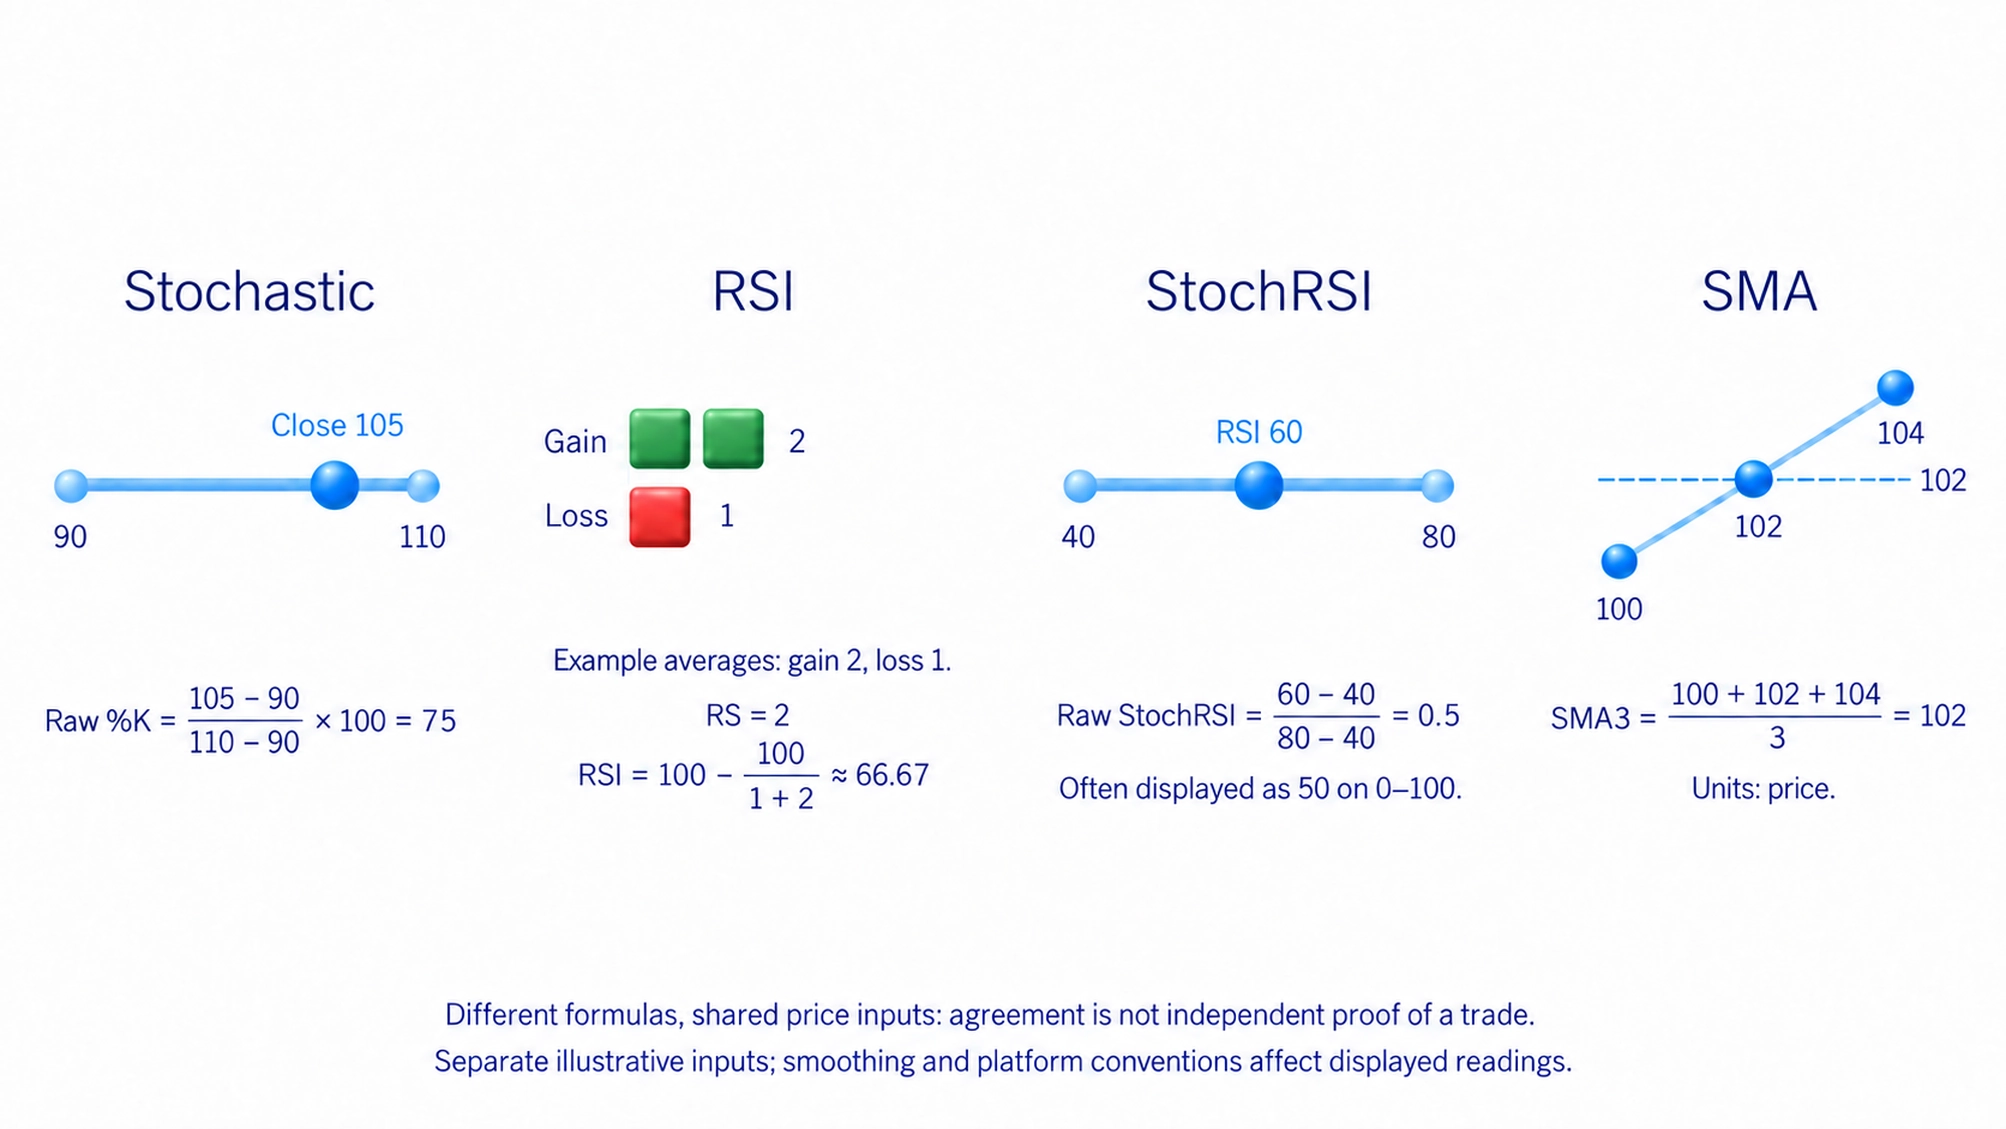
For one illustrative share quoted in US dollars, suppose the window's lowest low is USD 90, its highest high USD 110 and the latest close USD 105. Raw %K = (105 − 90) / (110 − 90) × 100 = 75. The close is three quarters of the way from the lower end to the upper end. The reading is neither a 75% return nor a 75% chance of a rise.
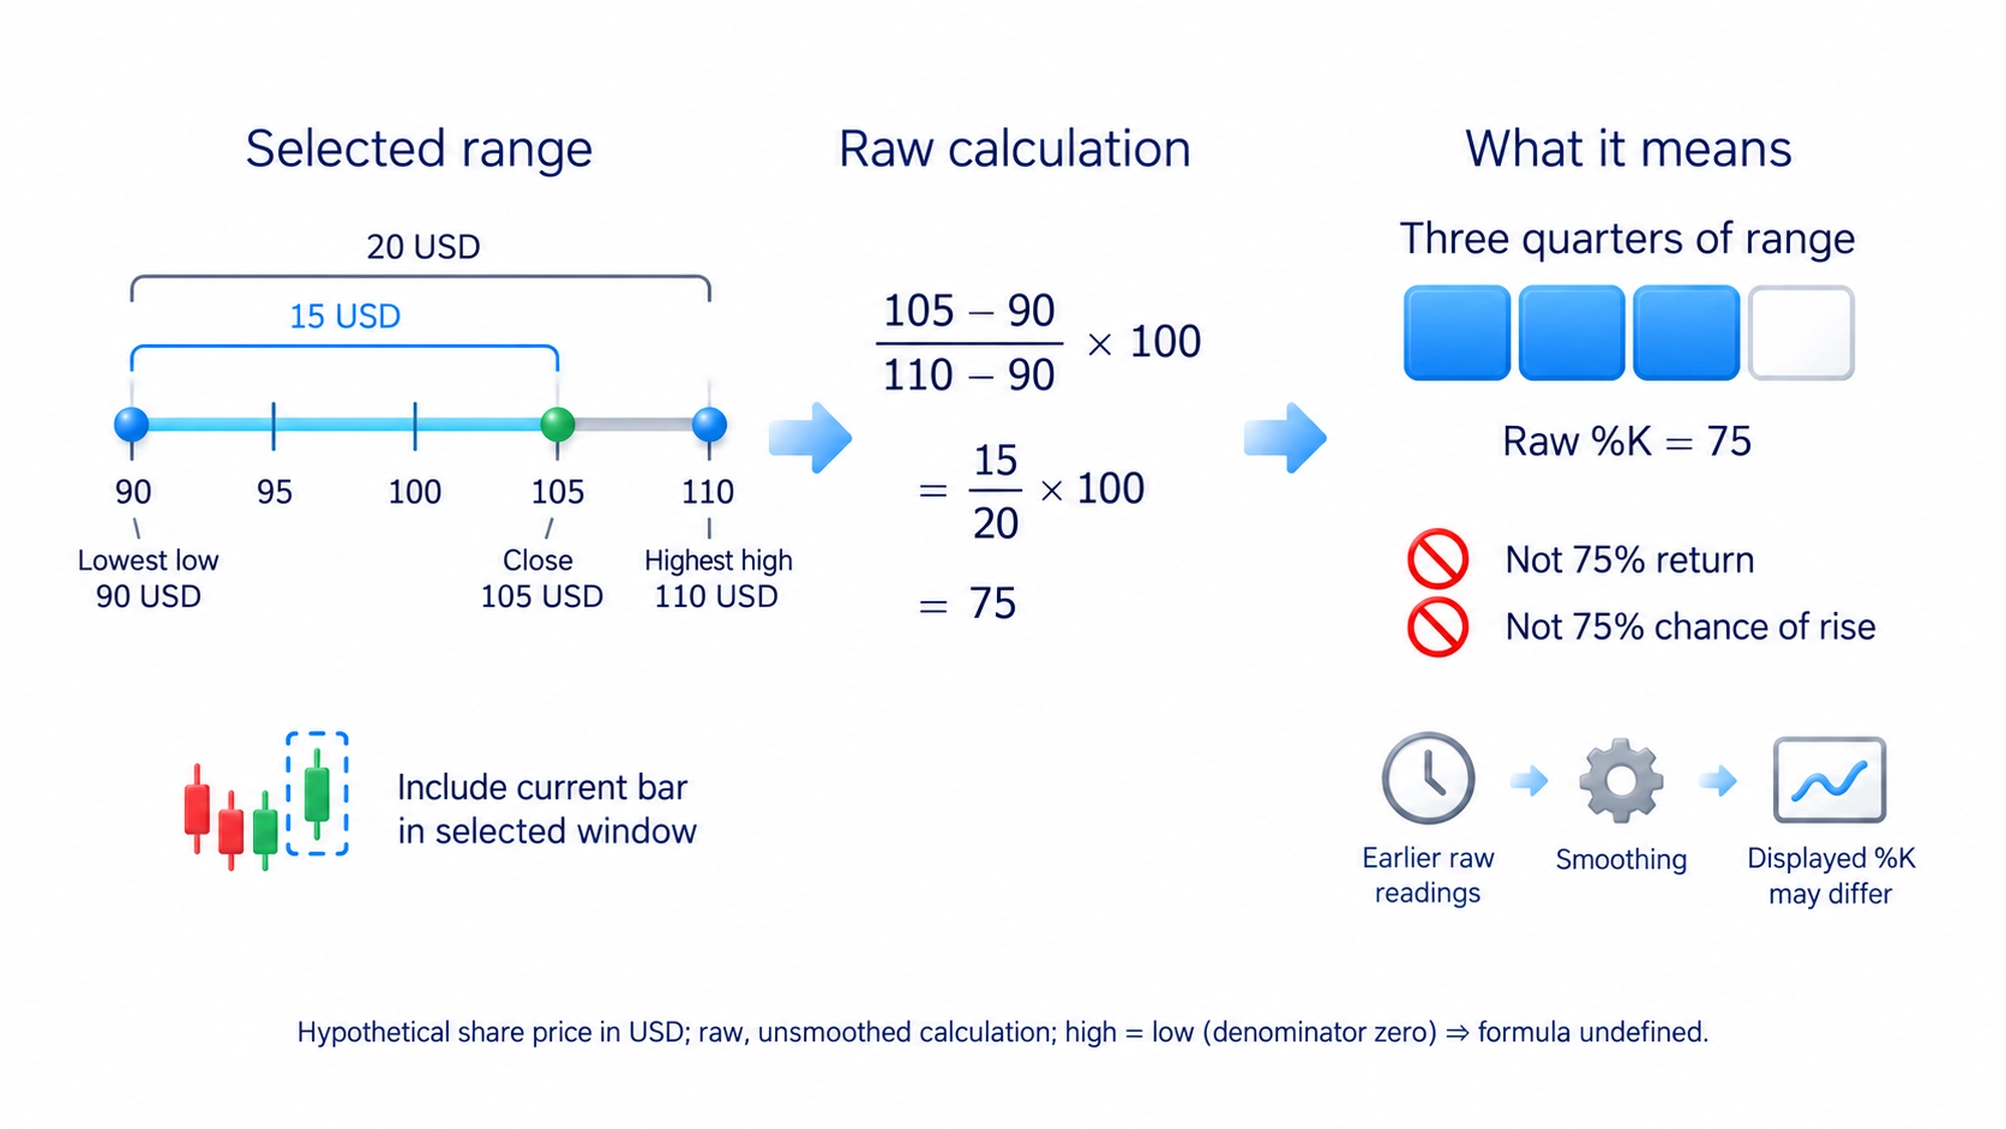
A close at the highest high produces a raw reading of 100; at the lowest low it produces 0. If the highest high equals the lowest low, the denominator is zero and this formula is undefined. Programs can handle that situation differently; any displayed fallback number is not the result of ordinary division by the range.
Smoothing averages several consecutive readings. It reduces some quick fluctuations but introduces delay. A smoothed %K therefore need not match the latest close's exact location in the current range. After a sharp price change, it still incorporates earlier readings.
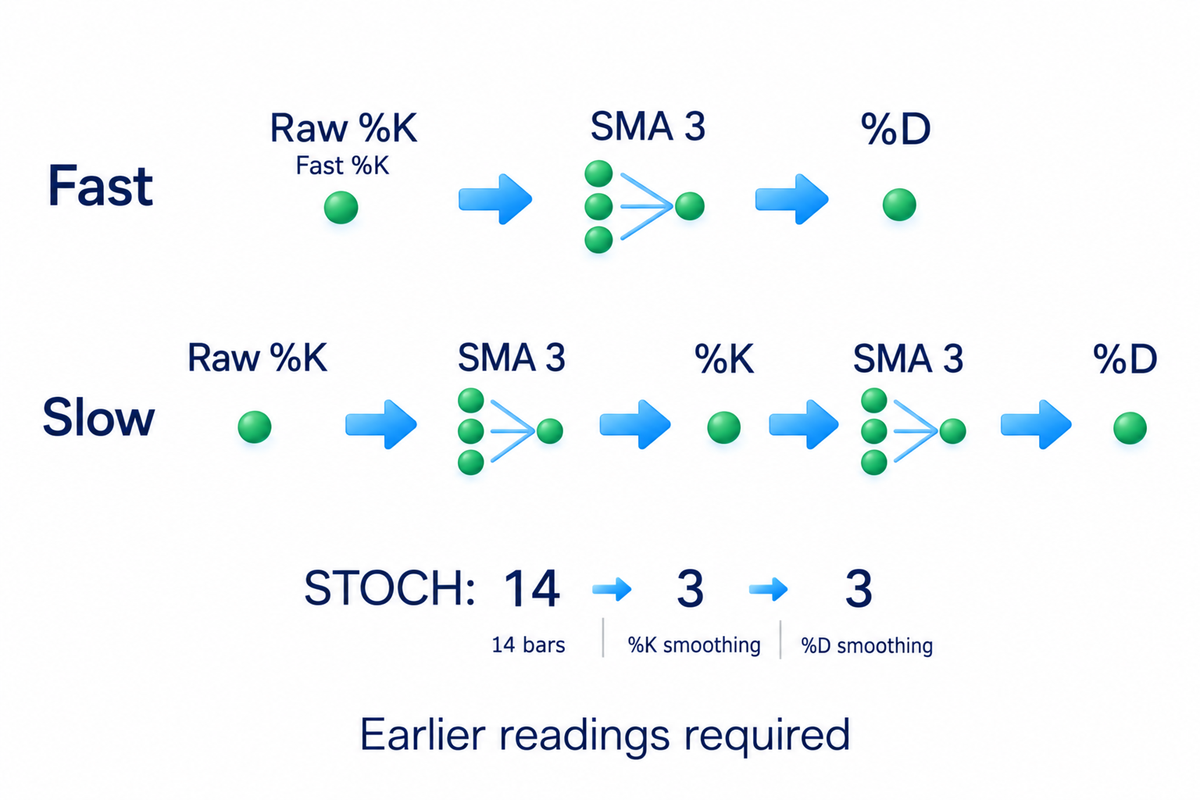
Fast and slow stochastic: settings 14, 3, 3
In the common Fast Stochastic version, %K uses the raw calculation and %D is its three-period simple moving average, or SMA: the sum of those values divided by three. Slow Stochastic first smooths %K, then calculates %D from the smoothed main line. Full Stochastic lets you choose the original window and both smoothing lengths separately.
TradingView's standard STOCH defaults to a 14-bar range, three-period smoothing of %K and a three-period %D. It averages the raw readings for the displayed main line, then averages that main line for the signal. The value 75 in our example is only the raw reading; those defaults require previous readings before you can calculate the displayed smoothed lines.
Do not transfer a setting written as 14, 3, 3 between platforms without checking the fields. MetaTrader distinguishes %K length, %D length, slowing, the average method and price inputs. Some implementations also smooth the components of the ratio rather than simply averaging successive ratios. Check the program's formula as well as the three numbers.
The length counts bars of the selected chart interval. Fourteen minute bars and fourteen daily bars cover different histories. The chart-reading guide explains which price fields and periods a candle or bar represents, so you can identify the data behind an indicator reading.
A shorter window or less smoothing generally makes the line more responsive. That does not guarantee more accurate signals. Longer settings usually smooth more at the cost of delay. Use defaults to learn the calculation, then assess any change with a fixed condition rather than search for a universally best setting.
On an open bar, the latest price, high and low can change. The lines and their crossings may therefore change before it closes. If your rule requires the completed bar, evaluate it after that close. If the calculation uses a higher chart interval, its bar must also be complete for a condition based on its final values.
Overbought, oversold and line crossings
Readings above 80 are commonly called overbought and readings below 20 oversold. Here those labels refer to high and low calculated positions, not the asset's fair value, the number of buyers or the size of anyone's holdings.
During sustained growth, closes can repeatedly occur near the tops of successive ranges, keeping stochastic high. The opposite can happen during a decline. Selling solely because the reading exceeds 80, or buying solely below 20, may mean trading against a movement that is still continuing.
Leaving a zone and crossing the other line are different events. %K falling below 80 changes its relationship with a chosen threshold. %K crossing below %D changes its relationship with a smoothed signal. Either can occur without the other happening on the same bar.
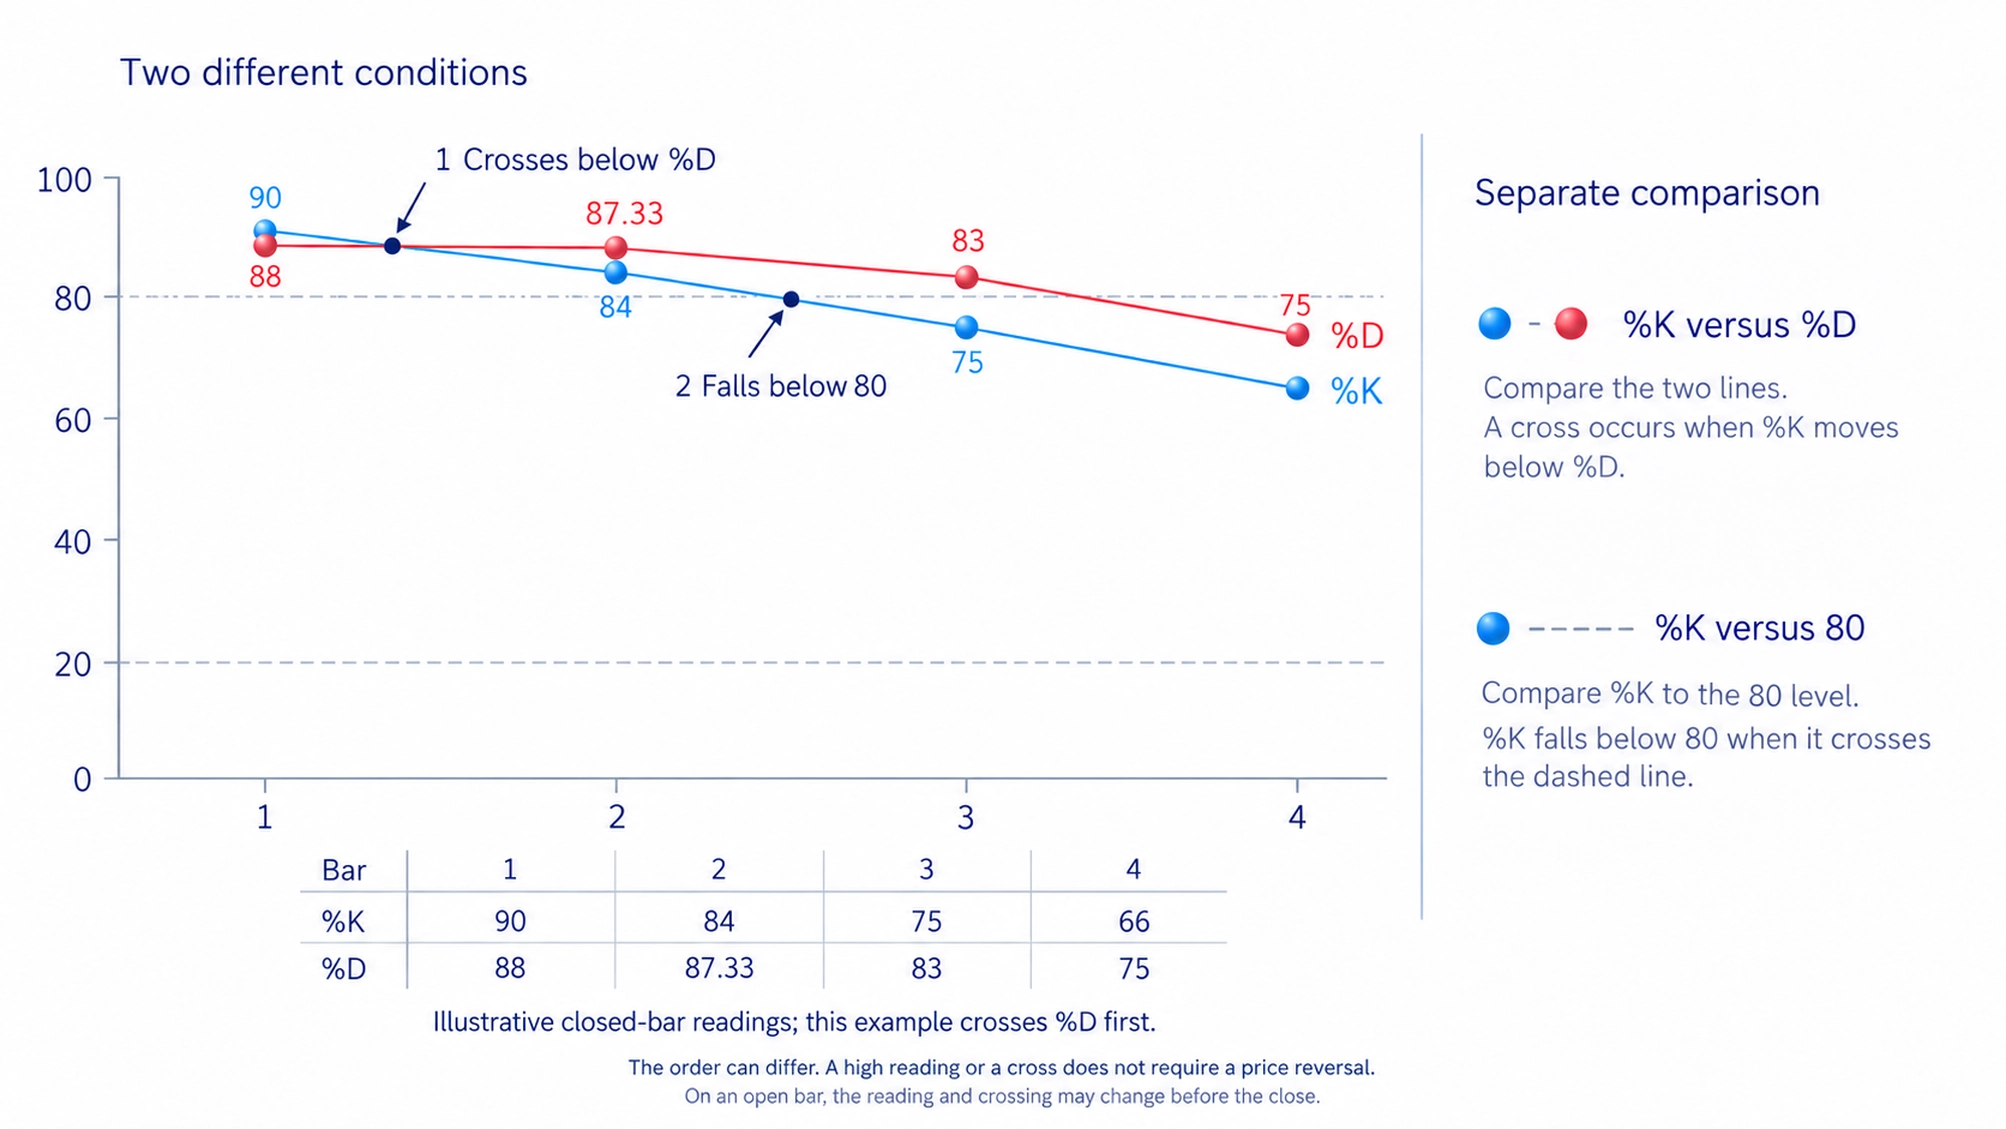
A %K crossing above %D is often called bullish; crossing below is called bearish. Those names describe the proposed interpretation, not a required next price move. Specify which crossing you are checking, its bar and its other conditions before evaluating an outcome.
When price moves sideways between boundaries, a return in stochastic can accompany a return in price. But that range can end in a breakout. The indicator guarantees neither a boundary holding nor the next return succeeding. Compare it with the actual price movement rather than assume that a range makes trading safe.
With a smoothed main line, a reading above 80 can still include earlier high readings even after the latest close has moved farther from the range's top. Check the current price and the selected smoothing before describing that reading as the exact position of the latest close.
What stochastic divergence means
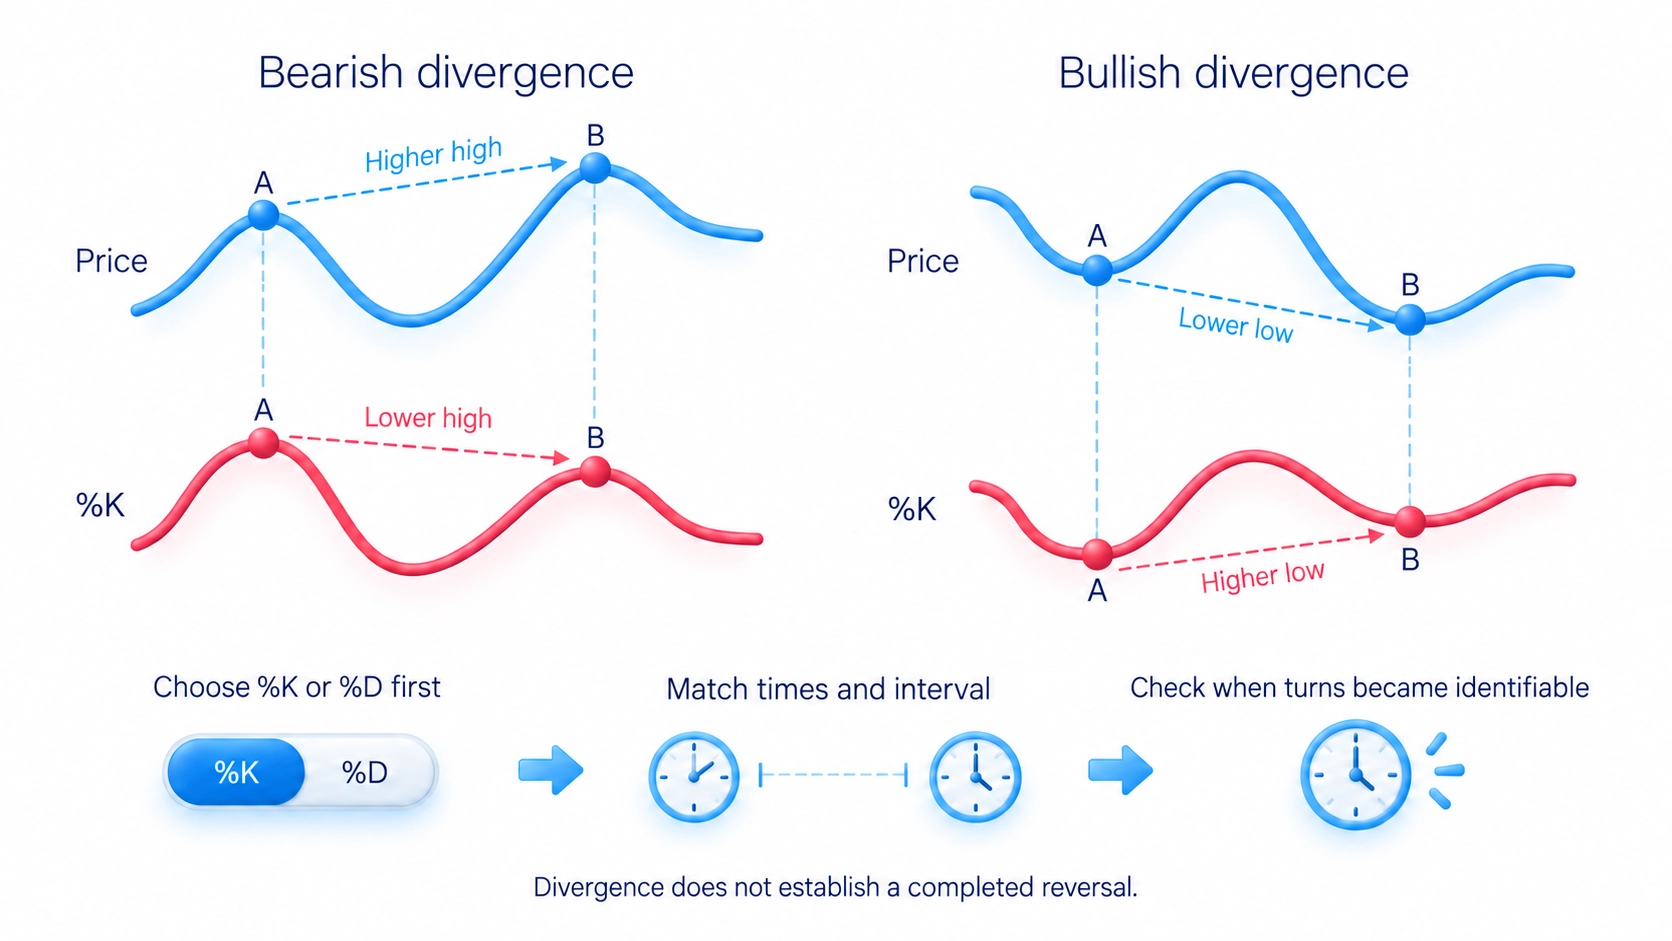
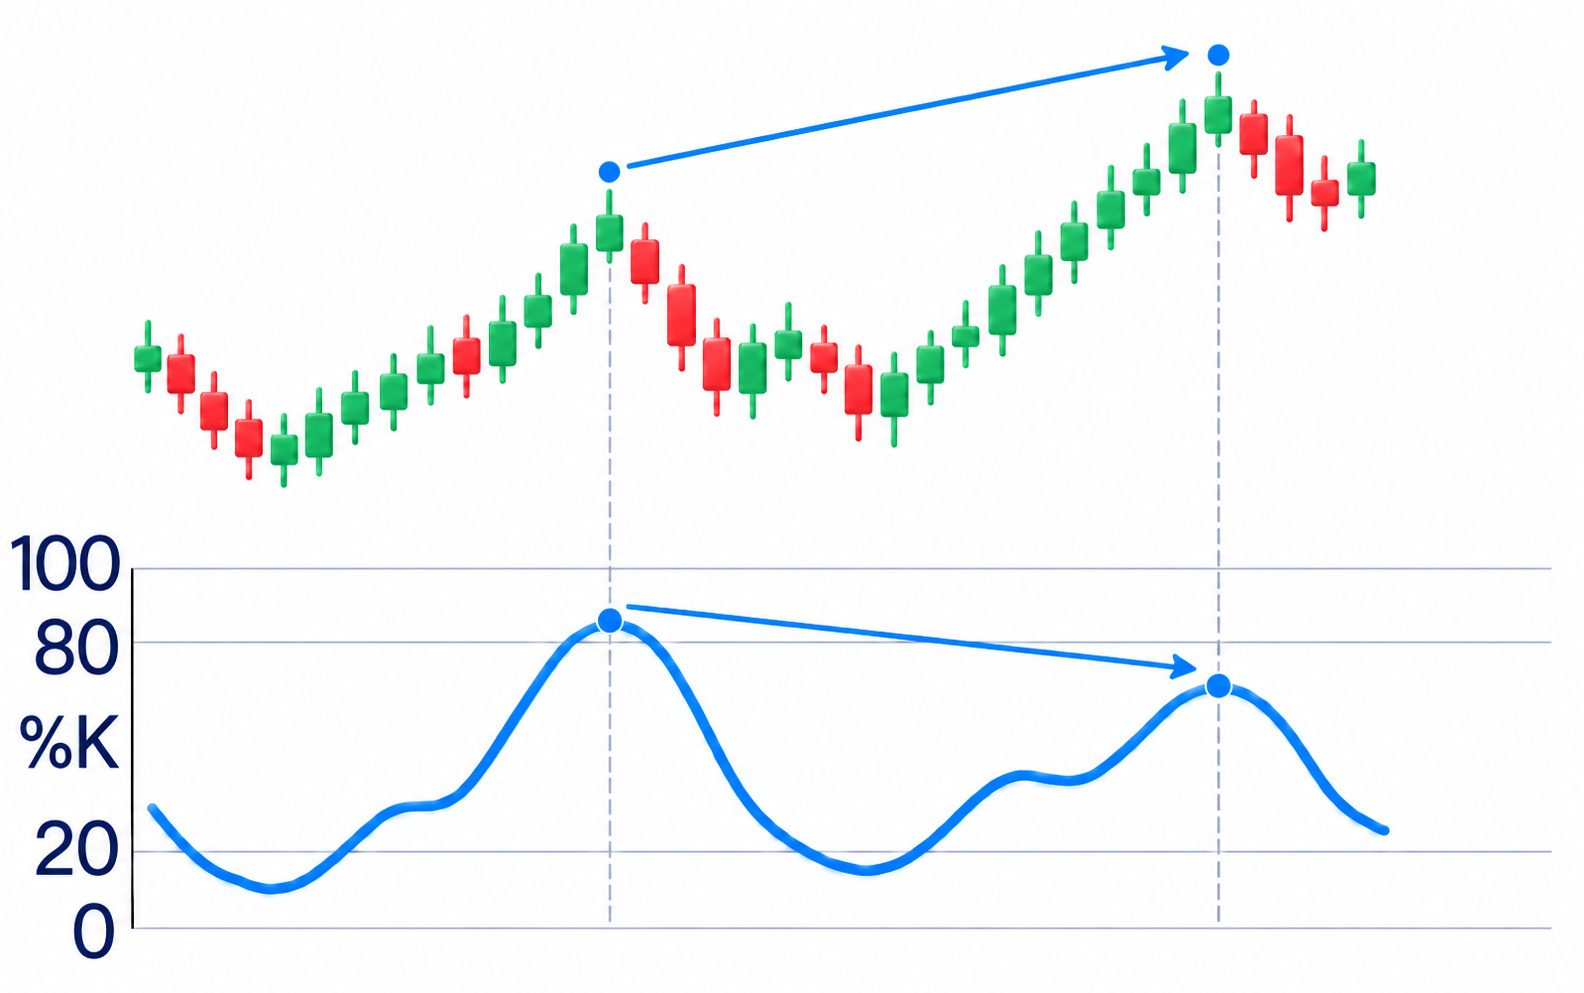
Stochastic divergence compares corresponding turning points in price and a chosen indicator line. A bearish example has a higher price high and a lower stochastic high. A bullish example has a lower price low and a higher stochastic low. Use comparable points from the same chart interval.
This disagreement means the new price extreme has not produced the same change in the range-based reading. It does not establish a completed reversal. The window's high and low move as bars enter and leave it, so a reading can decline while price continues to rise.
Choose %K or %D and the corresponding price points before marking a divergence. Do not switch lines afterward to create a more appealing comparison. Check the subsequent price reaction and when the turning points became identifiable; a finished historical chart can show a turn that was not yet confirmed at the time.
Using stochastic without adding needless signals
Stochastic and the Relative Strength Index, RSI, use different calculations. Stochastic places a close within a range; the RSI guide explains its comparison of averaged positive and negative price changes. Both process price, but their readings need not agree and are not independent evidence about market participants.
Ordinary stochastic also differs from Stochastic RSI. The latter applies the range comparison to RSI values instead of directly to price. The similar names do not make the formulas or settings interchangeable.
A moving average describes smoothed price in the instrument's quote units, while stochastic describes a relative position. A low stochastic alongside a falling average is not a calculation error: price can be near the low end of a falling market's range. The readings answer different questions.
In my approach, price structure, levels and the relationship between price and trading volume come before supporting indicators. Volume here means the quantity traded in the selected data source. The course's section on indicators explains this learning order; it is a general foundation, not a separate personal stochastic entry system.
The video on indicator lag discusses the limits of calculations using prices already received. It offers optional practical context. For the written exercise, describe what price has done first, then ask whether a particular stochastic reading adds a useful condition. The trading-indicators guide compares the different functions of these tools.
Record the instrument, chart interval, inputs and one condition, such as a specified crossing after the bar closes. Reveal the next bars step by step without future data, keeping failed cases too. Repeatedly changing settings after inconvenient examples tests how well you can fit history, rather than whether a fixed rule is repeatable.
A stochastic signal does not set the quantity to trade or permitted loss. Those need separate rules, explained in the risk-management guide. Understanding the formula lets you read the indicator; it does not supply the complete plan for a trade.
Frequently asked questions
It compares a close with the selected bars' high-low range. High raw readings place it near the top and low readings near the bottom. Smoothed lines also incorporate previous readings, so they are not the current close's exact position or a probability of the next move.
In a common version, they mean a 14-bar range and two three-period smoothing stages. Check each platform's field names and formula: the parameter order and smoothing method can differ.
No. A high reading describes the calculated position toward the range's upper end. It can persist during continued price growth, and smoothing includes earlier readings. The threshold alone does not confirm a reversal.
It changes the main line's position relative to its signal line. An upward crossing is often called bullish and a downward one bearish, but neither requires the next price move to follow it. A crossing on an open bar can disappear before the close.
Stochastic compares a close with a range, RSI compares averaged positive and negative price changes, and a moving average smooths price itself. Different readings reflect different formulas; the tools do not have to agree, and agreement is not independent proof of a trade.
About the author
Igor Arapov, practising trader since 2013 and author of the ArapovTrade library. ORCID: 0009-0003-0430-778X.




