The Wyckoff method compares price and trading volume to interpret a market's development. Is a decline losing momentum? Is price building a range? Does the next move support an advance or renewed selling? Accumulation and distribution describe possible position-building and selling within that process. The task is to test a sequence, not find a diagram that guarantees a reversal.
In my analysis, location, trading activity and the next price reaction belong together. Heavy volume near a level deserves attention, but the reaction determines whether the idea still makes sense. Neither a tall volume bar nor a familiar range identifies a particular fund as a buyer.
How the Wyckoff method works
Richard Wyckoff developed an approach to reading markets through price, volume and the sequence of moves. In the classic stock-selection process, traders assess the wider market, compare individual stocks with it and look for a suitable stage of development. Trading volume records the quantity exchanged during a period, such as shares or futures contracts. A stock's relative strength means how well its price holds up or advances compared with the wider market, not an indicator with a similar name.
A trading range is an area where price repeatedly moves between an upper and a lower boundary. Support is the lower area where declines have met a pause or recovery; resistance is the upper area where advances have stalled. In the Wyckoff model, accumulation describes position-building before a possible advance, while distribution describes selling before a possible decline. The chart shows transactions, not everyone's complete holdings. Calling a range accumulation is therefore an interpretation to test against later movement.
The Composite Operator, also called the Composite Man, is a model for thinking about the actions of larger participants. The analyst considers a trading campaign as though buying, moving price and selling formed one coordinated sequence. This is a way to organise observations. It is not proof that one person or organisation controls the market.
I use this model to explain large-capital behaviour, while separating an explanation from an observation. A return inside a range is visible on the chart. A claim that one fund bought all the available supply cannot be established from total volume. The Smart Money guide explains the language commonly used for these interpretations.
The three Wyckoff laws
Supply and demand: compare trading activity with the prices at which transactions take place. Buying that reaches progressively higher prices can advance the market; selling that reaches lower available prices can move it down. Every completed transaction has a buyer and a seller. A volume column does not count how many people want to buy rather than sell.
Cause and effect: the preparation within a range is treated as the cause and the subsequent move as its effect. Classic Wyckoff analysis uses horizontal counts on Point and Figure charts, which record price changes, to estimate a possible move. The estimate depends on how the chart and count are constructed. A longer sideways period does not automatically promise a larger profit.
Effort versus result: volume represents effort, while price progress represents result. Heavy activity with little further progress calls for a closer look at what is limiting the move. Compare a candle's range, its closing position and what happens afterwards. Range means the distance between that candle's high and low. The volume-analysis guide explains how to make these comparisons and check the underlying data.
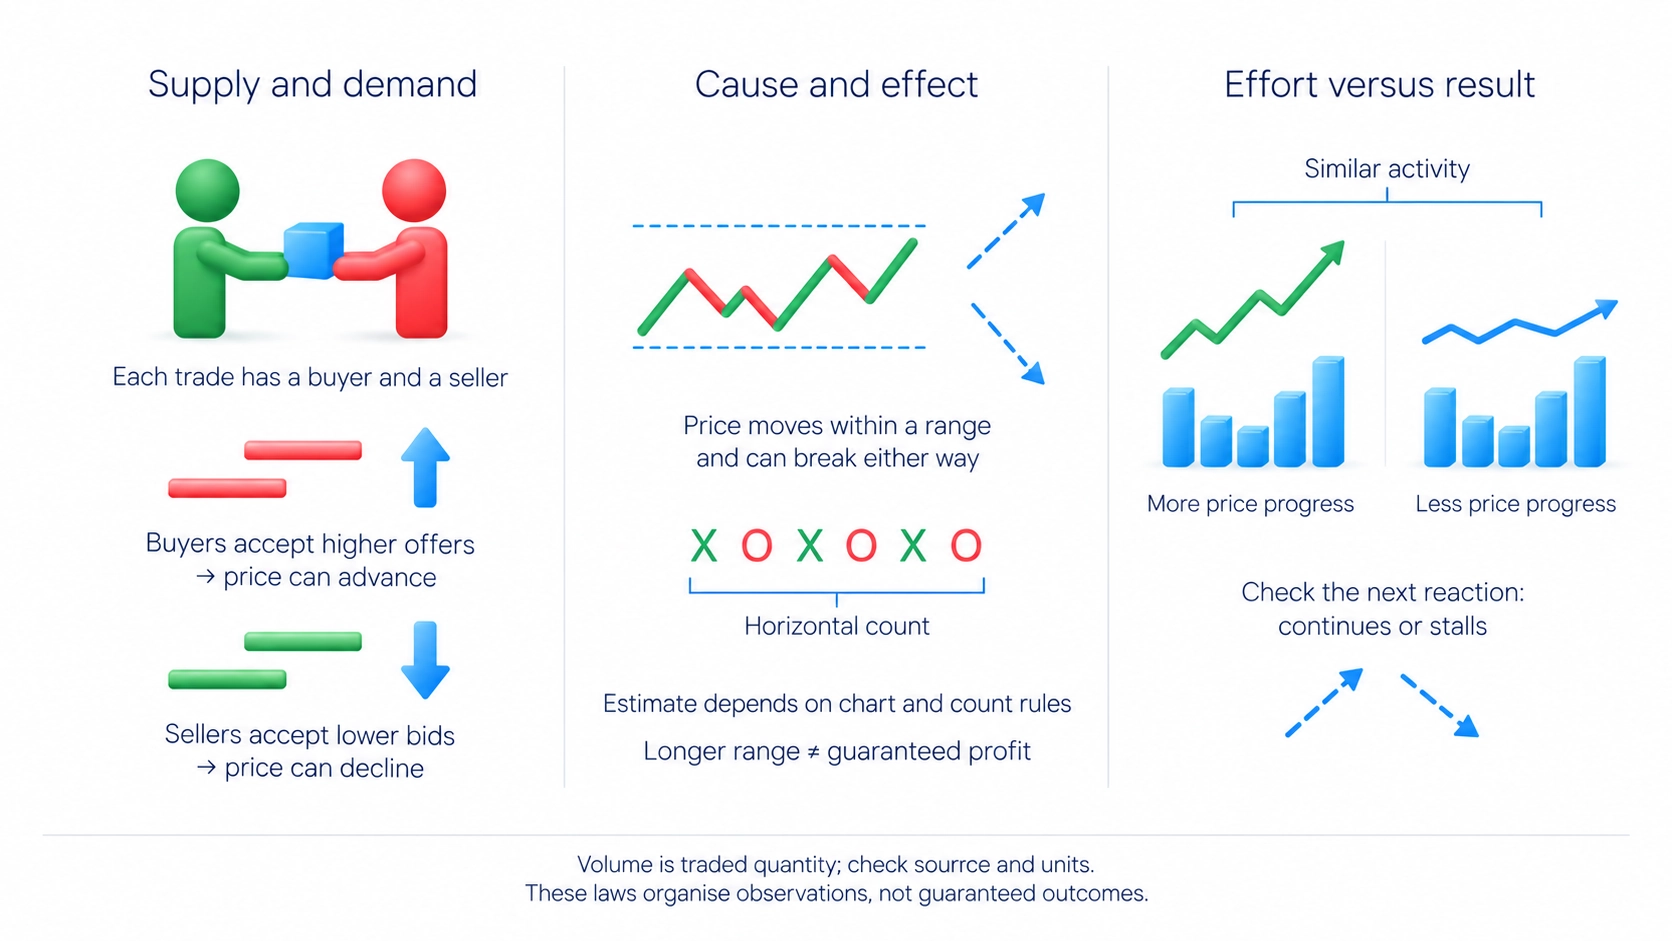
Use the three principles together. First locate the range and establish what preceded it. Then compare activity and price progress around its boundaries. Record what would contradict the proposed explanation. If the expected continuation does not appear, revise the interpretation rather than treating the name of a law as confirmation.
Accumulation, markup, distribution and markdown
Accumulation is associated with preparation for an advance, often in a range after a decline. Look for difficulty making further downward progress, repeated tests of the lower area and later evidence of strength. Sideways movement alone cannot distinguish accumulation from a pause before another fall.
Markup is the advancing part of the cycle. Higher highs and higher lows describe its developing structure. Pullbacks need not all have lower volume, and a former resistance area need not hold every return. Check what price actually does instead of expecting every detail of a textbook drawing.
Distribution is associated with selling previously accumulated holdings and preparation for a decline, often after an advance. The chart may show weaker upward progress, unsuccessful attempts to hold above resistance and stronger movement towards support. High volume within the range does not prove that a large holder has finished selling.
Markdown is the declining part of the cycle, described by lower highs, lower lows and continued weakness after rebounds. A pause within that decline may become accumulation, or it may be redistribution before another fall. Likewise, a pause during an advance may be reaccumulation before renewed growth rather than distribution at a top.
These four stages describe the broad cycle. Phases A, B, C, D and E describe the development of an individual accumulation or distribution range. They are not five extra stages added after the four. The chart interval matters too: a pullback on a longer-term chart can contain several smaller swings on a shorter-term chart.
Accumulation phases A to E
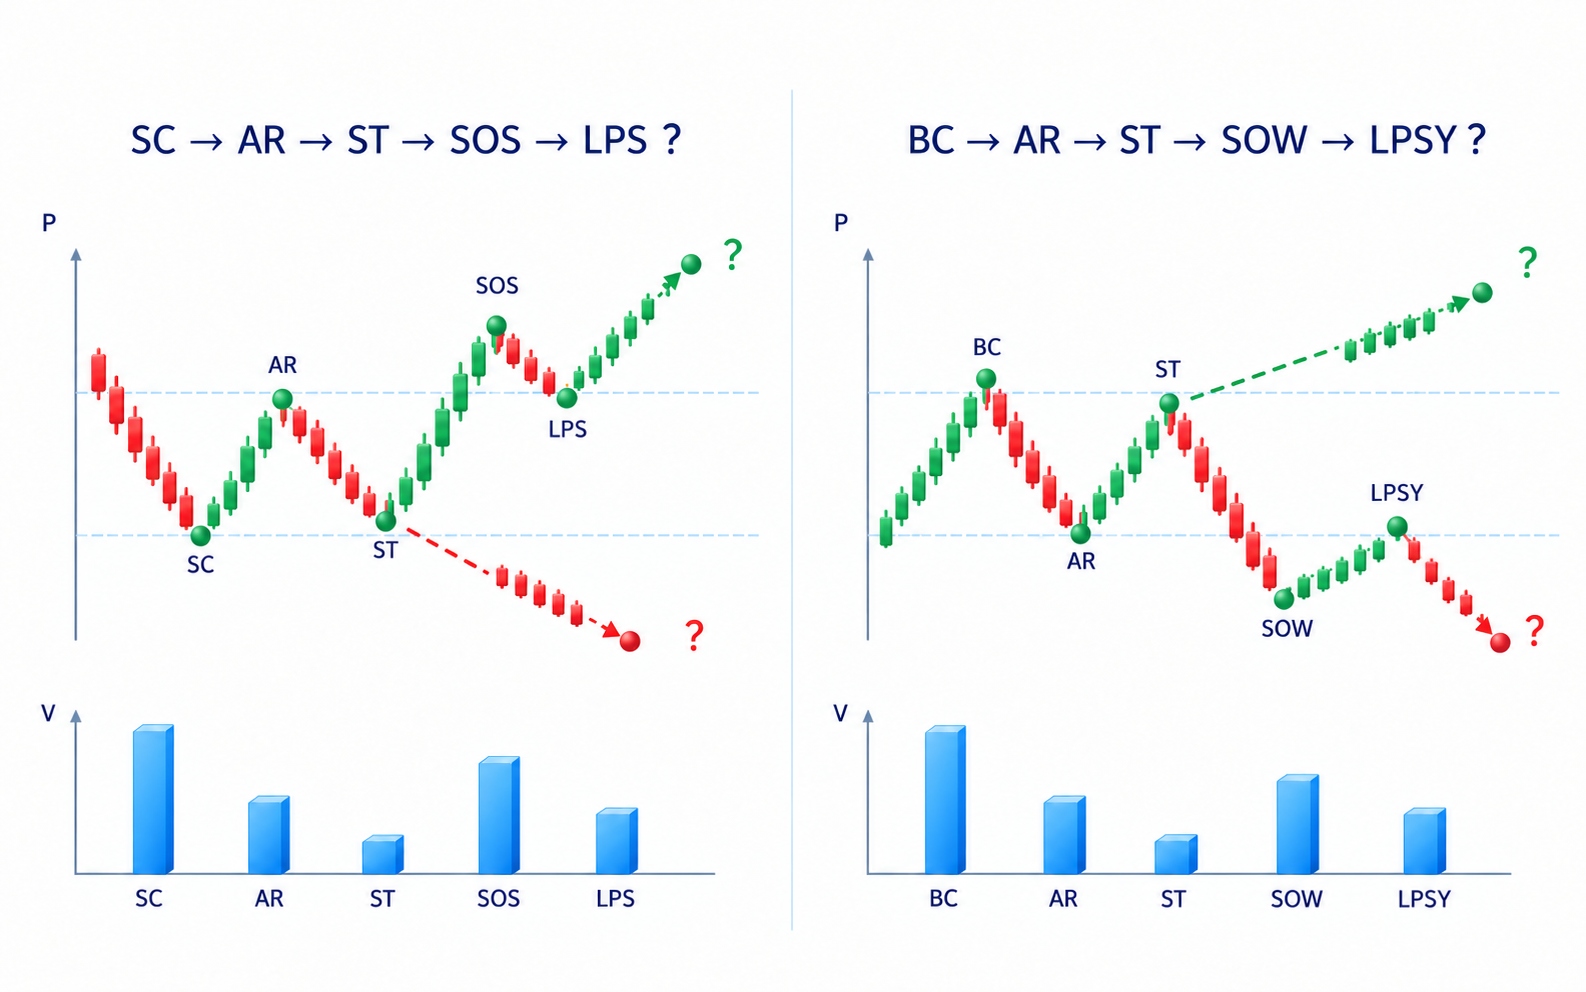
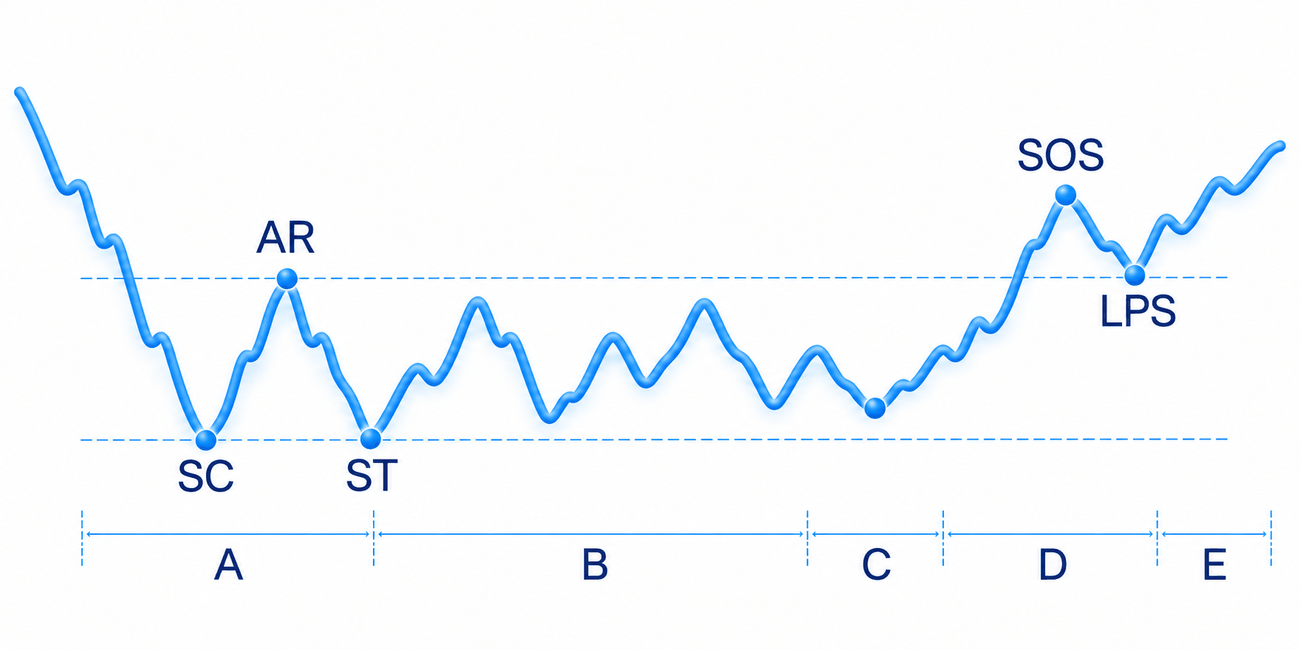
Phase A describes the previous decline coming to a halt. Preliminary support, or PS, marks the first notable attempts to stop the fall. A selling climax, or SC, describes intense selling followed by a halt or rebound. The automatic rally, or AR, helps identify the range's upper area. A single rebound does not establish that the entire accumulation process is complete.
Phase B describes the range developing as its boundaries are tested. A secondary test, or ST, revisits the area of the initial stopping action. Compare how far price falls, the volume involved and the progress made: is it becoming harder to move lower? There can be several tests, and early swings need not be narrow or quiet.
Phase C concerns a test of remaining supply. In one version, a spring briefly takes price below support before it returns inside the range. A later test may have a smaller range and lower volume. A spring is optional, however. A quick recovery above a low does not by itself confirm a buying opportunity.
Phase D shows evidence of strength and progress towards the range's upper area. A sign of strength, or SOS, is an advance with clearer upward progress, often accompanied by wider price ranges and greater volume. A last point of support, or LPS, is a pullback after that strength, typically with a smaller range and lower volume. SOS is the advance; LPS is the subsequent test on a return. They are different events, not two names for the same entry.
Phase E describes movement beyond the range and the development of an advance. Pullbacks and further pauses remain possible. If price returns inside the former range and keeps making lower lows, the original accumulation explanation needs reassessment. A schematic helps organise a sequence; it cannot justify keeping a position after the idea has failed.
Spring, UTAD and distribution
Distribution uses the same phase letters with a different direction. In A, the advance stops; in B, the range develops; in C, remaining demand is tested; in D, weakness emerges; in E, a decline develops. A buying climax, or BC, describes intense activity around the end of an advance. The following automatic reaction down helps establish the lower boundary. It is also abbreviated AR, but means Automatic Reaction here, not the Automatic Rally of accumulation.
An upthrust is a move above resistance that returns below it. An upthrust after distribution, or UTAD, is such a test late in a suspected distribution range. A spring moves below support and returns inside suspected accumulation; a UTAD tests above resistance late in suspected distribution before returning below it. Both need context and subsequent evidence. Not every upthrust is a UTAD, and distribution can develop without one.
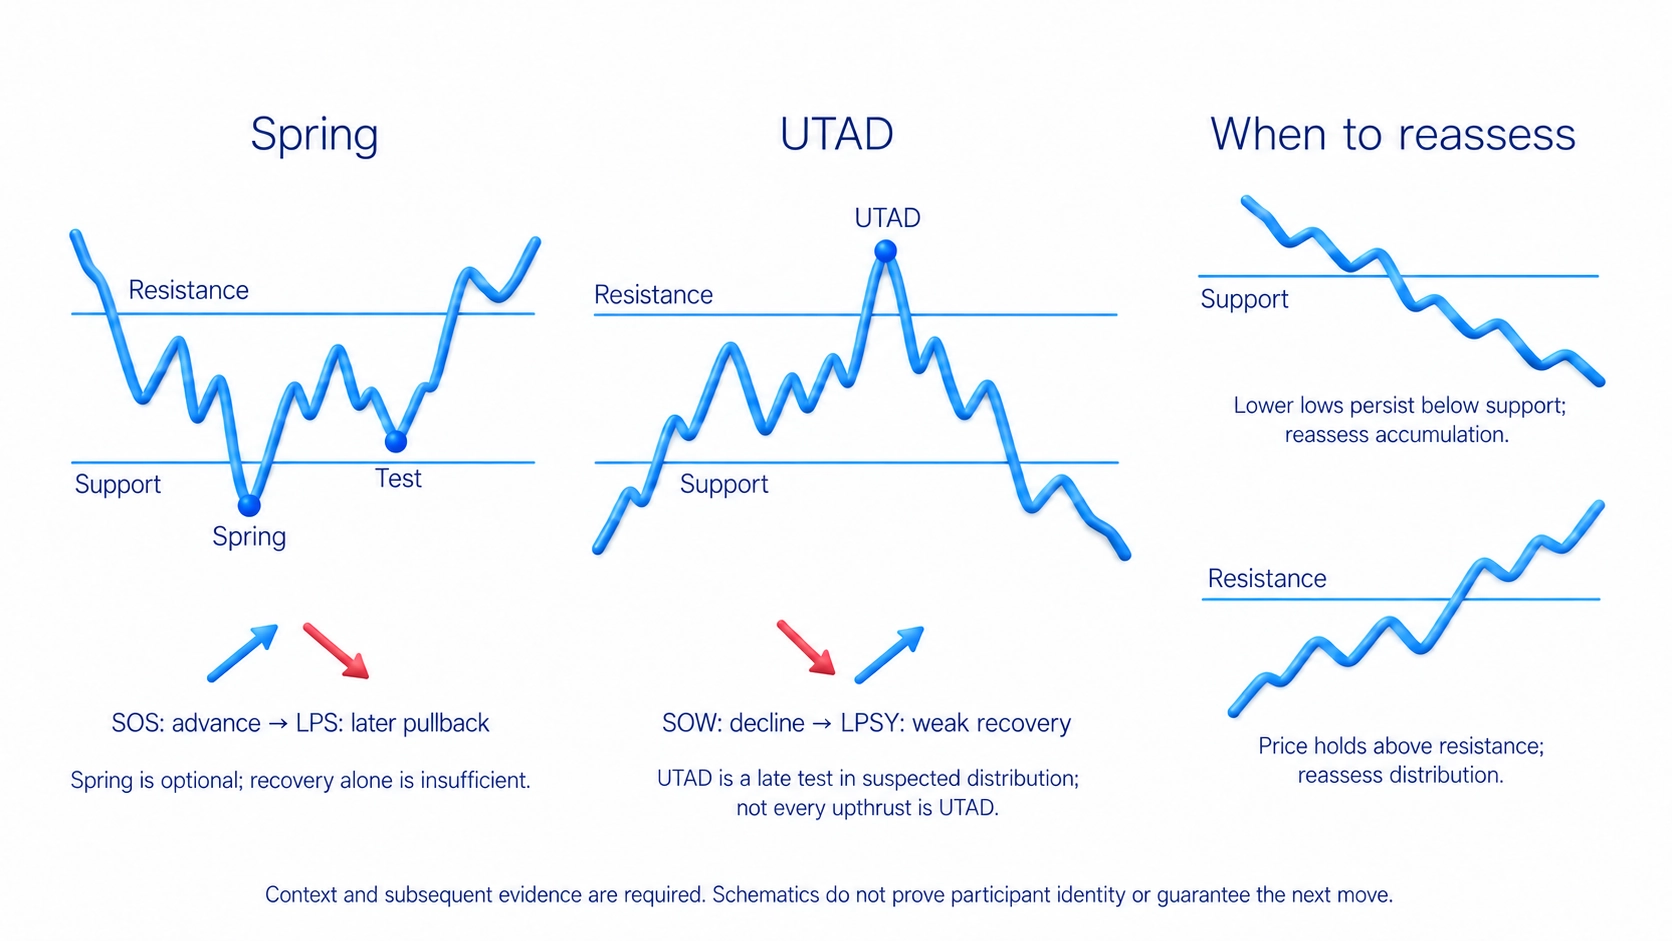
A sign of weakness, or SOW, is a notable decline towards or through support. A last point of supply, or LPSY, is a weak recovery after that decline. The useful sequence is downward progress, a recovery that fails to regain the previous position, and renewed weakness. Naming an isolated high an upthrust does not establish that sequence.
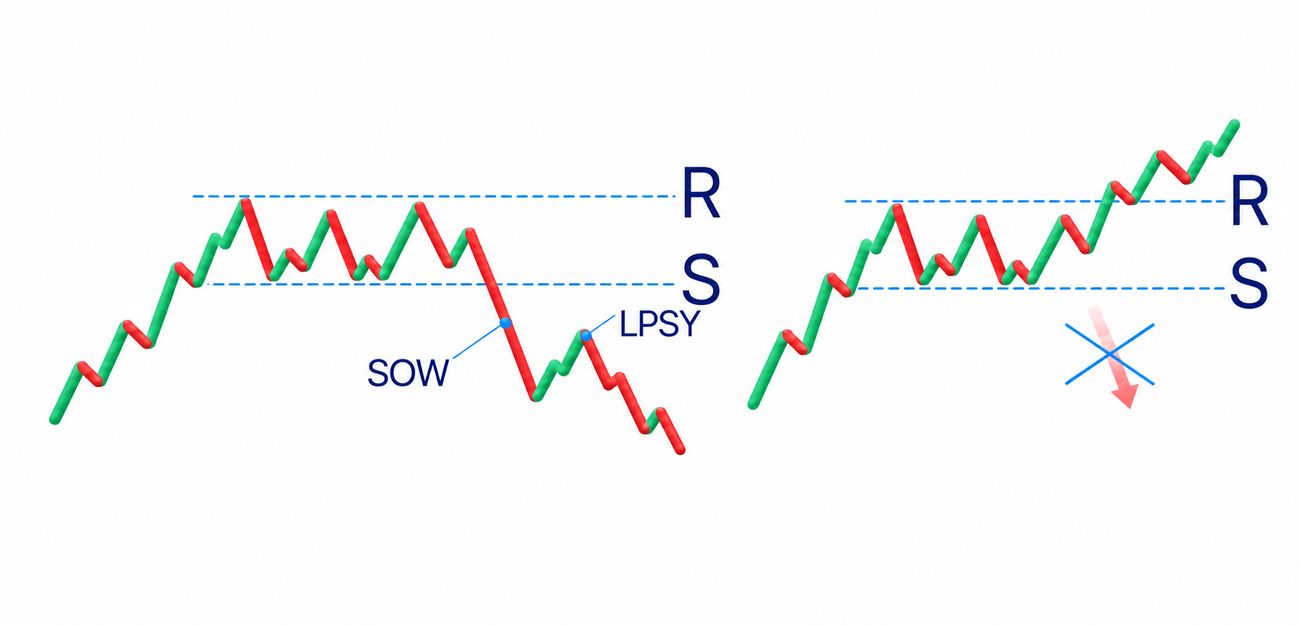
A completed teaching diagram places events after the outcome is known. On a live chart, the next part is still missing. Write down which move and reaction would support the interpretation and which would reject it. If price holds above resistance and continues higher, earlier heavy volume is not a reason to insist that the range was distribution.
How to test a phase on a chart
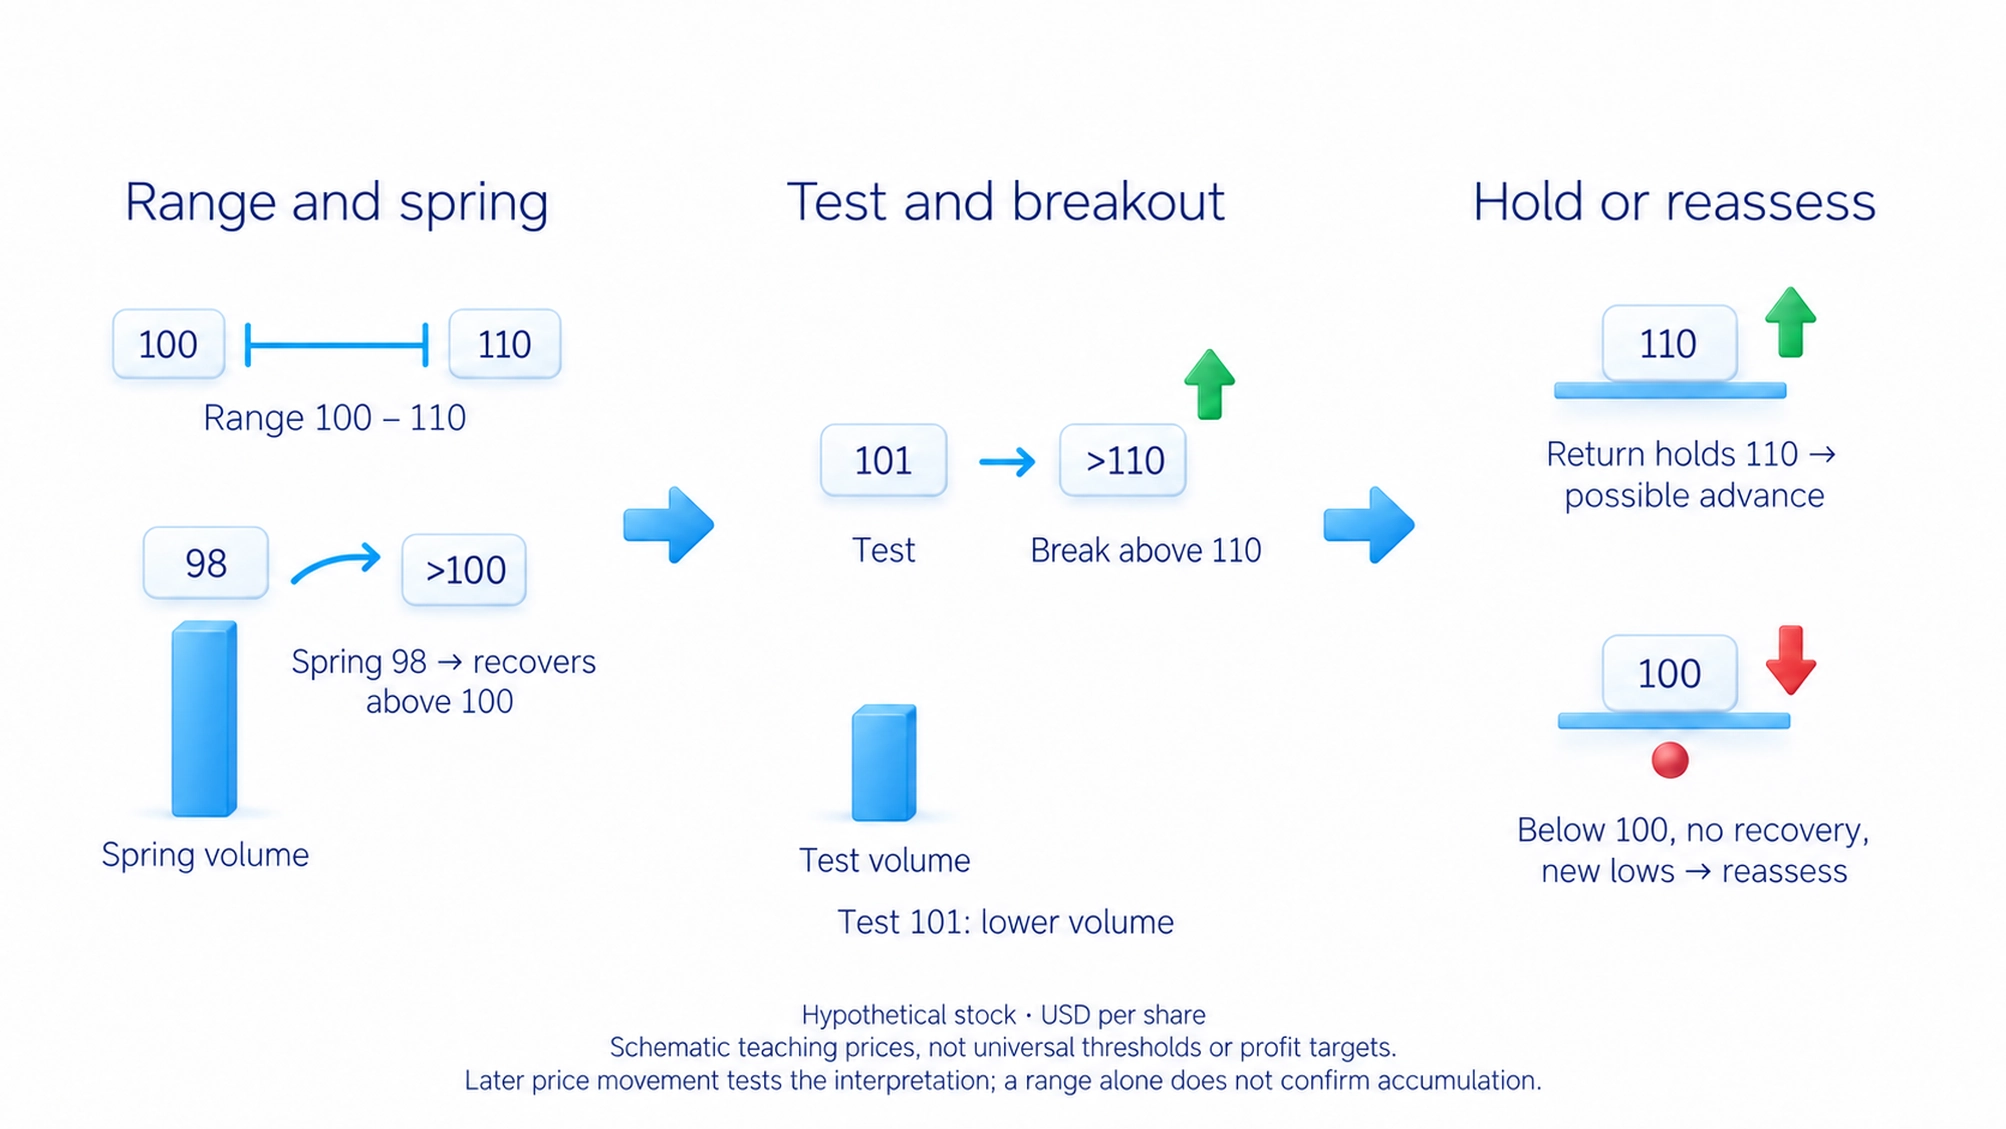
Consider a hypothetical stock priced in US dollars. After falling, it trades repeatedly between $100 and $110. One visit to $100 has heavy activity, but the decline stalls. That identifies an area worth observing. Until later movement provides more evidence, the range might be accumulation or a pause before another decline.
Price then reaches $98 and recovers above $100. Within this range, that resembles a spring. The next decline stops at $101 on lower volume, followed by a move above $110. A return to the $110 area holds and the advance resumes. The developing sequence now gives more support to an accumulation interpretation than the first rebound did.
The opposite development would reject that interpretation: price remains below $100, fails to recover the area and makes new lows. These teaching prices are not universal thresholds or profit targets. They illustrate the order of observation: identify the area, examine an exit, assess the return and compare the next move with the original idea. The chart-reading guide explains how to mark support and resistance areas.
Wyckoff on Forex and cryptocurrencies
The comparison can be used on different markets, but first establish what the data measure. Exchange volume records the quantity traded in a particular instrument. Tick volume on a retail currency chart counts quote updates; it is not the quantity traded by all banks across the foreign-exchange market. The Forex guide explains the market and the products used to trade currency prices.
For currency analysis, I use exchange futures data. A future is a separate contract with its own expiry and trading conditions. Its volume does not cover the entire currency market, and its price need not match another currency product exactly. Activity also migrates between contracts as traders change the contract month. Ignoring that change can make activity appear to weaken when trading has moved elsewhere.
On cryptocurrencies, one exchange's volume describes trading reported there, not every exchange combined. In a thinly traded coin, relatively small transactions can move price sharply and disrupt a range. Neither a recognisable diagram nor unusual volume can identify deliberate manipulation rather than another source of movement on its own.
How I use Wyckoff in a trading system
In the course's effort-versus-result lesson, I examine gold futures. An advance on high volume stalls, price forms a range, and the next attempt to rise does not continue. Lower levels then appear. What matters for my analysis is the change from substantial activity to a different price structure.
After a strong move, I look for a return towards the earlier area and check whether the new direction resumes. In the course example, the return towards the breakout area has low volume, followed by renewed decline. The entry is not based on certainty that a large player is selling. A price area and a sequence of reactions come first, followed by the trade's conditions. The trading-system guide explains how to organise those conditions into consistent rules.
For practice, mark the suspected phase, relevant events, volume source and a condition that would invalidate the interpretation on one chart. Revisit the record after new price movement. Which observations supported the idea, and which required a revision? My Wyckoff-method video adds an introduction; the written explanation above is complete without watching it.
Before opening a position, set a cash loss budget using the risk-management rules. A trade based on a convincing schematic can still fail, and a protective exit order's actual execution can produce a larger loss than planned. Identifying a phase does not establish a particular win rate. The method organises an explanation to test; risk rules address the consequences when that explanation fails.
Frequently asked questions
It compares supply and demand, cause and effect, and effort versus result. Price and volume help assess a range and its subsequent development. They do not identify every position holder or guarantee the next move.
The broad cycle consists of accumulation, markup, distribution and markdown. Phases A to E describe a range's development, not five additional stages of that cycle. A real chart need not reproduce a teaching diagram exactly.
Look for a decline stopping, a range forming and repeated tests of support. A possible spring needs later evidence of strength and movement beyond the range. Accumulation can develop without a spring, and a range alone does not confirm it.
A spring moves below support and returns inside suspected accumulation. A UTAD tests above resistance late in suspected distribution before returning below it. Their direction and context differ. Neither is mandatory, and both need subsequent evidence.
SOS is a sign of strength expressed as clearer upward progress. LPS is the following pullback or support test. One is an advance and the other tests it on a return; they are not interchangeable buying signals. Their meaning depends on the range's development.
You can compare price and trading activity after checking the data source. Currency tick volume does not measure all Forex transactions. Futures and individual crypto exchanges report their own trading. A familiar schematic does not remove data limitations or execution risk.
About the author
Igor Arapov, practising trader since 2013 and author of the ArapovTrade library. ORCID: 0009-0003-0430-778X.




