Market microstructure explains how buying and selling instructions become trades. It connects the price on your screen with the orders available to execute your next purchase or sale.
A chart shows what happened. An order book shows some of what participants are offering now. Those are different sets of information. This lesson follows continuous trading in an electronic order book; opening auctions and dealer markets can work differently. The broader roles of venues and participants are explained in how an exchange works.
Bid, ask and last price: which price can you trade?
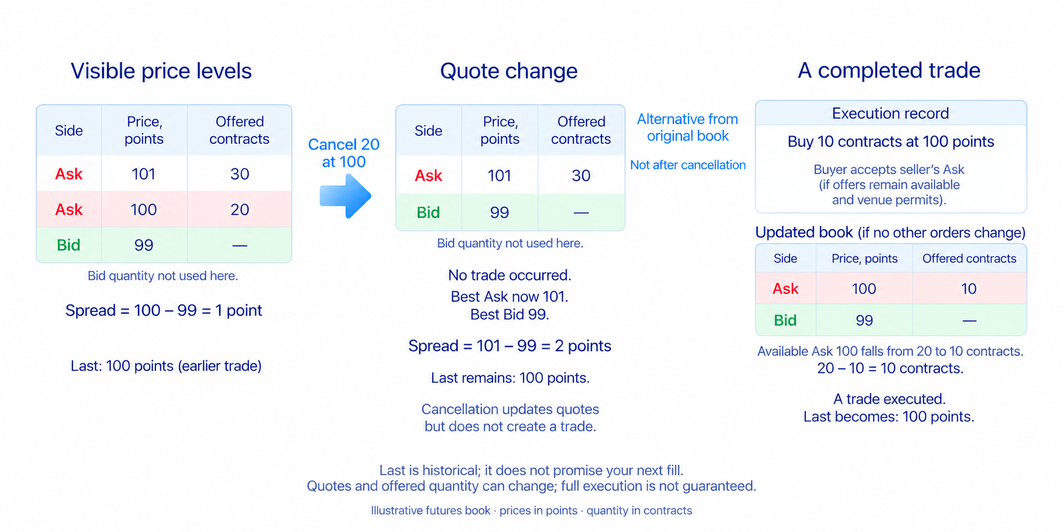
The bid is the highest available buying price in the book you are viewing. The ask is the lowest available selling price. Buying without waiting normally means accepting the ask; selling without waiting means accepting the bid, subject to available quantity and the venue's execution rules.
The last price is the price of a completed trade. The offers may have changed since that trade, so it does not promise the price of your next order. Check whether your chart is built from completed trades, bid quotes or another price feed. A candle touching a price is not proof that enough shares or contracts were available for your order there.
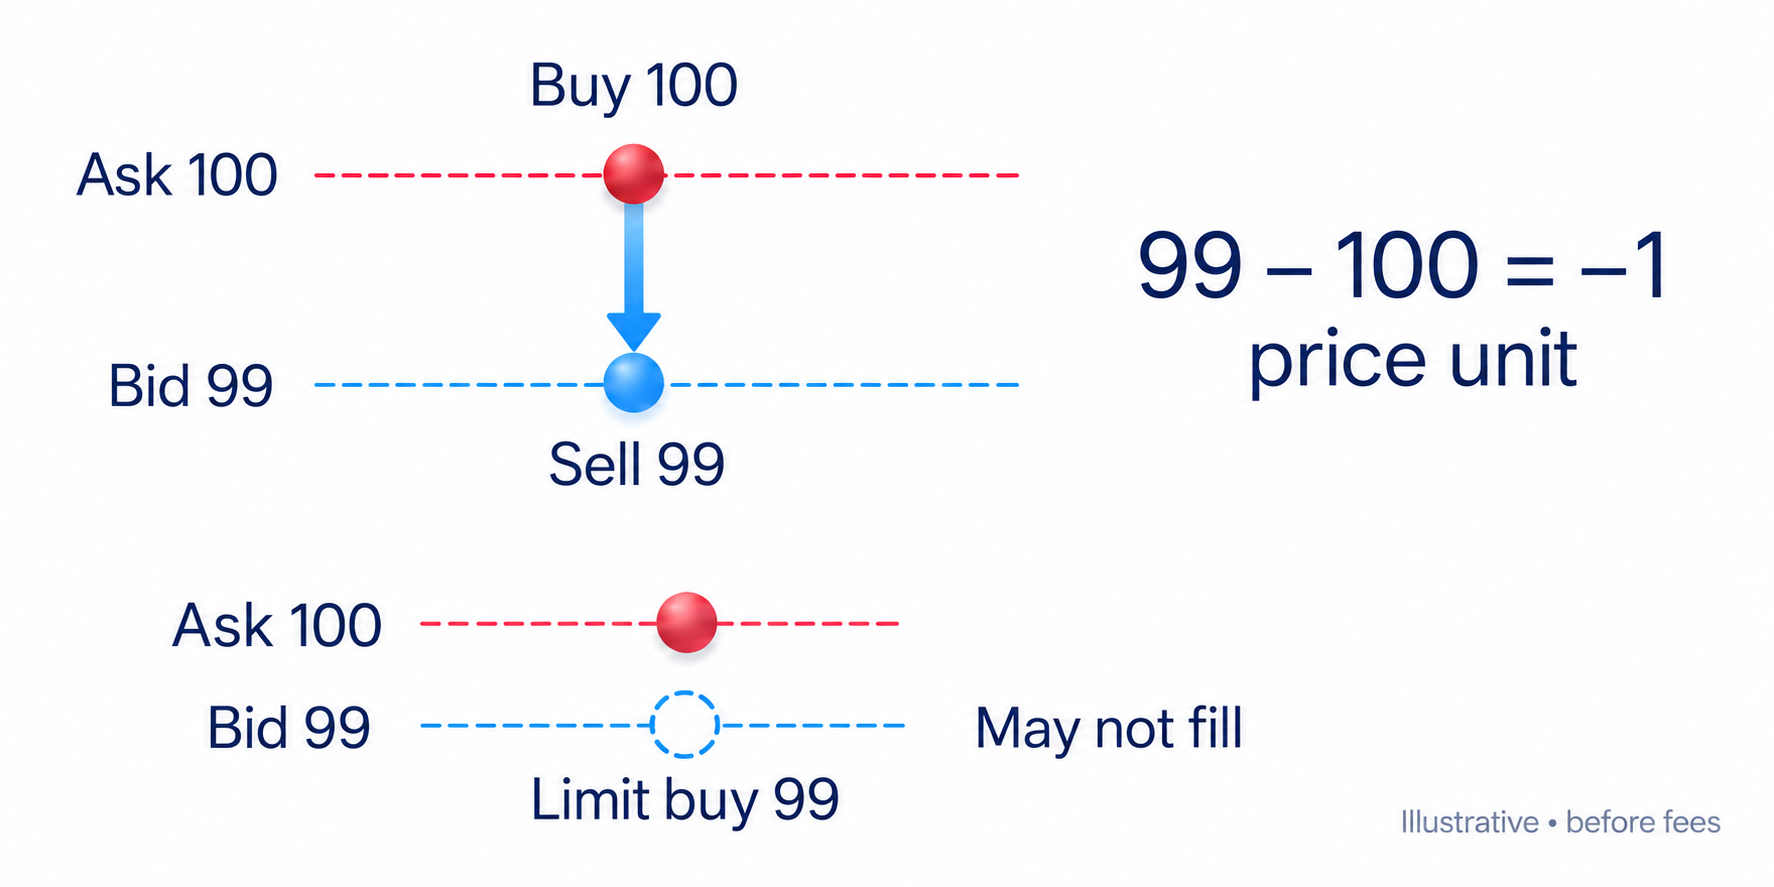
The spread is the difference between the best ask and bid. Buying at the ask and immediately selling at the bid with unchanged quotes loses that difference before fees. In short-term trading, it can consume a substantial part of a small price target.
The spread changes when orders change. Participants may withdraw quotes before news or offer more competitive prices when trading activity returns. A waiting limit order can avoid accepting the current ask or bid, but the trade may never happen. Compare the actual execution conditions rather than assuming that a low advertised spread means low total costs.
What an order book shows
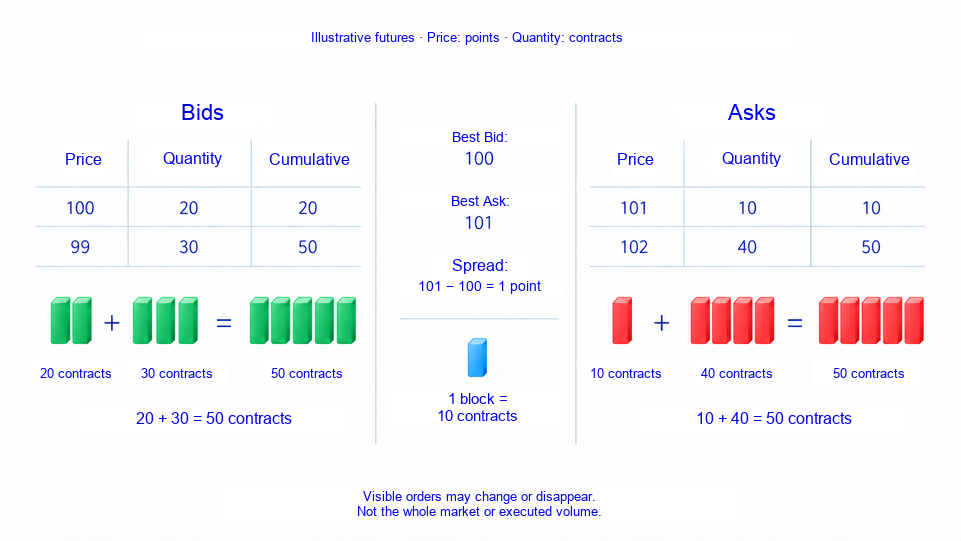
The order book lists visible buy and sell orders by price. Each row usually shows the combined quantity offered at that level, measured in shares, contracts or other units. This is quantity waiting to trade, not completed trading volume.
A row showing 500 contracts might combine several orders. It does not mean 500 traders, and it does not identify a particular bank or fund. Even a feed showing individual orders may conceal who owns them. Size alone cannot establish the participant's identity or reason for trading.
Your display may show only a few price levels or arrive with a delay. Hidden orders and interest on other venues may be absent. Check the market, data subscription, displayed depth and delay before interpreting a screenshot as the whole market.
Participants add, change and cancel orders. A large row can disappear without becoming a trade. Compare changes in the book with actual executions; otherwise an ordinary cancellation can look like buying or selling that never happened.
How orders match and prices move
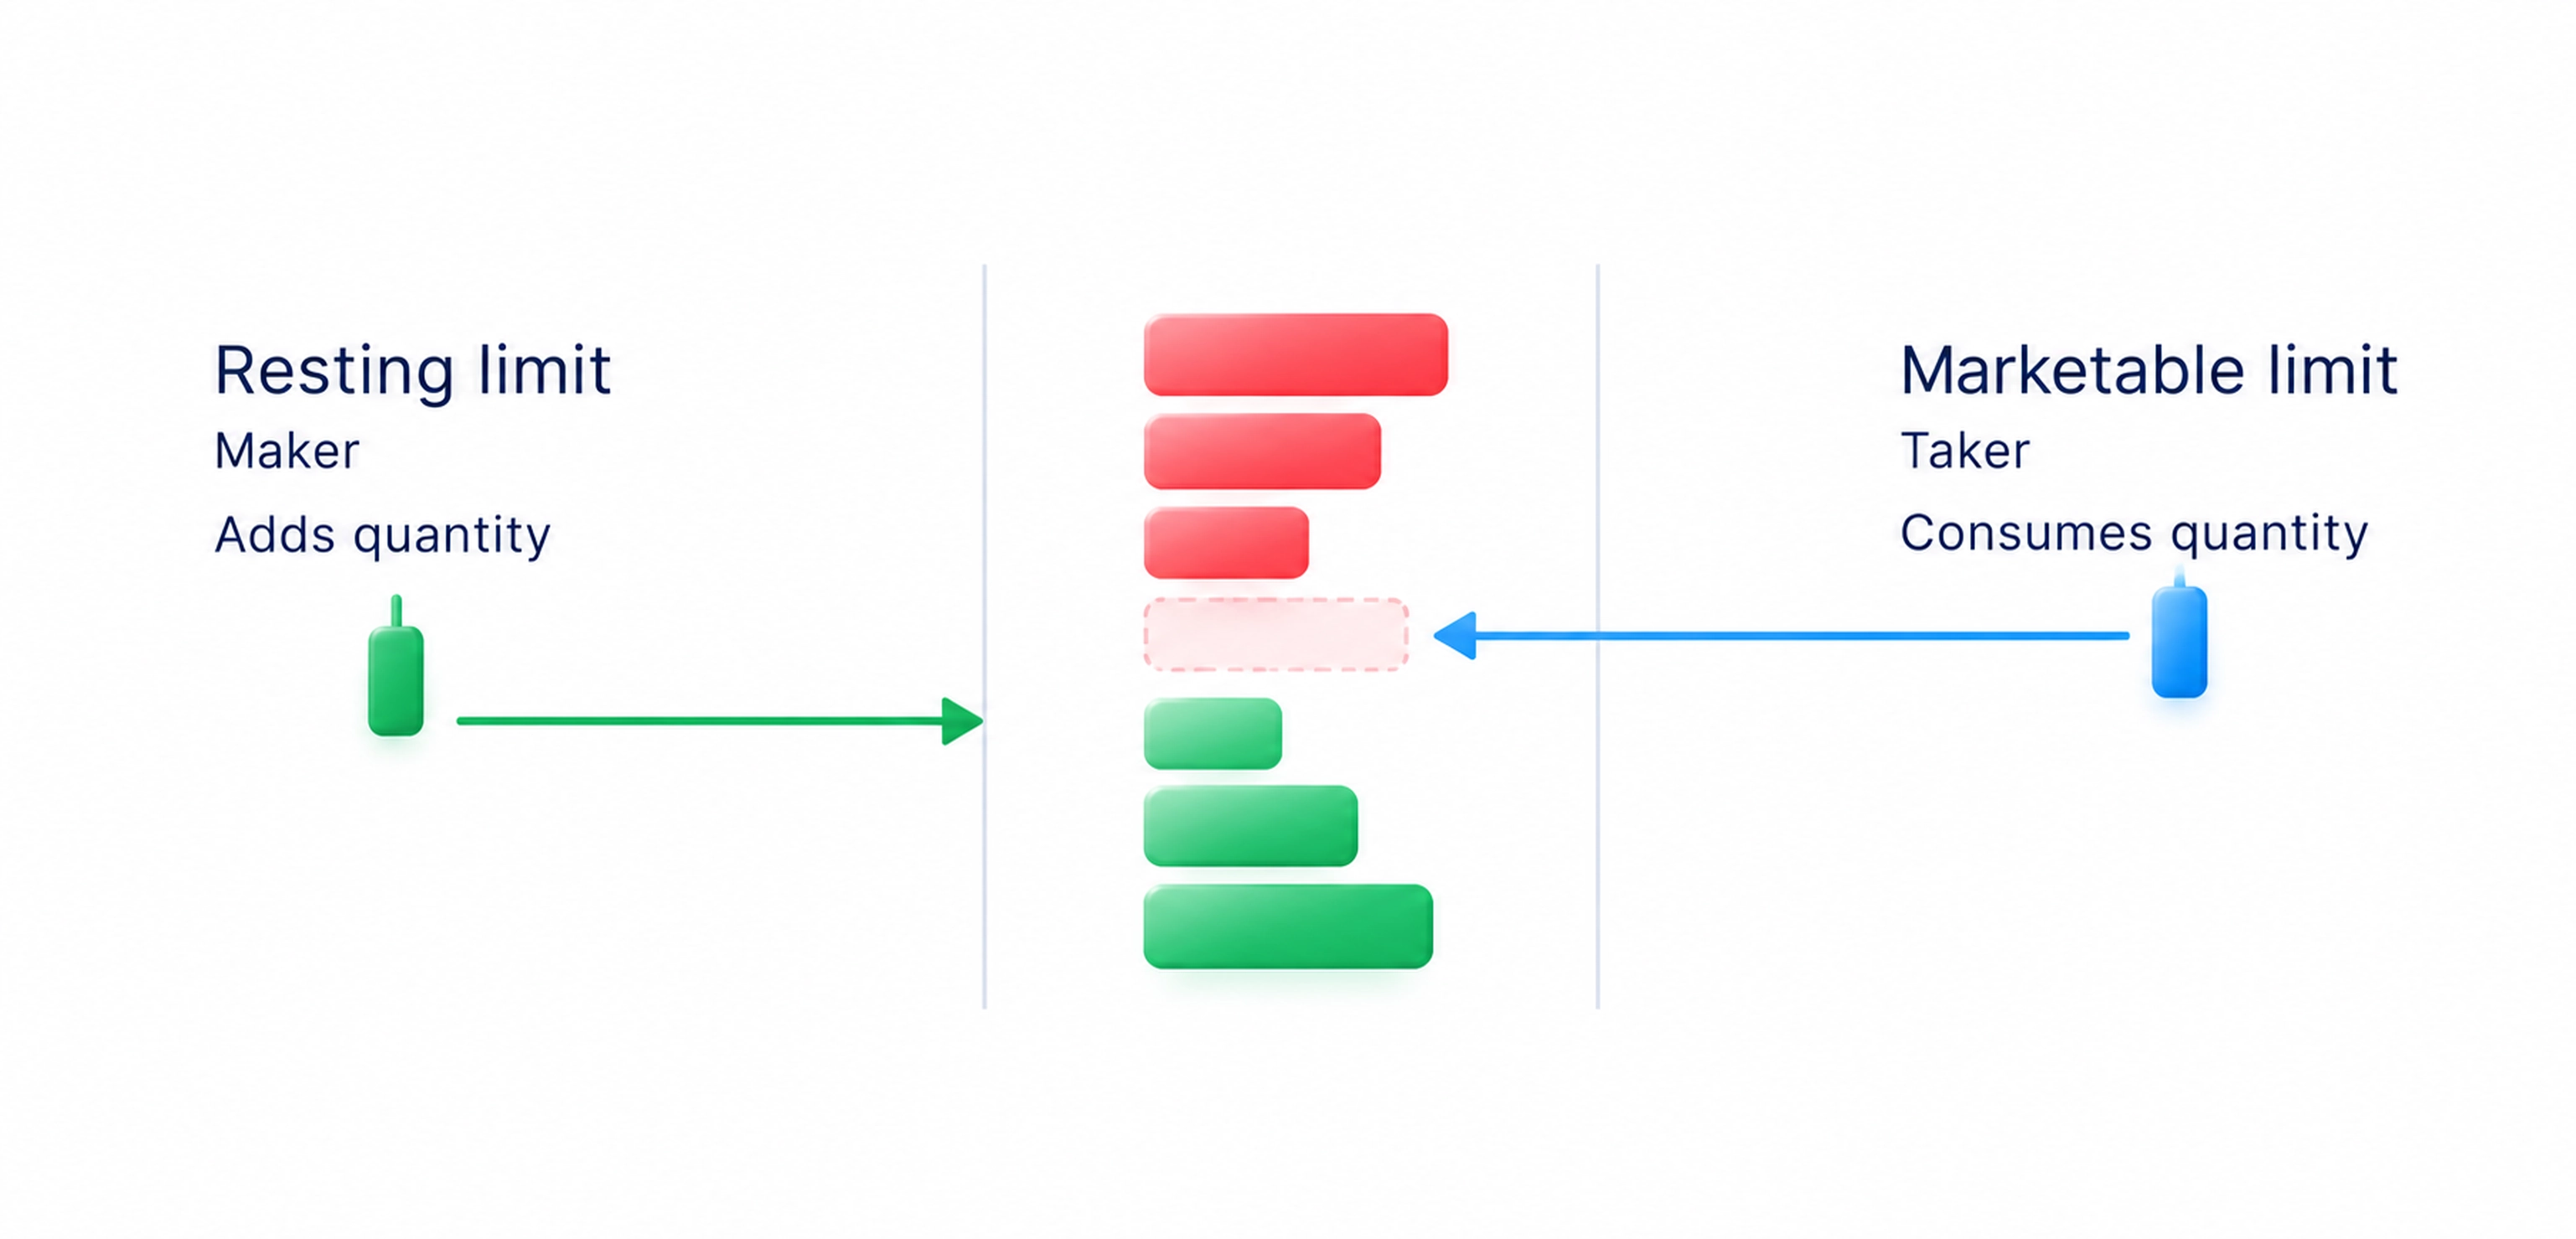
A market order seeks a trade against available orders without setting a fixed execution price. A limit order specifies the highest buying price or lowest selling price you will accept. A limit can wait in the book, but it can also trade immediately if existing prices satisfy that limit. Activation, price protection and order duration are covered fully in trading order types.
A maker adds waiting quantity to the book. A taker trades against quantity already available. These describe execution roles, not two permanent kinds of trader. An immediately executable limit order can be a taker. Fee schedules may distinguish the roles, so do not assume that every limit order receives the maker rate.
Several orders can wait at the same price. With price-time priority, the better price comes first and earlier orders have priority within that price. Other products allocate trades partly by order size or use a combination of rules. A price appearing on the chart therefore does not establish that your place in the queue was reached.
Every completed trade has a buyer and a seller. Prices do not rise because a trade has more buyers than sellers. Later trades can occur at higher prices when buyers accept higher offers after the quantity at lower prices has traded or been withdrawn. Selling against bids can move execution down through the buying side in the same way.
Quotes can change without a trade. Removing the best sell order can raise the ask; adding a sell order inside the spread can lower it. That changes an available offer, not necessarily the last-traded price. Separate quote updates from executions when explaining a movement.
Liquidity and slippage: a worked example
Liquidity describes how readily you can trade the required size without unacceptable costs or price movement. The spread, quantity at nearby prices and arrival of new orders all matter. A high daily turnover does not guarantee enough quantity at the moment you submit an order.
Slippage is a difference between the execution price and the price you expected. It can arise when an order uses several price levels or when quotes change while the instruction travels from your terminal. A limit controls the acceptable price, but may leave some or all of the order unexecuted. Trading halts and venue protections can also prevent execution.
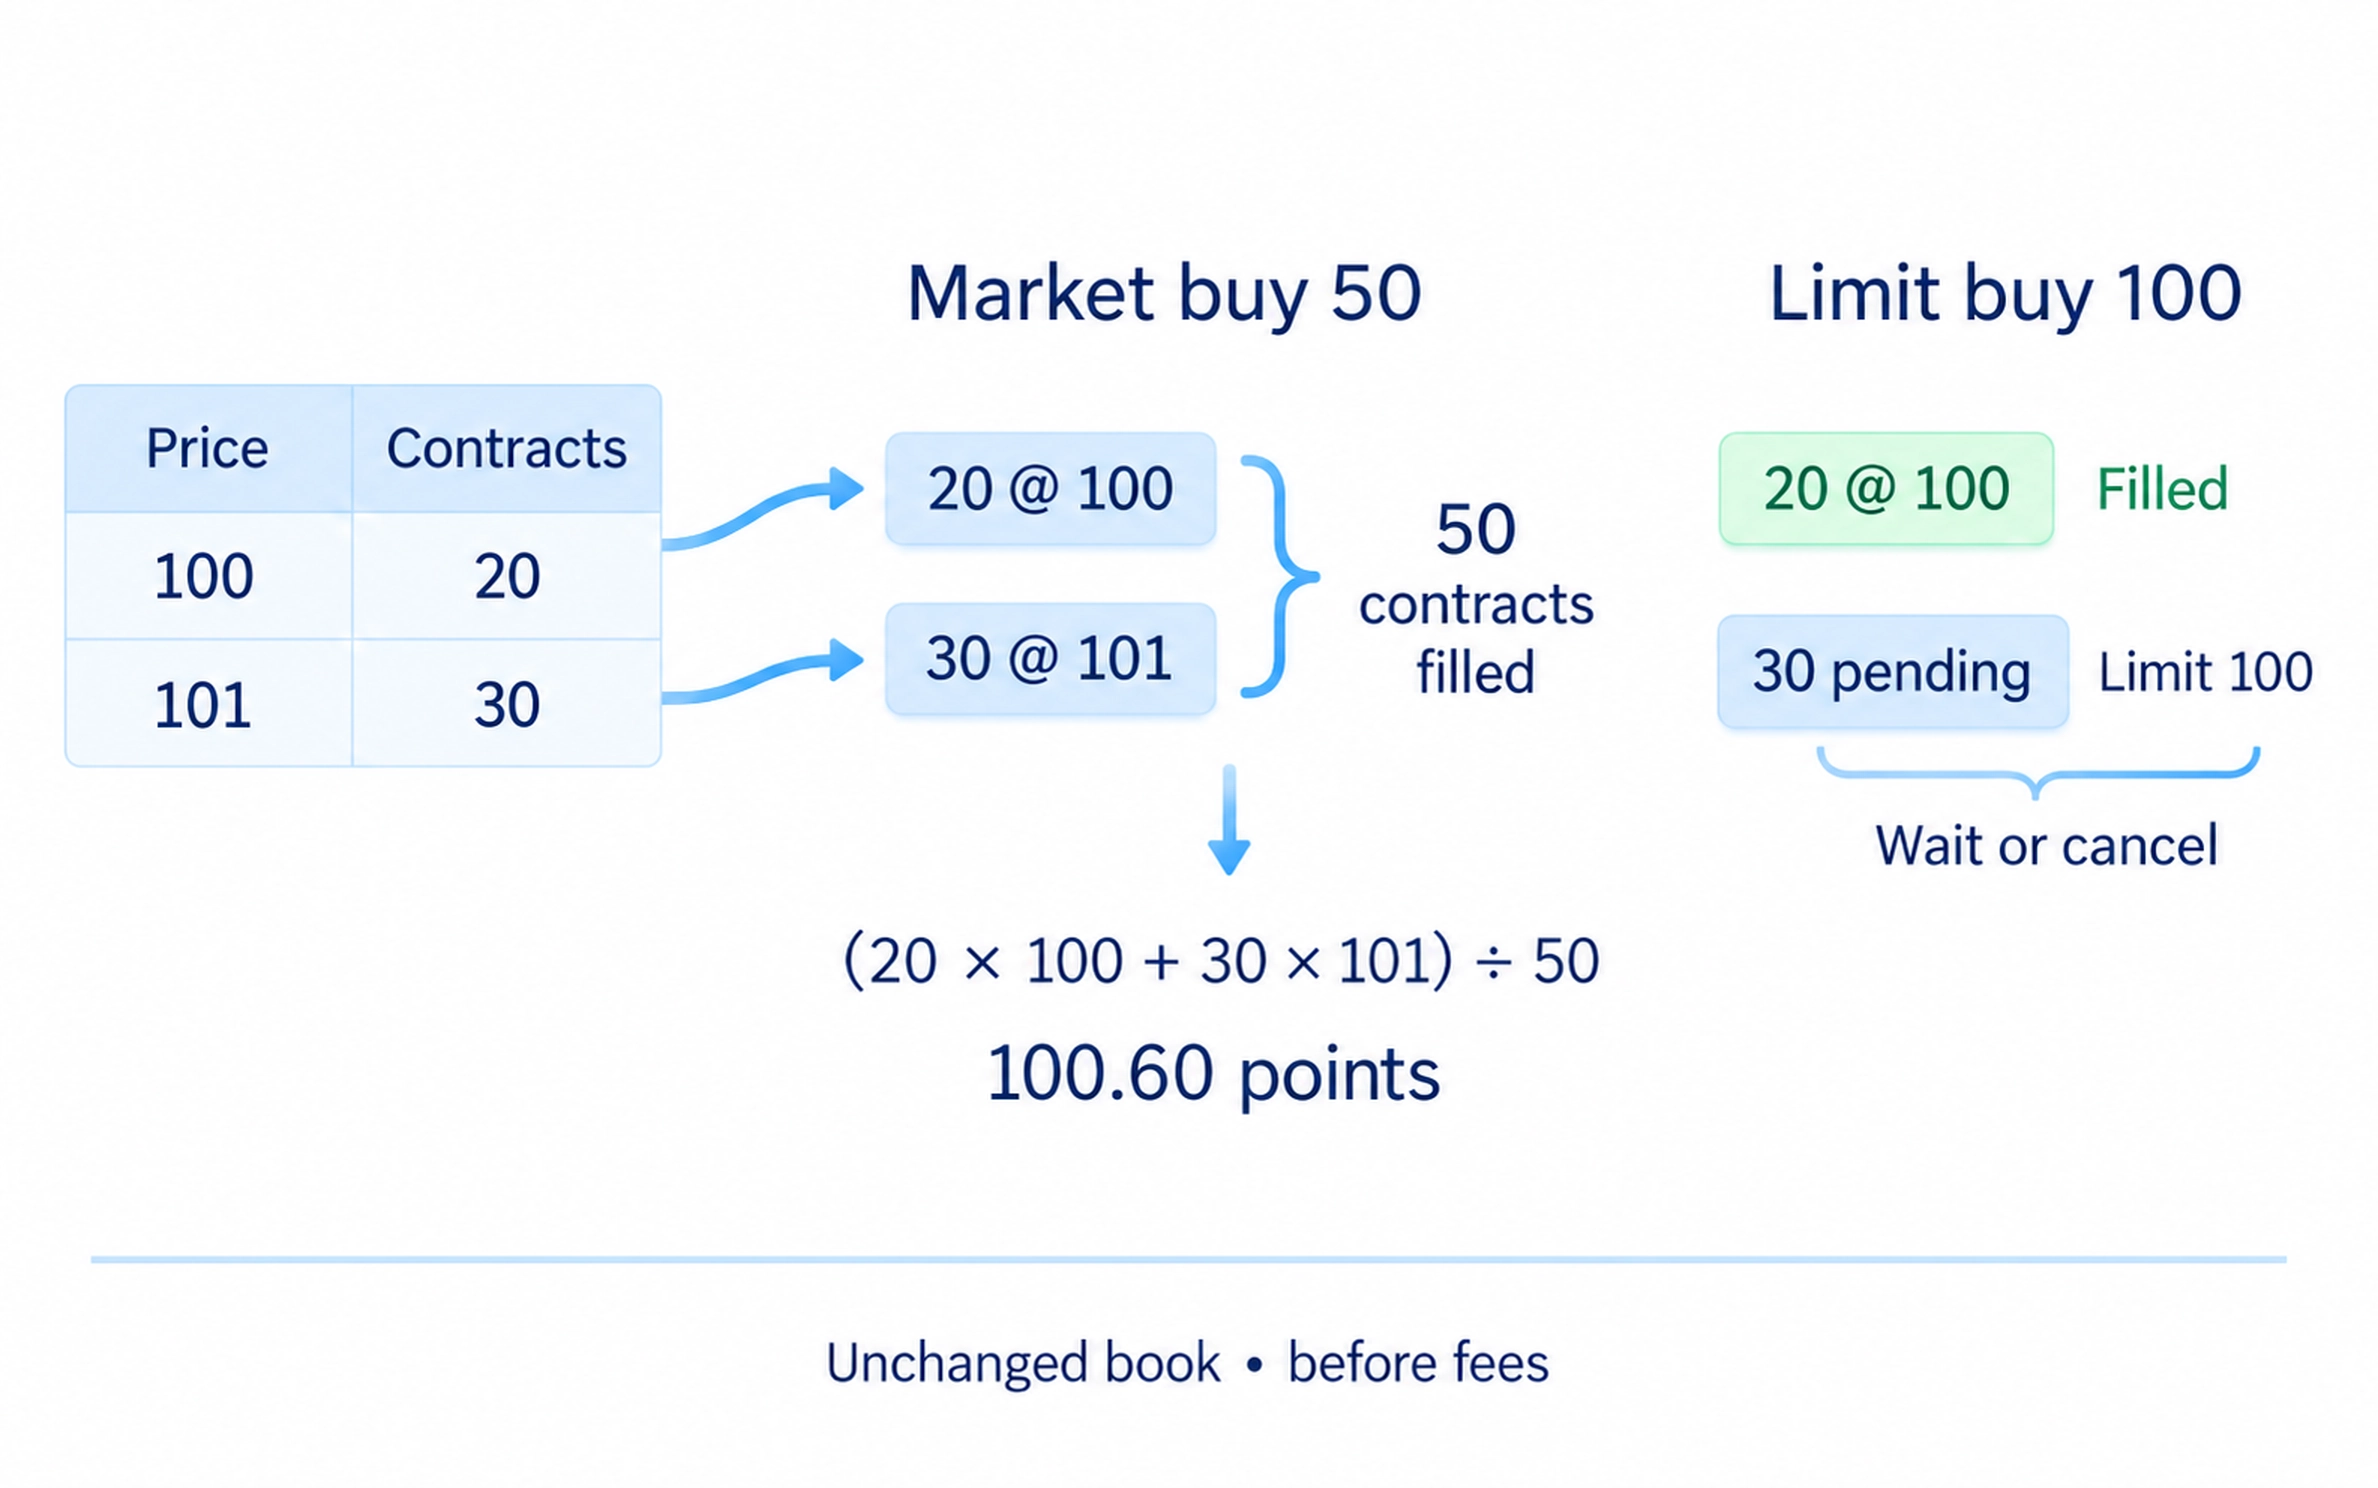
Consider a simplified futures book with prices in illustrative points, before fees. Sellers offer 20 contracts at 100 and 30 at 101. A market buy for 50 contracts takes both rows if those offers remain available and the venue permits the execution. Its average price is (20 × 100 + 30 × 101) ÷ 50 = 100.60 points. The visible ask of 100 covered only the first 20 contracts.
A buy limit of 100 in the same book can trade only the 20 contracts available at that acceptable price. The remaining quantity may wait or be cancelled according to the instruction's conditions. Price control and immediate completion are separate choices; neither tells you where the market will move next.
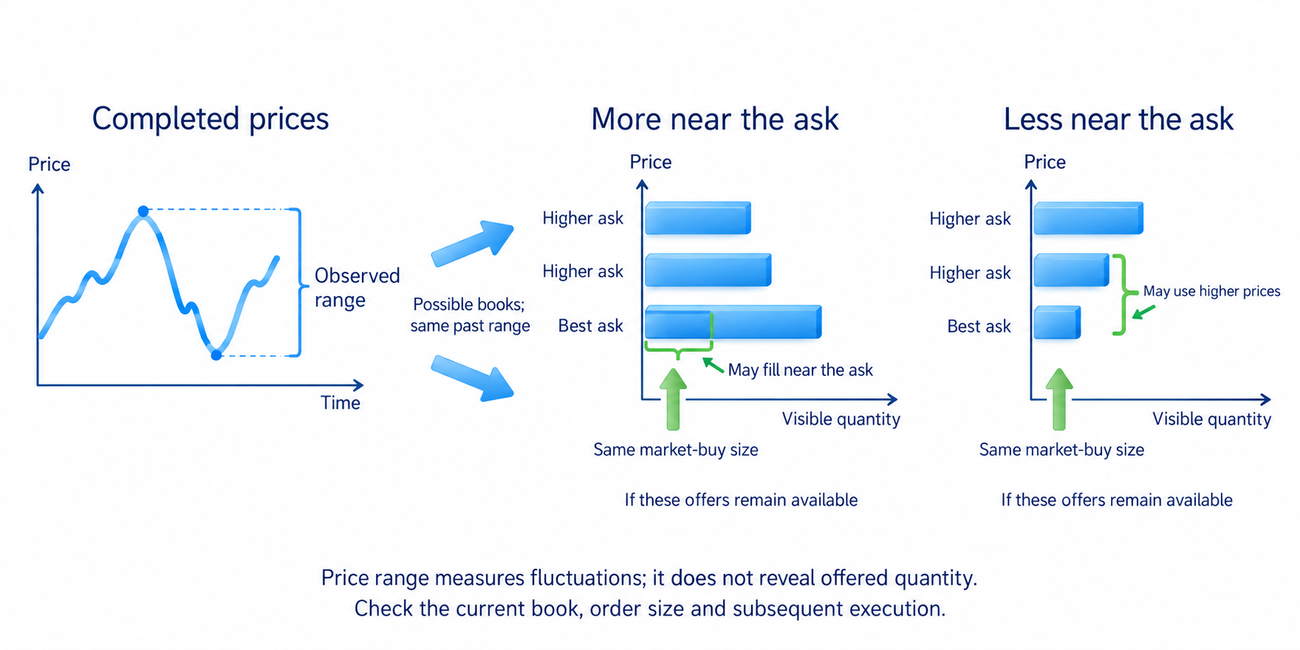
Low liquidity can accompany sharp price changes, but liquidity is not the same as volatility, the size of price fluctuations. The ATR indicator illustrated below measures price ranges, not the number of contracts available to buy or sell. Its reading cannot reconstruct the order book.
Completed trades and hidden orders
The trade tape records completed trades with their time, price and quantity. The book shows offers; the tape shows executions. A trade of 100 contracts contributes volume of 100, not 200: its buying and selling sides are not counted twice. Volume analysis explains how completed quantity relates to price movement on the chart.
A trade described as buying at the ask usually means that the initiating order accepted a seller's offer. It still has a seller. Check how your platform assigns that label: the exchange may supply the active side, or software may estimate it from prices and quotes. A colour on the tape is not a statement of the trader's intention.
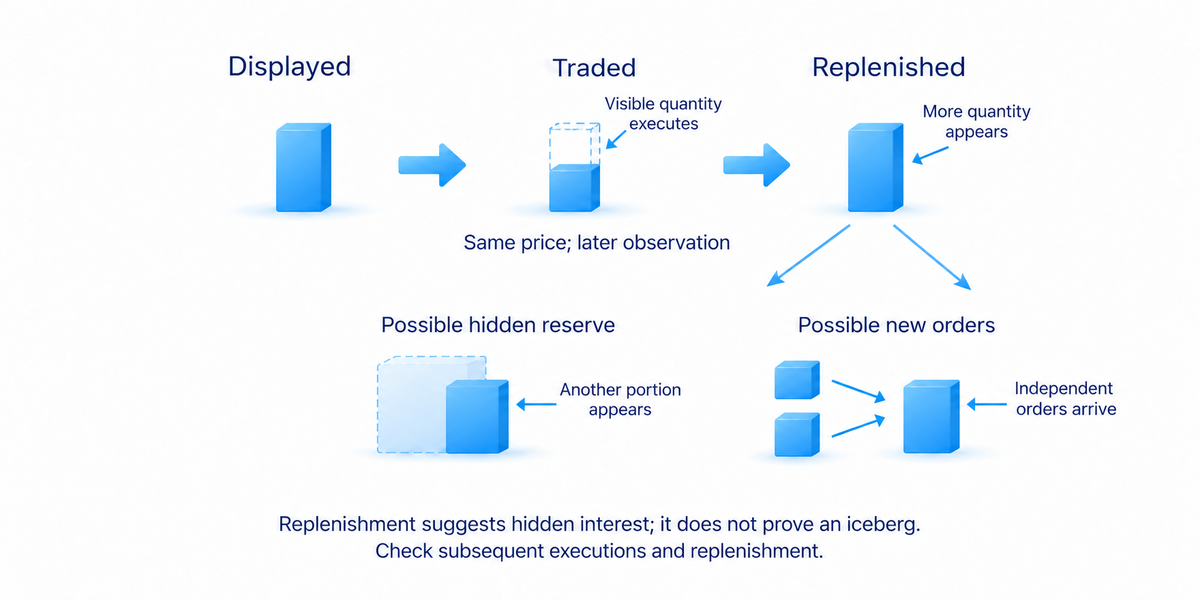
An iceberg order displays only part of its quantity. Another portion may appear after the displayed part trades, allowing more quantity to execute at a price than a screenshot showed. Repeated replenishment can suggest hidden interest, but new independent orders can produce a similar pattern.
Stops generally do not appear as ordinary executable limits before activation; the broker and venue determine how they are held and triggered. A concentration of stops beyond a high is an inference about behaviour, not a list read directly from the book. The interpretation of those areas is developed separately in liquidity pools in trading.
Spoofing involves orders entered with an intention to cancel them before execution to mislead other participants. One cancelled row does not establish that intention. An iceberg used to execute a genuine trade is not spoofing merely because part of its quantity is hidden.
What a market maker does
A market maker quotes buying and selling prices and accepts trades under specified conditions. Formal quoting obligations depend on the market and its rules. This activity can help provide buyers and sellers, but it does not guarantee a fixed spread or unlimited quantity.
The difference between buying and selling prices can generate income, while holding a position creates risk: the instrument may fall before it can be sold. Quotes and offered quantities therefore change with conditions and positions held. A market maker can also use orders that take liquidity; the participant's business role does not dictate one order type for every trade.
High-frequency trading, or HFT, uses automated systems to send and update orders very quickly. Direct venue data and servers close to the venue can reduce message delays. Fast participants may update quotes before a slower feed shows the change. An offer still visible on your screen may already be unavailable at the venue. This helps explain unexpected execution, but it is not evidence that a market maker personally selected a beginner's stop.
How I connect order mechanics with the chart
In the course's worked example around a price level, I follow a euro futures diagram. Price first moves above a level during active trading. The next rising bars, each representing a period on the chart, become smaller; selling then breaks local support areas. The important observation is the lack of further upward progress after the initial activity.
My interpretation is that selling could have met buying activated by the break. The chart and combined volume do not identify the owners of those orders. The practical task is to observe what happens afterwards: does price remain above the area, or return and begin falling? This is an interpretation to check, not a promise that the next example will finish the same way.
For practice, choose one instrument and record the data source. Compare the best bid and ask, nearby quantity and subsequent trades. If an order executes at an unexpected price, check its size, changes in the book and feed delay. If a limit does not trade, check the queue and order conditions rather than relying on a candle touching the level.
The optional video Limit and market orders, illustrates how one participant offers a price and another accepts it. Use the written mechanics first, then compare what changed in the book with what actually traded.
Frequently asked questions
It is the way orders interact and trades are executed. It explains where available prices come from and why an execution can differ from the price expected from a chart.
The bid is the best buying offer and the ask the best selling offer in the selected book. The last price belongs to a completed trade. Offers can change afterwards, so it does not promise the next execution price.
Buying at the ask and selling at the bid with unchanged quotes loses their difference before fees. That difference can consume a large part of a small price target. Fees must be checked separately.
There may be too little opposing quantity at the first price. A market order can then trade against the next levels, where permitted. A limit restricts acceptable prices but may leave quantity unexecuted.
It shows visible offered quantity at that moment. Orders can be cancelled and some quantity can be hidden. Check subsequent trades and replenishment before judging whether the level will hold.
A market maker quotes prices and manages its own open trades. Your stop triggering does not establish personal targeting. First check the trigger price, available quantity and order conditions.
About the author
Igor Arapov, a practising trader since 2013 and author of the ArapovTrade library. ORCID: 0009-0003-0430-778X.




