In Smart Money Concepts (SMC), a liquidity pool means a suspected cluster of stop orders and entries near a visible price boundary. Traders often look above previous highs and below previous lows. The area tells you where to watch the next reaction; it does not tell you how many orders are waiting or which way price must move.
A move through a level is not enough to choose a trade. The useful sequence is to mark the boundary beforehand, understand which orders might be triggered, and check whether price holds beyond it or returns. The same move can be followed by continuation or failure.
What is a liquidity pool in trading?
Market liquidity is the ability to trade the required quantity without a large deterioration in price. A purchase needs offers to sell, and a sale needs bids to buy. When substantial quantity is available near the current price, a large order can be filled with less impact than in a thin market.
A chart-based liquidity pool is a narrower SMC expression for possible orders around an area. It is different from a DeFi liquidity pool, a reserve of tokens used by a decentralised protocol. Here the subject is price boundaries and order activation, not depositing tokens in a protocol.
A normal price chart records prices but does not list all stops waiting to be triggered. An order book shows available displayed orders at a particular venue, not every future purchase and sale. A marked pool is therefore an estimate. The market-microstructure guide explains the difference between displayed orders and completed transactions.
The estimate provides a testable boundary. Did price pass it, return inside and then move away, or stay beyond it and continue? These observations can change the original scenario without a story about a bank secretly controlling the chart.
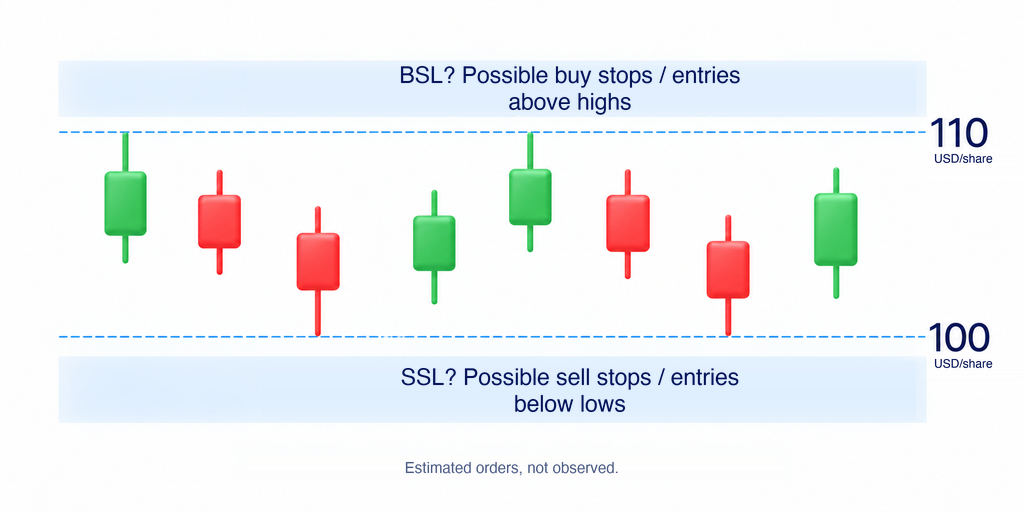
Which orders may be above highs and below lows?
Closing a short position, which was opened to benefit from a fall, requires buying. A protective stop is an instruction intended to close a position when its trigger condition is met. A trader might place a protective buy stop above a previous high. Another participant might place a buy order there to enter an upward breakout. The orders have different purposes but can act in the same direction when triggered.
SMC calls this suspected area buy-side liquidity. It describes possible buying above the high, not a recommendation to buy and not a measured total. Some participants place stops farther away, use another condition or close before the level is reached.
Below a previous low, a buyer may have a protective sell stop. A trader expecting a downward breakout may also plan to open a sale there. This suspected area is called sell-side liquidity. Again, the name concerns the possible direction of activated orders, not the forecast direction after activation.
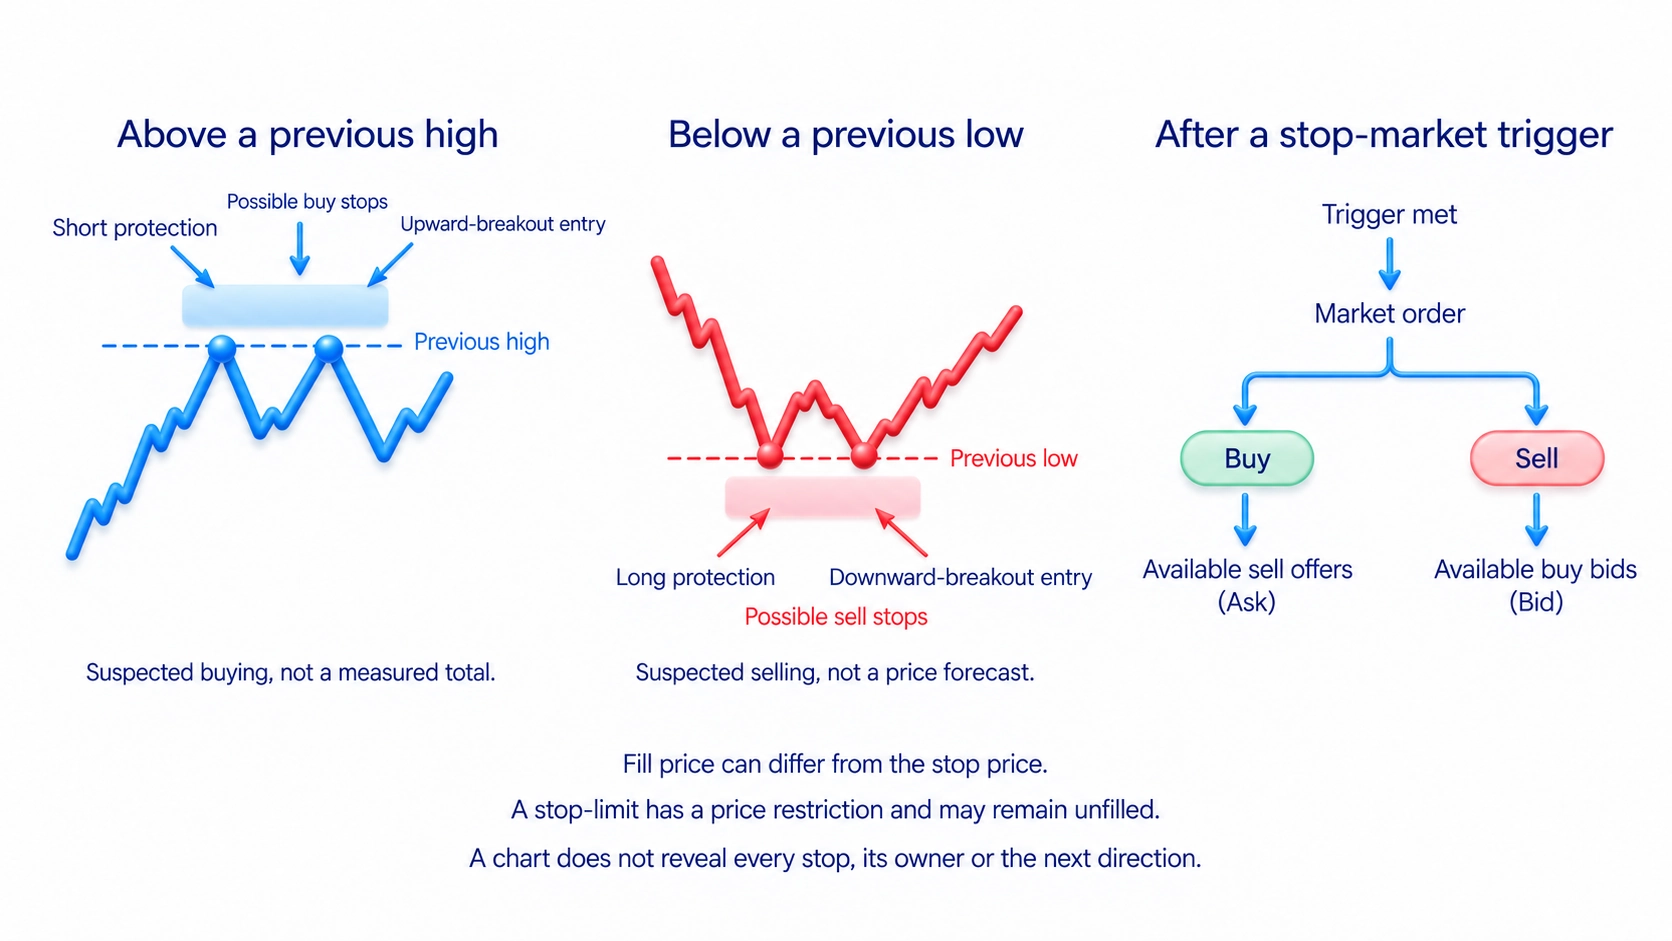
A conventional stop-market order becomes a market order after its trigger. It then takes available opposite orders, and the fill price can differ from the stop price. A stop-limit has a price restriction and may remain unfilled. Check the product and broker's rules; suspected stops do not guarantee a particular traded quantity at one exact price. The order-types guide explains these execution differences.
If incoming purchases take the available offers and keep arriving, execution may move to higher prices. Persistent sales can similarly take bids farther down. Triggered stops can reinforce a breakout rather than reverse it. Carol Osler's currency-market research found evidence of clustered stop orders contributing to rapid price cascades; that result does not make every level crossing deliberate or predictive.
Where to look for liquidity areas
Start with visible turning points: highs and lows after which price previously changed direction. Two nearby tops or bottoms give traders a recognisable boundary. Their presence does not let you count stops, and another touch does not prove that the suspected pool has become larger.
You can also mark the previous day's or week's high and low, the boundary of a clear sideways range, and round prices that coincide with actual reactions. Osler's research at one foreign-exchange dealing bank found clustering around round numbers. That is a reason to investigate them, not evidence that every round price in every market holds a large pool.
Mark a small area around the boundary rather than one imagined line containing everybody's orders. Keep the criterion clear enough to tell whether price has passed it. Widening the area to fit every later move makes the idea impossible to test.
Choose the movement you are studying before drawing its boundaries. A weekly high and a small high inside an hourly move refer to different structures. A session high also depends on the session times and chart settings. The support-and-resistance guide explains how to select a meaningful price area.
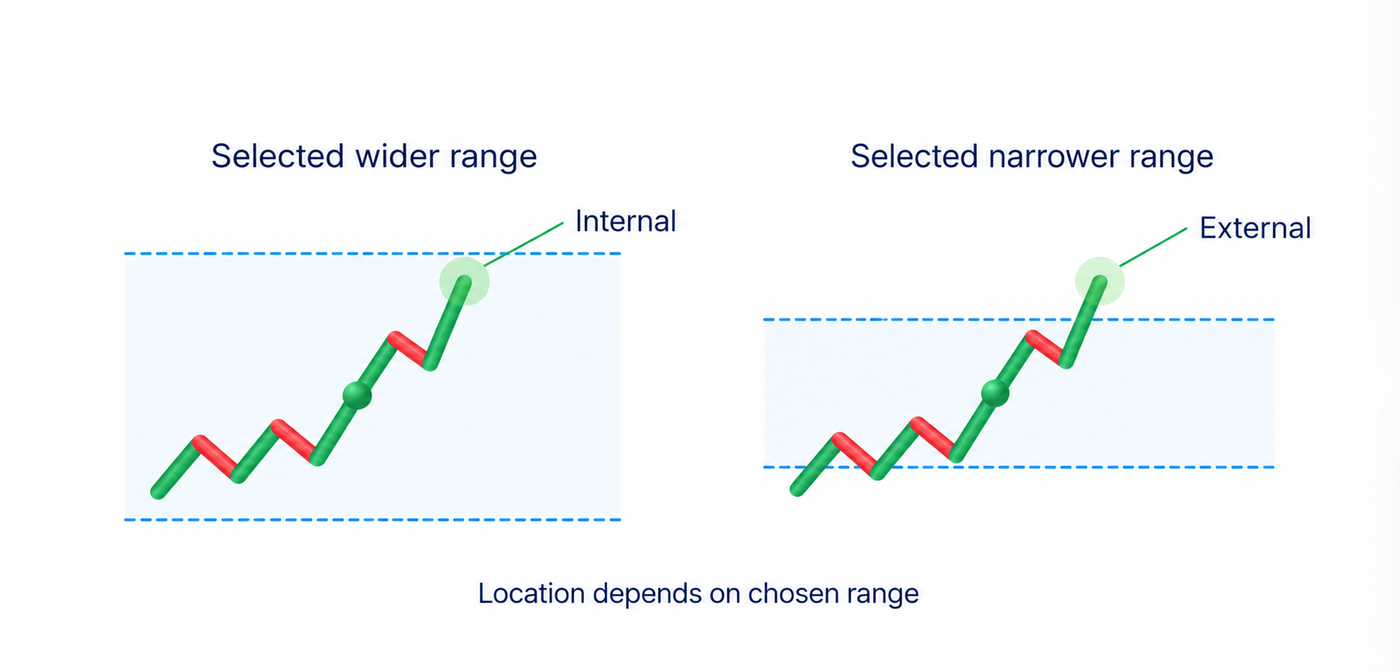
External liquidity means suspected orders beyond the outer highs or lows of the selected range. Internal liquidity means possible orders near smaller structures inside it. The classification changes when you choose a different range; it describes location relative to that range, not a permanent property of a price.
A rapidly crossed or blank-looking chart area is not automatically a pool of stops. Explain why orders might be placed beyond the particular high or low. Without that reasoning, a pool label merely renames an area after price has already moved through it.
What is a liquidity sweep?
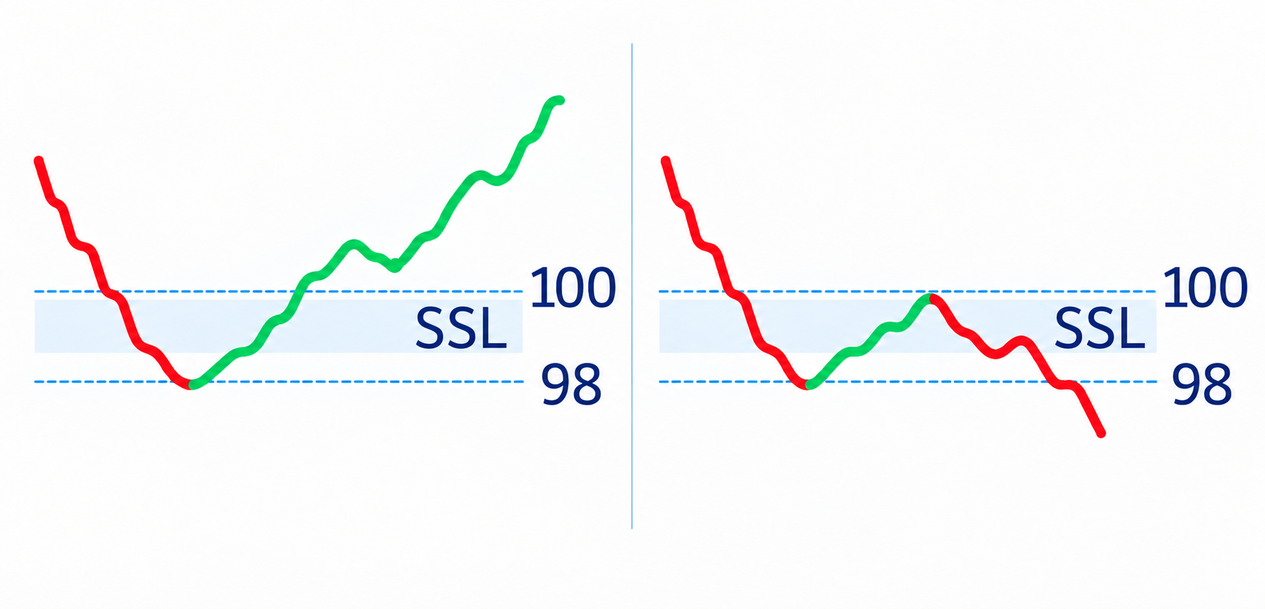
A liquidity sweep describes price passing a visible high or low where orders might be triggered. Traders also use liquidity grab or stop run for related observations, though their terminology varies. Stop hunting adds an interpretation about deliberate targeting. The chart alone does not establish the number of triggered stops or the intention behind the move.
Watch what follows. Price may return inside the old boundary and fail to make further progress in the breakout direction. Alternatively, it may hold beyond the area and resume the same direction after a pullback, a temporary move against the latest advance or decline. Calling the initial move a sweep does not decide between these outcomes.
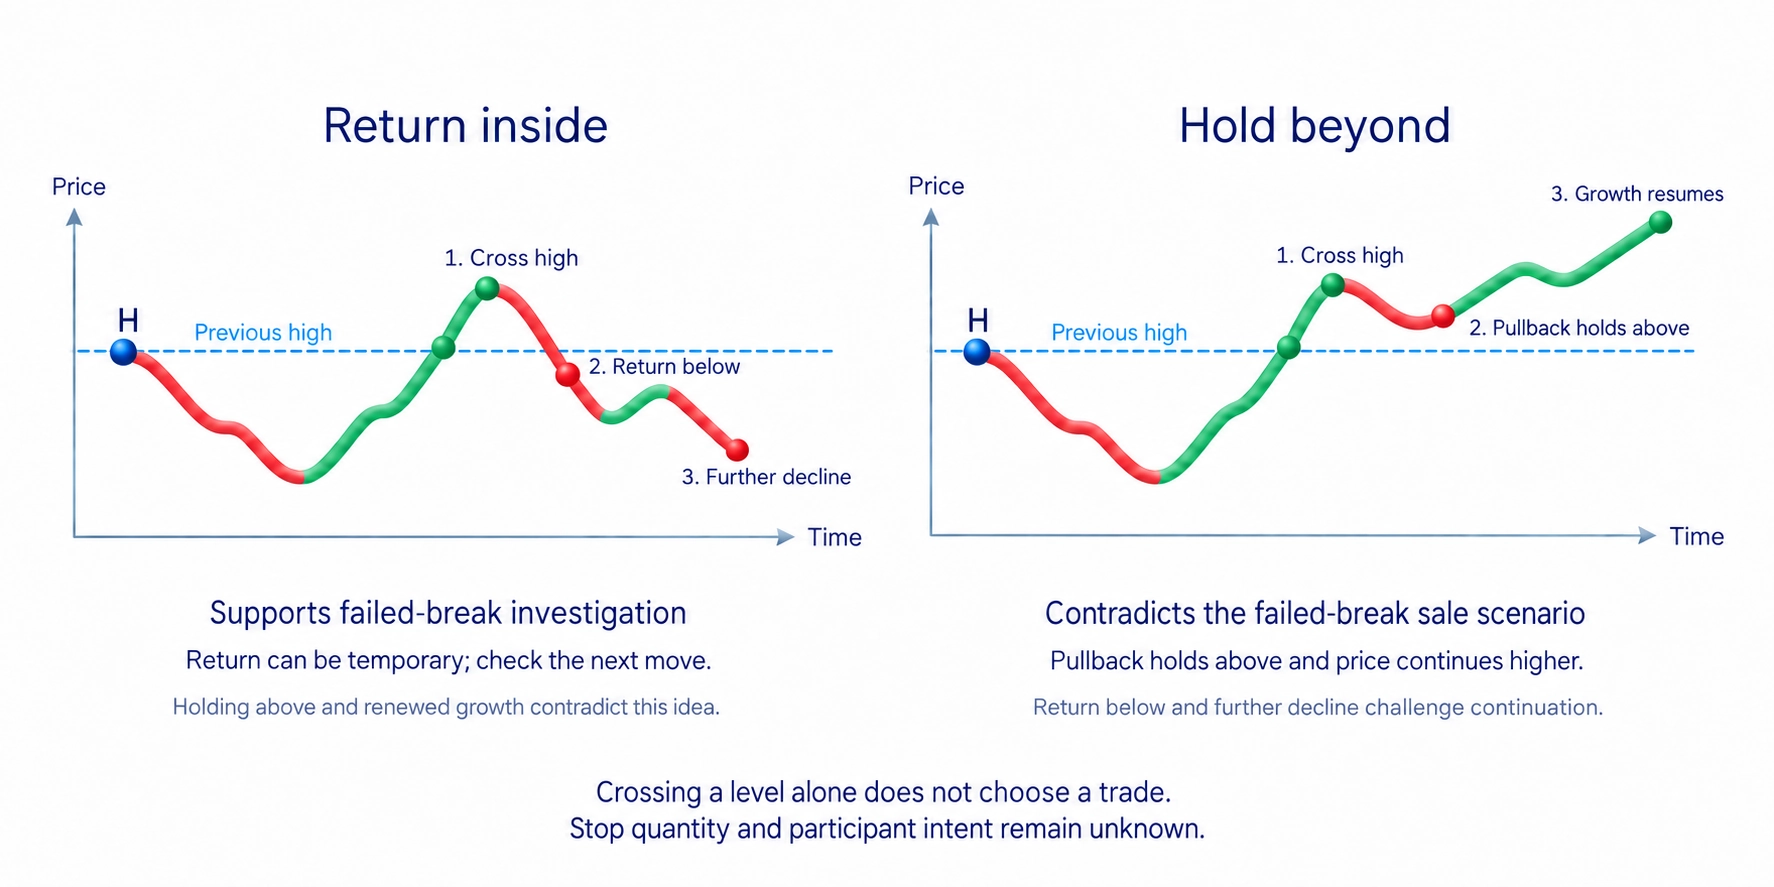
A return inside can itself be temporary. Check the subsequent movement and define what would contradict the failed-break idea. The false-breakout guide explains how to test that return. A boundary touch alone does not mean that a valid breakout has failed.
In my interpretation, large positions need counterparties, meaning participants willing to take the other side of a transaction. An obvious boundary can be a place to investigate additional trading activity. That helps explain my interest in the area; it does not turn every excursion into a known fund purchase or an inevitable reversal.
How to check the reaction
Compare progress before and after the boundary. An upward exit followed by narrower advances, a return below the area and a further decline supports investigation of a failed upward breakout. Holding above the area and resuming growth instead contradicts that particular sale scenario.
Trading volume records the quantity exchanged during a period, such as shares or futures contracts. An increase near a level shows activity. It does not tell you who opened a position, who closed one or which participant will determine the next movement.
Compare that activity with price progress and the next reaction. Heavy trading with little progress differs from heavy trading during a sustained breakout. An absent spike does not prove that no stops were triggered: the instrument, venue and data source matter. The volume-analysis guide explains those comparisons and limitations.
In the course's working-with-levels example, I examine the illustrated Euro futures chart. An active rising bar, which records one period of trading, is followed by narrower rising bars and then a strong decline through local support areas. The decision depends on the sequence. The initial upward move is a place to watch, not a sufficient reason to sell.
My video on price areas and counterparties gives an optional practical explanation. Its interpretation of position-building still needs to be checked against the chart. For a suspected stop area, the written task remains the same: observe activity and whether price can keep moving beyond the chosen boundary.
Example: a move below a low and return
Consider a hypothetical stock priced in US dollars. It has repeatedly stopped near 100 and advanced towards 110. Below 100, we suspect buyers' protective sell stops and downward-breakout entries. The boundary is observable; the quantity and owners of those orders are unknown.
Price reaches 98 and then returns above 100. That return alone is not the complete buying condition. On the next pullback, price stops at 100.50, stays above 98 and begins rising again. This adds evidence that the old area is holding, compared with buying immediately from the first return.
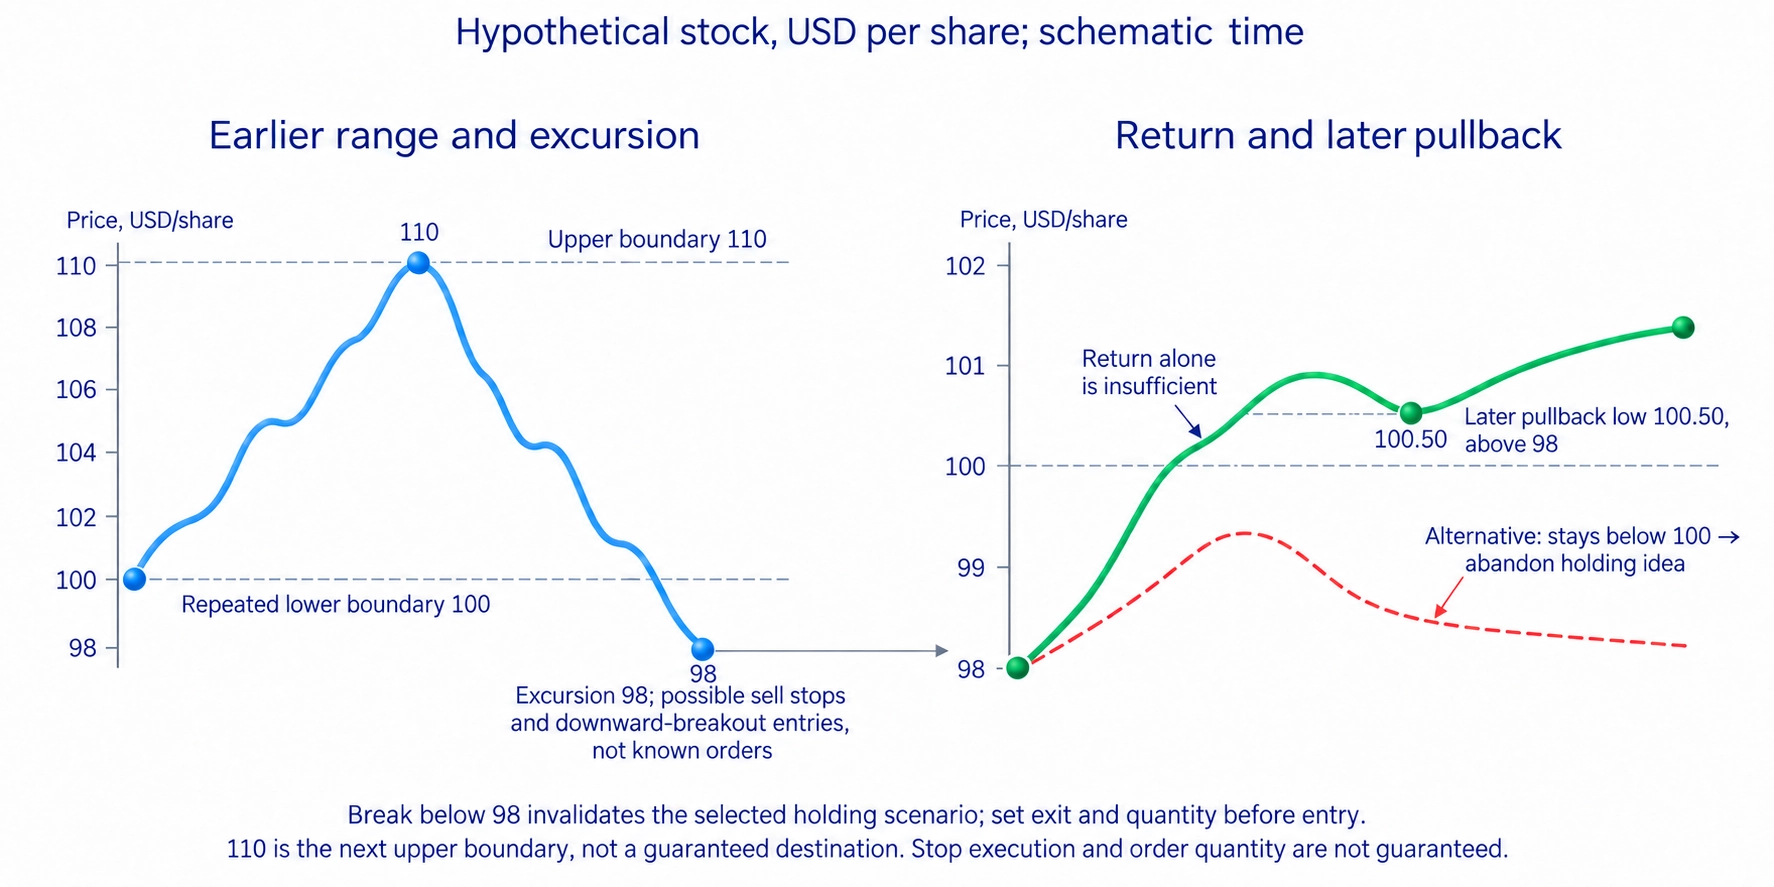
Choose the cancellation condition before entering. A system might reject this holding scenario if price breaks the low at 98. The planned exit should match that condition, and the position size should fit the allowed loss at the distance from the actual entry. The eventual stop fill is not guaranteed. The risk-management guide explains the sizing calculation.
The area near 110 is the next visible upper boundary, not a destination the market must reach. Compare the remaining room towards it with the distance to the planned exit if the idea fails. If entry is already close to 110, the opportunity may be too small for that loss distance. Skip the trade rather than assume the boundary will be reached or raise the loss budget.
The alternative belongs to the same example. Price reaches 98 but stays below 100; an attempted return ends in another decline. That does not confirm buying after a supposed stop collection. Abandon the holding scenario instead of describing every further fall as one more sweep before the promised rise.
How to avoid liquidity-analysis mistakes
Before a trade, name the boundary, the possible order direction and the reaction you actually observed. “Price passed the low, returned and then held the area” is a chart observation. “A large fund bought and now must lift the market” adds information you do not have.
Do not keep moving the stop farther away after new excursions. A breach of the preselected condition changes the reason for the trade. Removing the order keeps the position open but does not restore that reason. If the required exit distance is too large before entry, reduce the quantity or skip the trade.
For practice, save the chart before price passes the level and write the possible outcomes. Then record whether price held outside, returned inside or resumed movement after a pullback. Include failed ideas. This makes it harder to call every finished chart a successful liquidity sweep after seeing the result.
Frequently asked questions
It is a suspected cluster of stop orders and entries around a visible boundary, often above a high or below a low. A normal chart does not show all those orders directly. It is different from a DeFi pool of tokens.
It describes price moving through an area where orders might be triggered. Check the return or continuation afterwards. The excursion alone does not prove a reversal, the quantity triggered or a participant's intention.
Look beyond recognisable highs and lows, selected range boundaries and day or week extremes. Round prices can also be investigated when they fit the price context. These areas identify places to watch, not a known stop count.
No. In my approach, the subsequent reaction matters: the return, whether the boundary holds and where movement resumes. Define the condition that would invalidate the trade, the exit and the trade quantity before entering.
External liquidity is beyond the outer boundaries of the selected range. Internal liquidity is associated with smaller highs or lows inside it. Changing the range can change the classification of the same price.
About the author
Igor Arapov, practising trader since 2013 and author of the ArapovTrade library. ORCID: 0009-0003-0430-778X.




