A breakout is a move beyond a price area that previously stopped a rise or fall. Crossing that boundary is an observation, not proof that a new trend has begun. Price can move back into the old range and leave a trader who entered on the breakout with a loss.
Before considering a trade, mark the area, decide what counts as a breakout and state what would cancel the setup. That gives you a way to assess the next move without rewriting the rules after seeing the outcome.
What counts as a breakout?
Support is an area where a decline previously stopped; resistance is an area where a rise previously stopped. Nearby turning points often occur at slightly different prices, so a zone can describe the chart better than one exact line. The chart-reading guide explains how to mark these areas.
A move above resistance is an upward breakout. A move below support is a downward breakout. A candle's wick extending beyond the zone and a candle closing beyond it are different observations. The wick records a price reached during that period; the close records where the period ended.
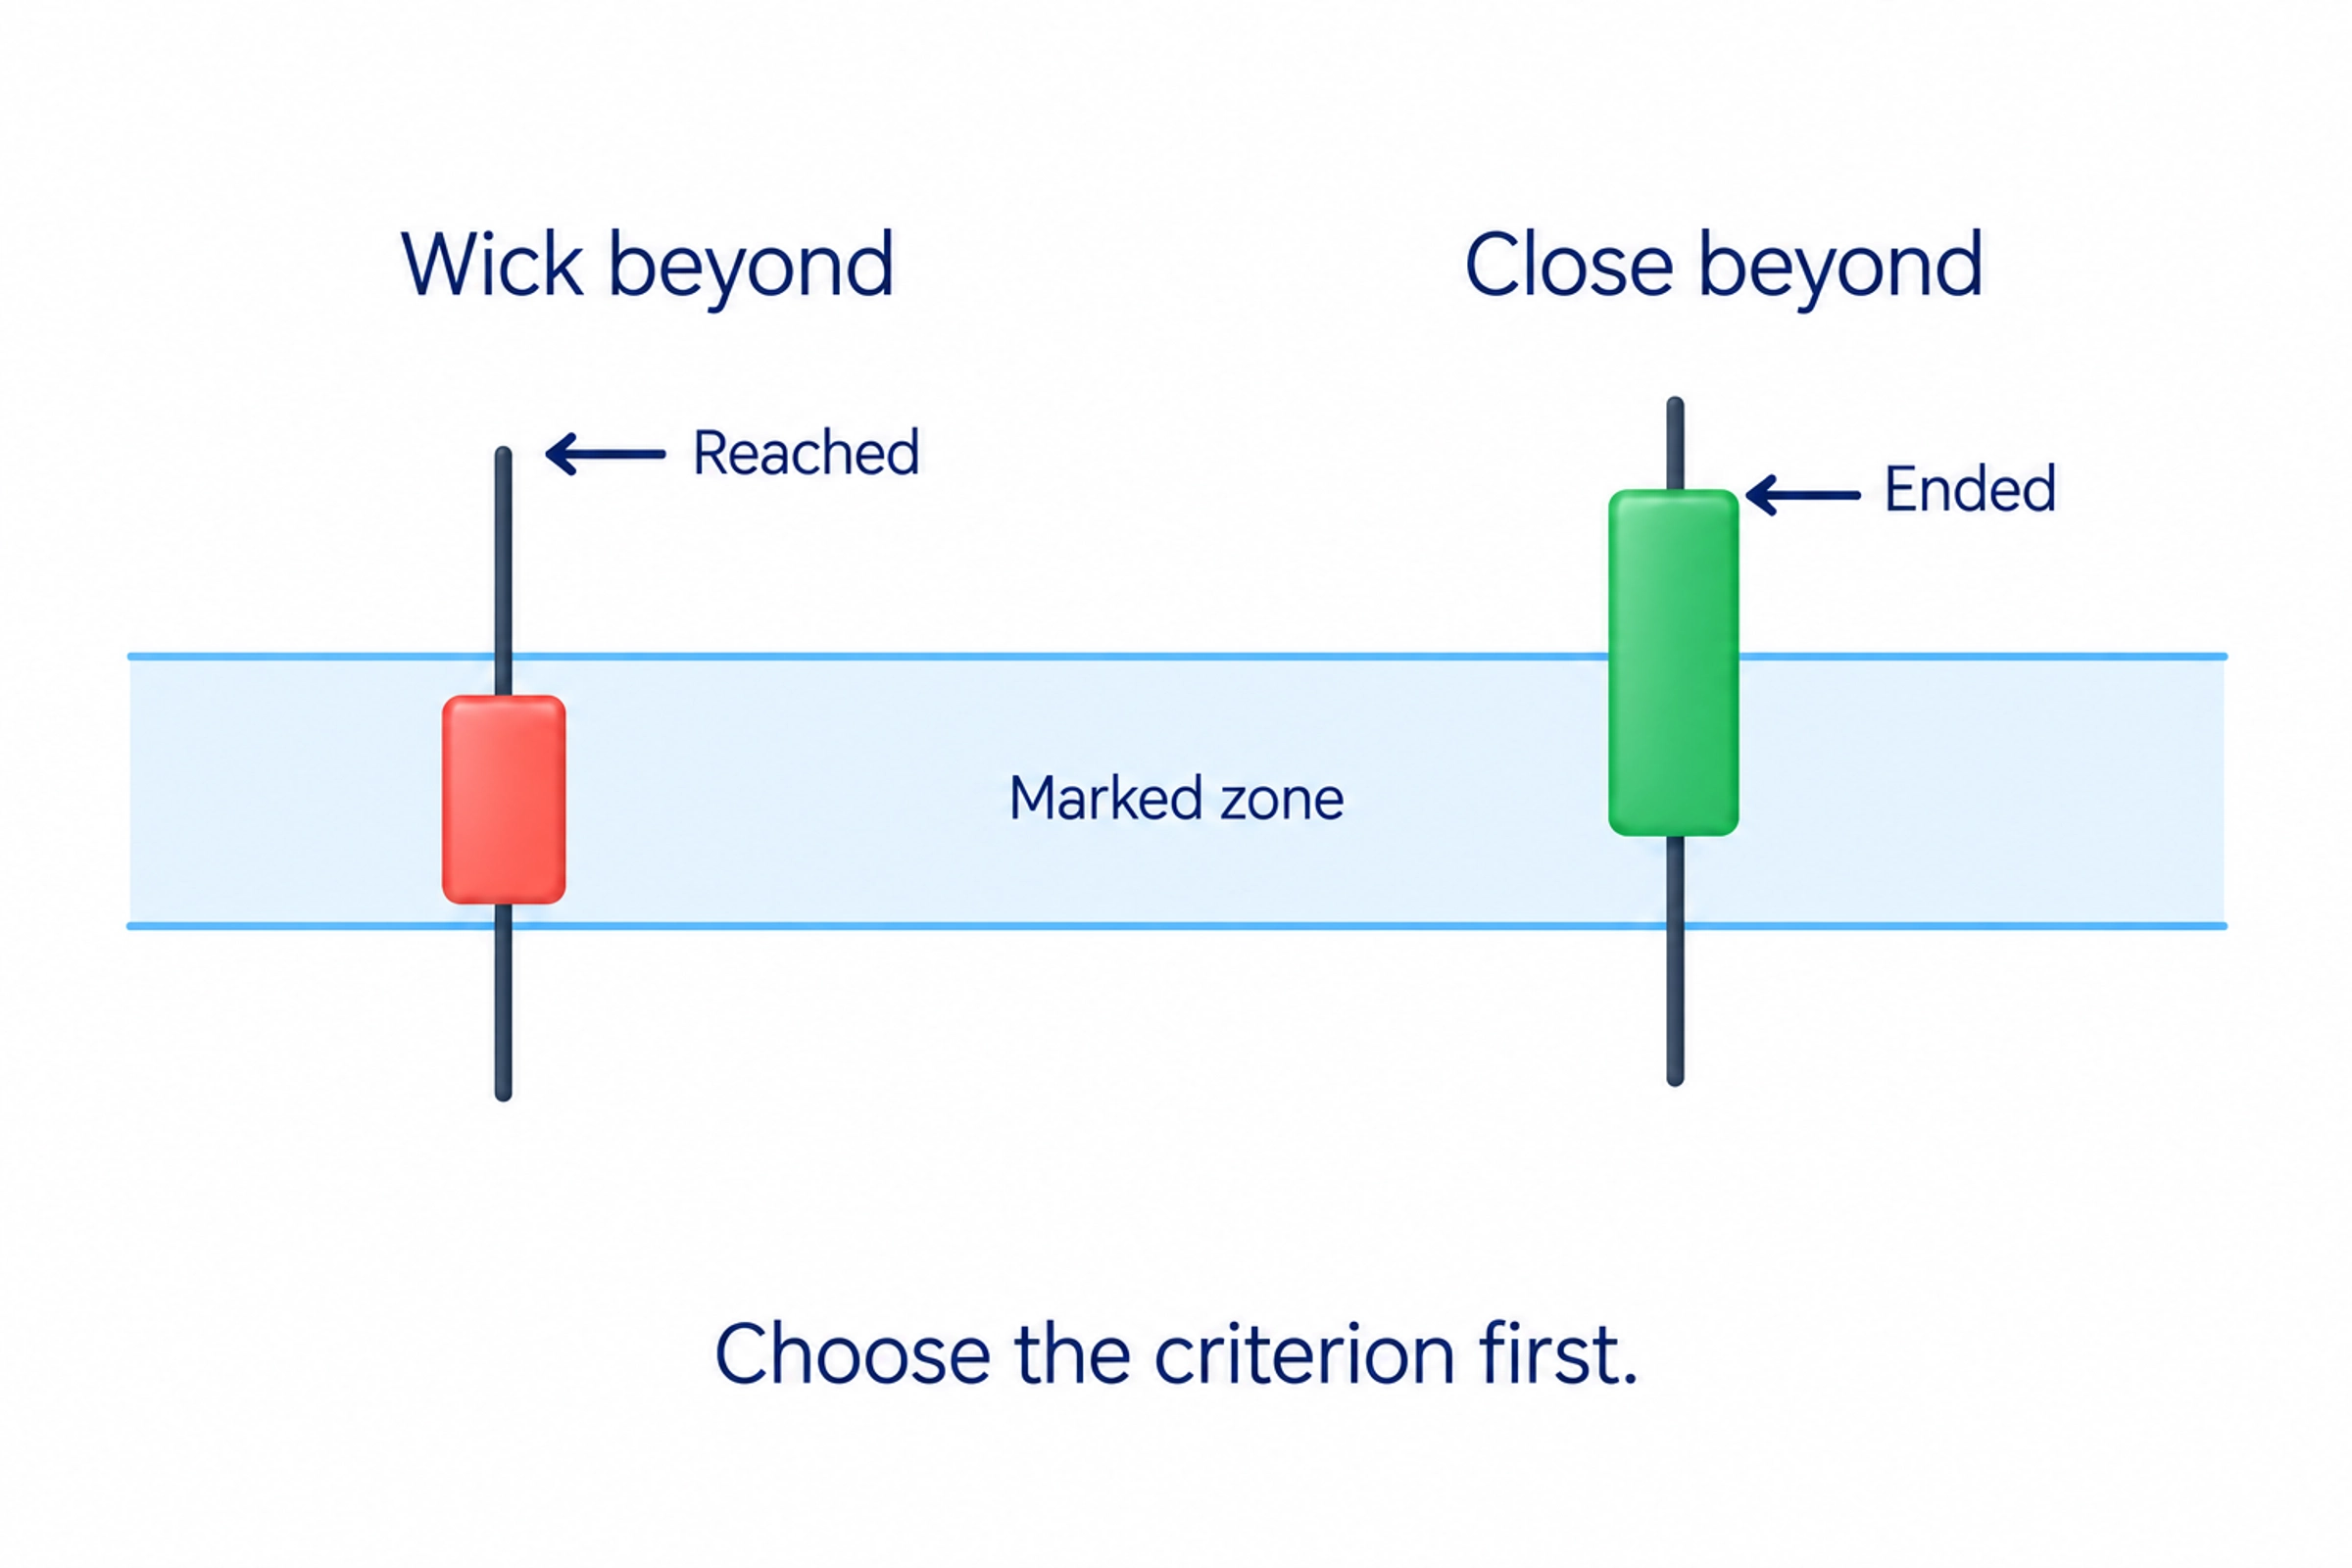
Choose your criterion before price reaches the boundary. For example, a practice rule might require an hourly candle to close beyond the zone. That rule does not establish an advantage or promise a profit. It simply makes the observation consistent from one case to the next.
Do not keep shifting the boundary to make every failed exit look acceptable. If the old marking no longer describes the market, record why you changed it and begin a new setup. Otherwise, you cannot tell whether your original rule worked.
Continuation or a false breakout?
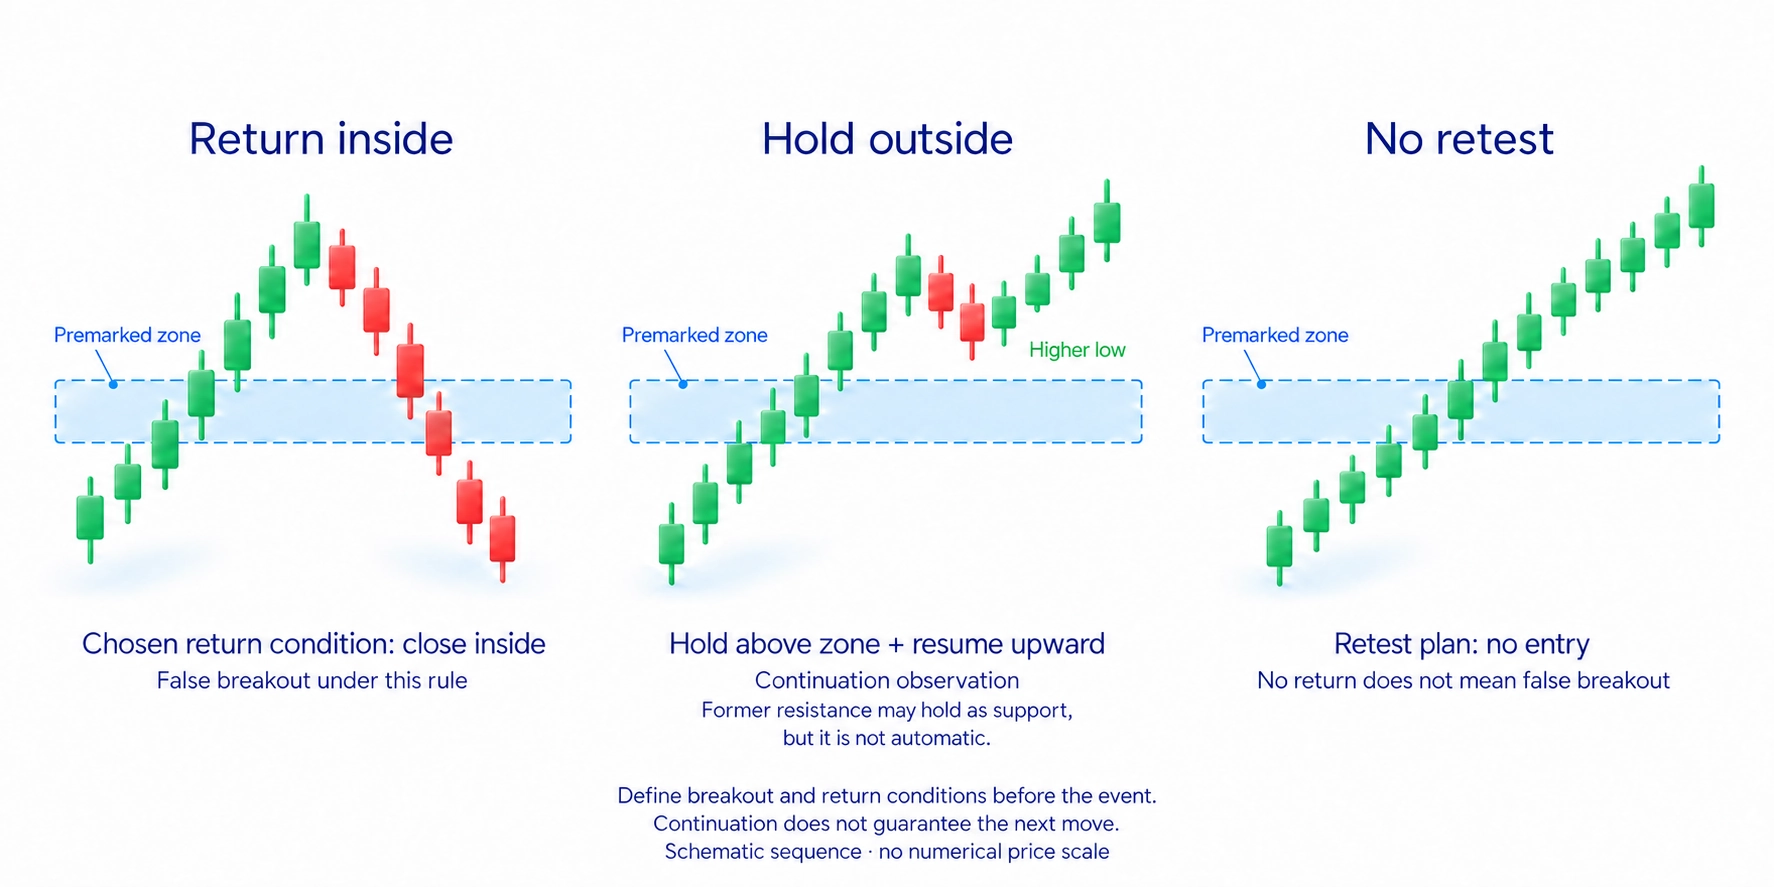
A false breakout occurs when price moves beyond a boundary and then returns inside the earlier area or range. Define which return your rule uses: a brief move back inside the area, a close inside it, or further movement against the breakout. Without that condition, the label can become an explanation added after the event.
For an upward breakout, watch whether price holds above the zone, makes a higher low and then moves up again. For a downward breakout, watch whether price stays below the zone and resumes its decline. These observations help assess continuation; they do not prevent a later reversal.
Trading volume measures the quantity traded during a period, such as shares or contracts. Compare activity during the exit with activity during the return. High volume can accompany a continuing move or a failed breakout, so higher volume alone does not distinguish the two.
Read volume alongside the distance price travels and its next reaction. Heavy trading with little further progress differs from a strong exit followed by a hold outside the old area. Use a consistent data source when making that comparison; the volume-analysis material explains what the available data can and cannot show.
Price sometimes moves away without a convenient return, particularly around unexpected news. That does not make the breakout false. If your plan requires a return to the level, the missing return means there is no entry under that plan. It does not require you to chase the move.
Why stops can trigger near a level
Above resistance, there may be orders to buy on a breakout and protective buy stops for short positions. A short position is a trade that benefits from a fall in price; closing it requires buying. When those orders activate, the additional buying can contribute to an upward move. Below support, triggered sell orders can contribute to a downward move.
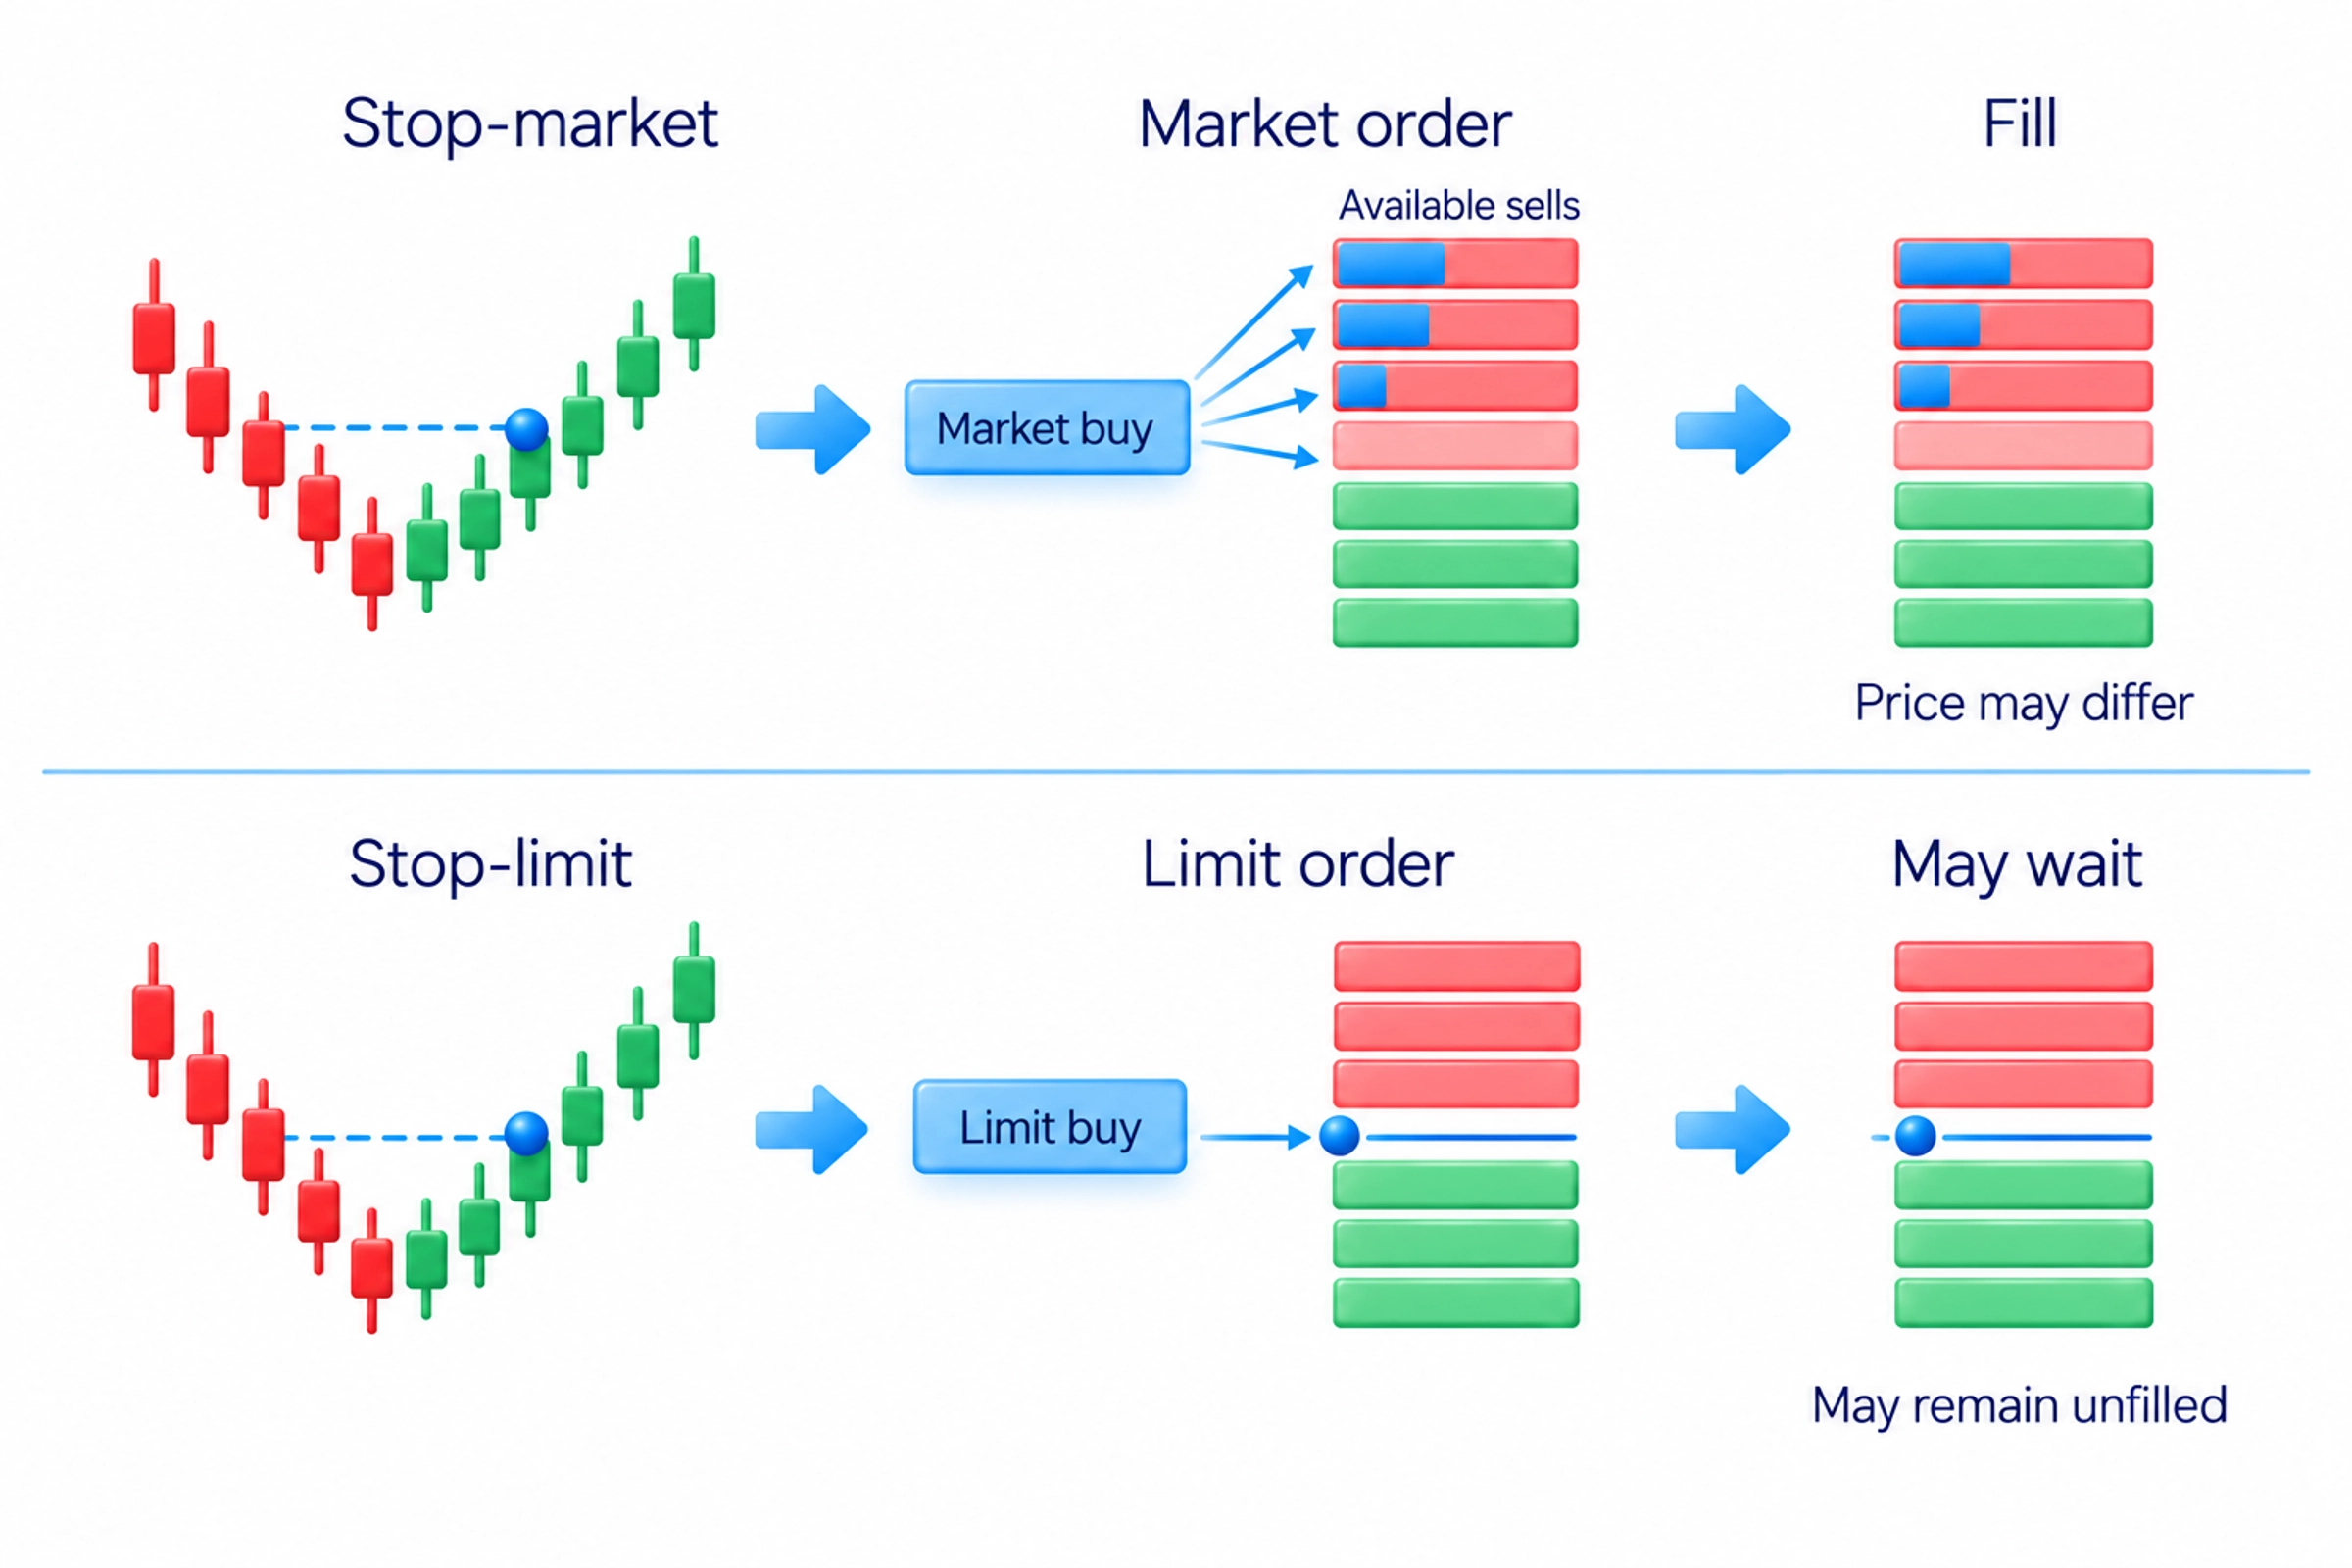
A stop-market order becomes a market order when its trigger condition is met. It trades against available orders on the other side, and the fill price can differ from the trigger price. A stop-limit order instead activates a limit order and may remain unfilled. The order-types guide explains these execution differences.
If opposing orders absorb the new buying or selling and no further flow sustains the move, price can return through the level. A chart does not show who placed every order or why. Available liquidity, changing orders and new decisions can all affect the outcome; a brief move beyond a boundary is not proof of a planned stop hunt.
In my interpretation of a failed upward breakout, I consider whether opposing sellers used the burst of buying near the boundary. The decision rests on the subsequent loss of upward progress and return, rather than knowing a participant's identity. The video on false breakouts shows this interpretation; the written explanation here remains sufficient without watching it.
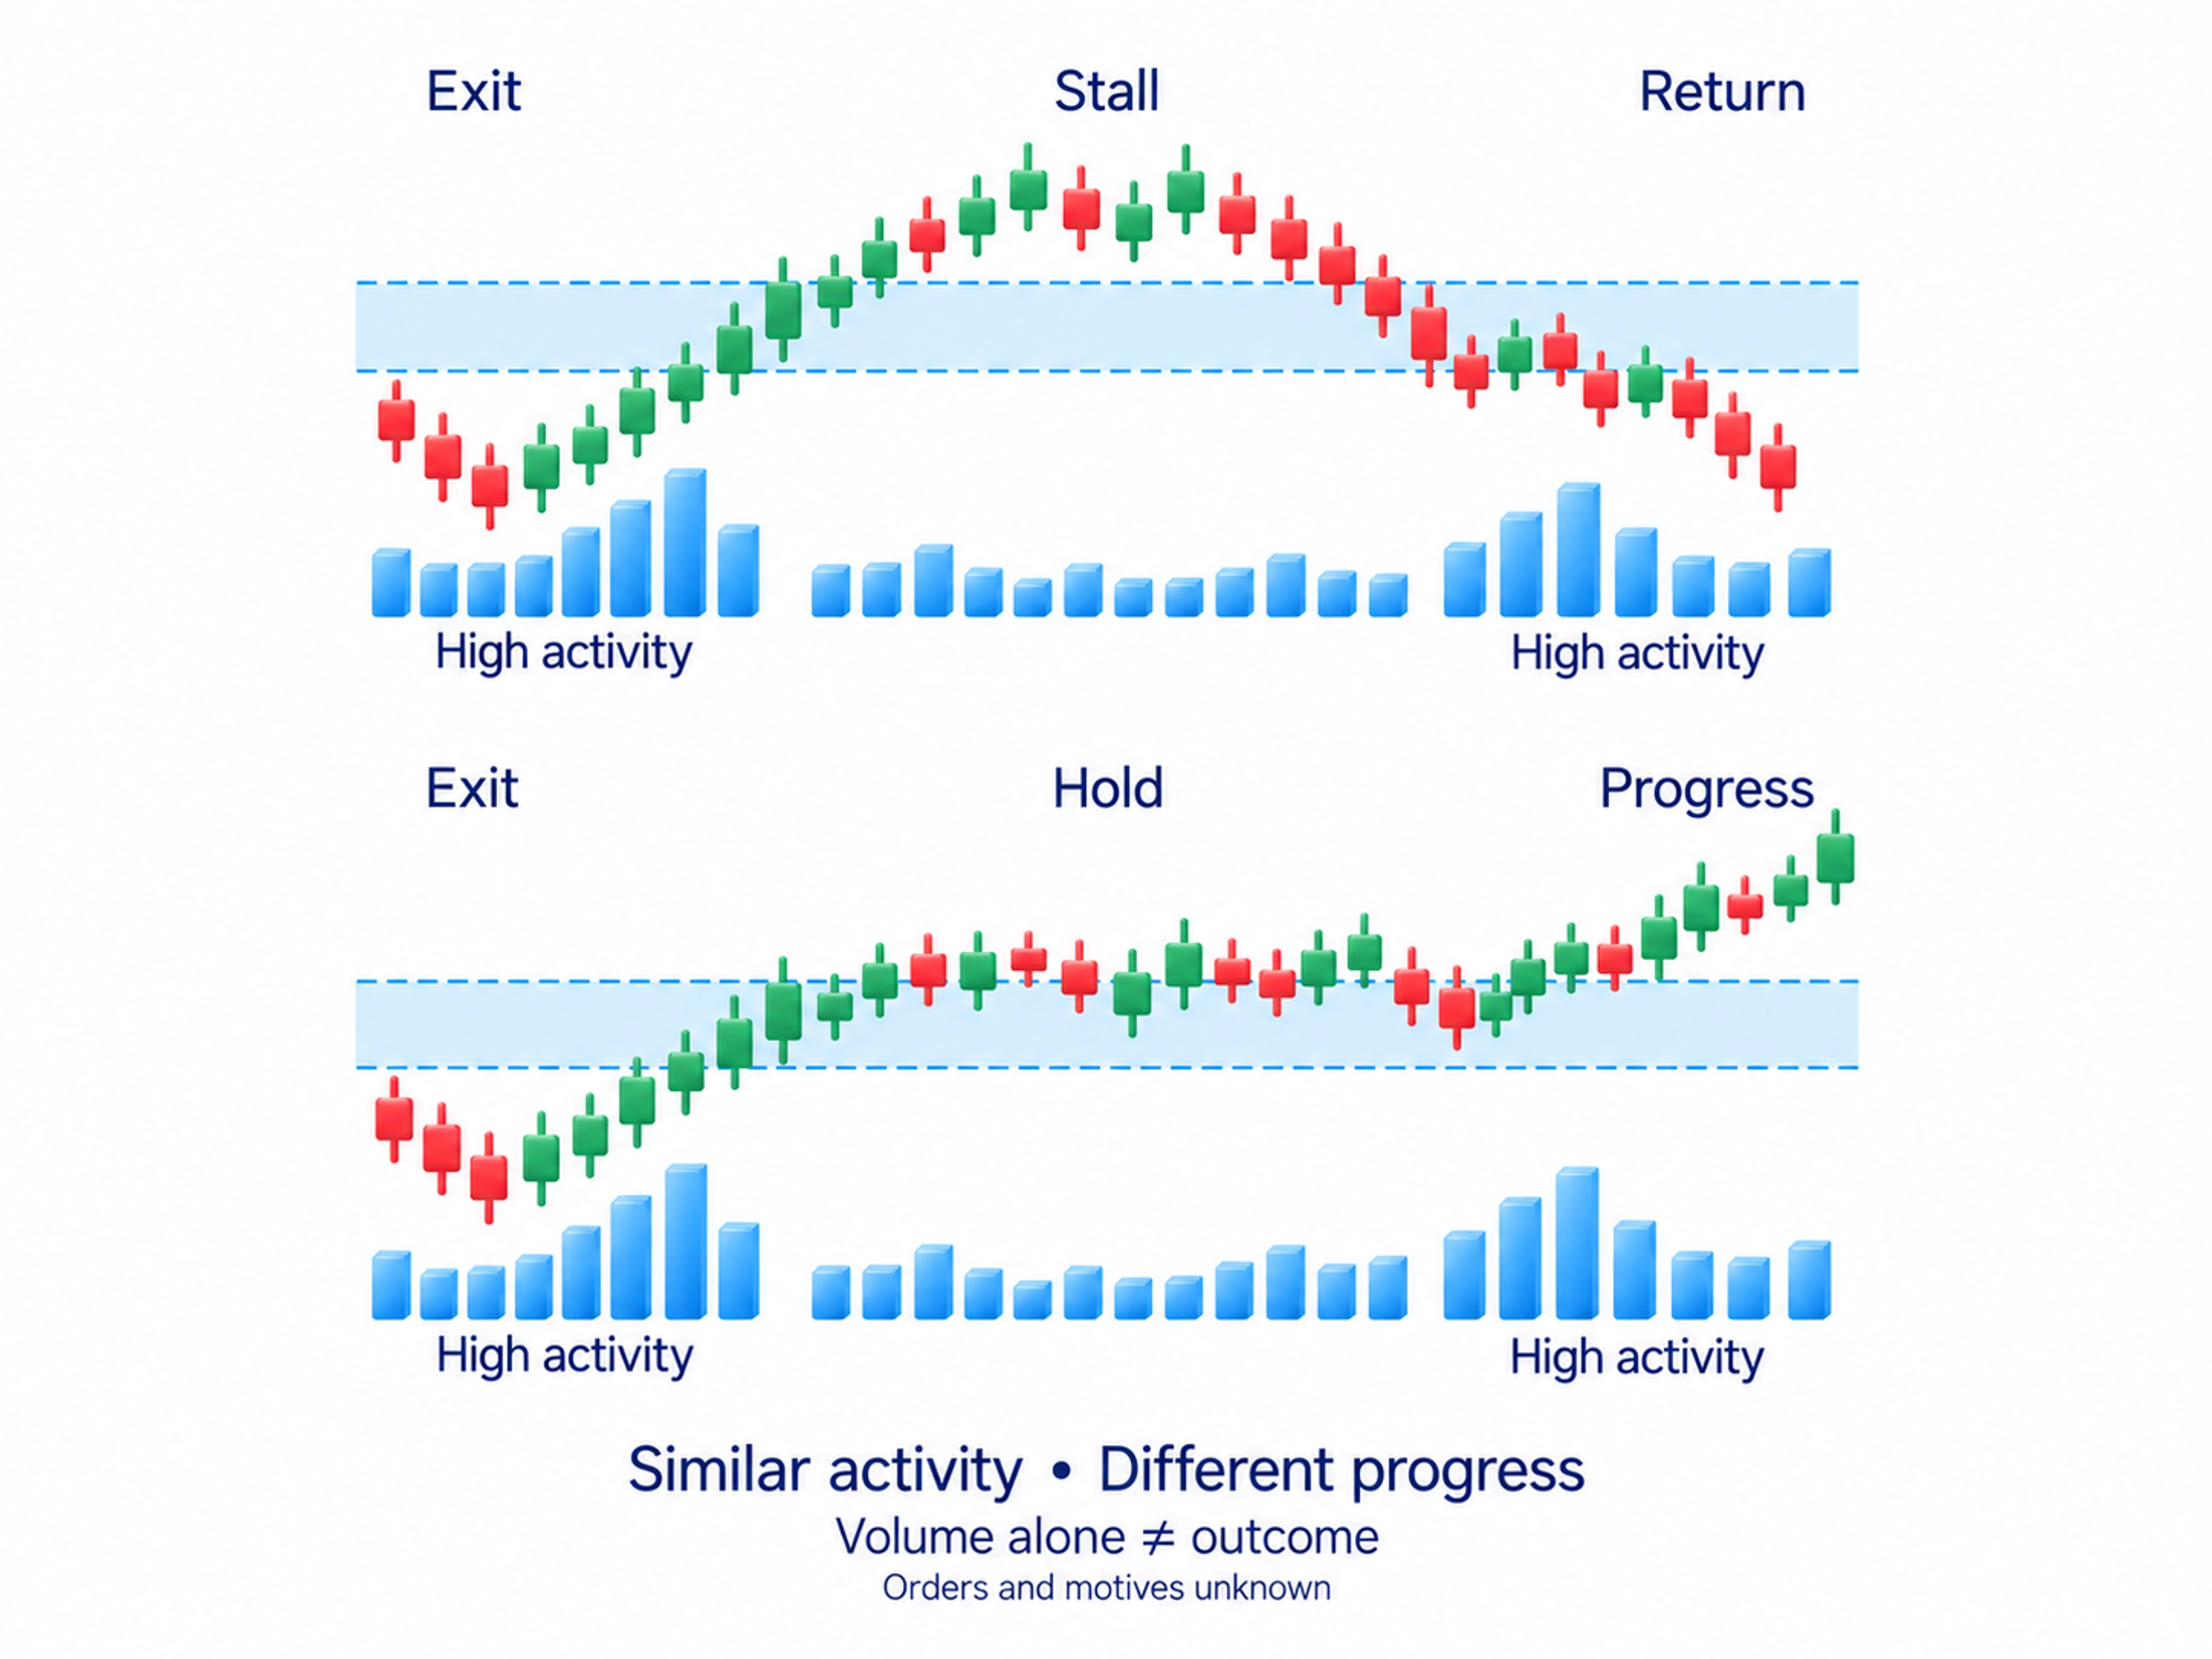
The diagram illustrates an exit and return. It is a schematic sequence, not a record of every order behind a historical move. It cannot establish that all false breakouts have the same cause or organiser.
How to use a retest for entry
A retest is a return to a level after price has broken through it. Former resistance may hold a pullback as support; former support may stop a rebound as resistance. Check the reaction to see whether the zone has changed its role. That change does not follow automatically from the first candle outside it.
Entering on the exit and entering after a retest are different plans. The first accepts the risk of a quick return. The second waits for more evidence but can miss a move that never pulls back. Do not combine the successful cases from both and treat them as the results of one fixed rule.
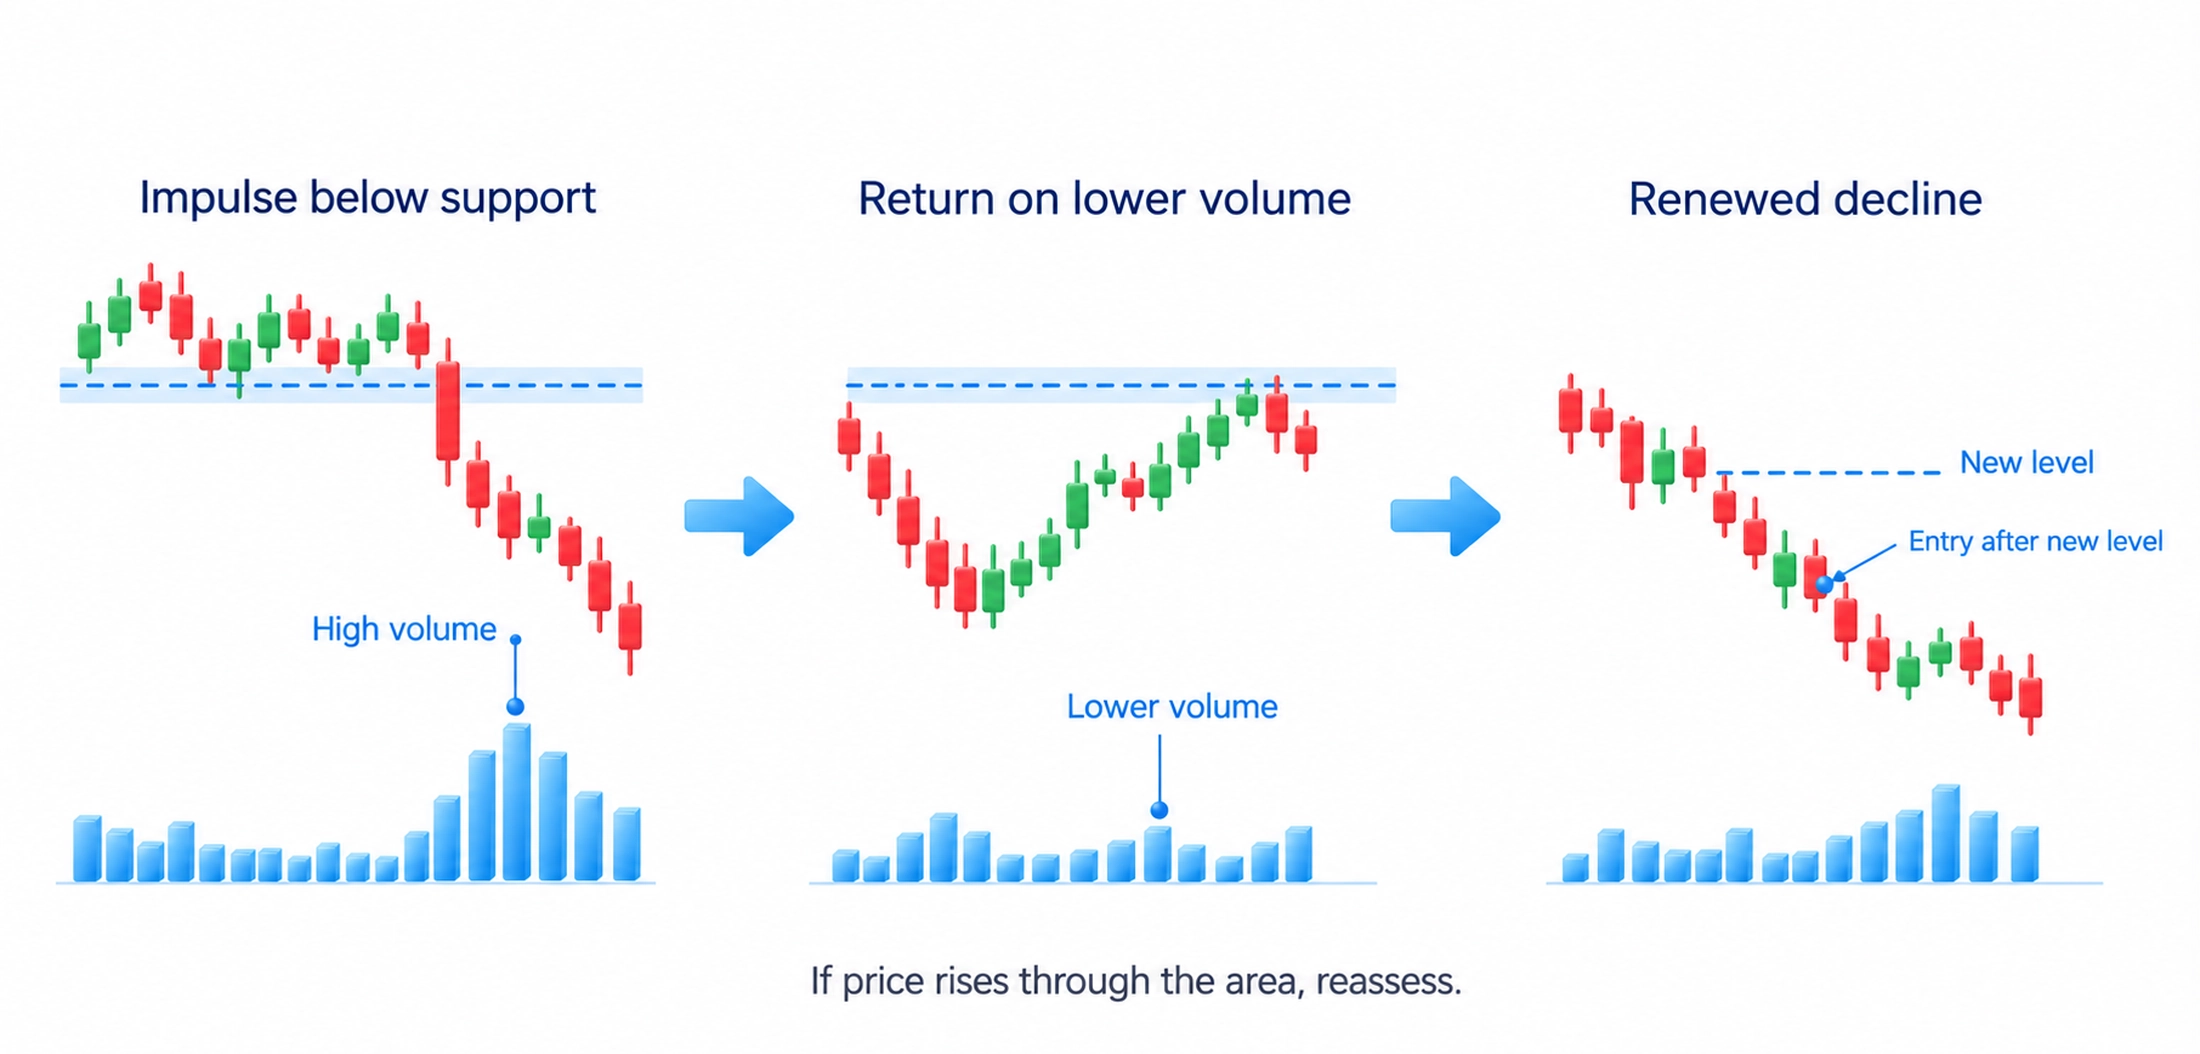
In the course's entry example, I examine a downward move in gold. An impulse with high volume is followed by a return towards the consolidation area, where price had traded within a relatively confined range, on lower volume, then renewed decline. The trade decision uses the sequence, not just the first candle below support.
In that example, the entry comes after a new level from which the decline resumes. If price instead rises through the area, the expected continuation needs reassessment. Waiting for the return is part of my approach; the market is not obliged to provide that return after every breakout.
A long-wicked candle near the zone can help describe its reaction, but the shape does not replace the setup. A pin bar in an arbitrary location is not the same observation as a rejection of a boundary marked in advance. The candlestick-patterns guide explains how to read that shape and its context.
Where to place the stop and target
In my demonstration of a failed downward break, I use its low as the reference for a protective stop on a purchase after the return. A renewed move below that extreme would contradict the expected upward reaction. For other breakout setups, choose the planned exit where that particular idea fails, such as below a holding reaction low for a purchase or above the high of a failed upward breakout for a sale. Set the boundary before entry rather than choosing an arbitrary stop distance.
Do not move the stop closer merely to produce an attractive reward-to-risk ratio. If an ordinary movement inside the area you are testing triggers it, the stop may not match the setup. Moving it farther away after entry creates the opposite problem: the possible loss exceeds the one you planned.
Consider a hypothetical share purchase after a retest. Entry is USD 102, the protective stop is USD 99 and the chosen target area is USD 111. The planned stop distance is USD 3 per share; the target distance is USD 9. Planned reward divided by risk is 9 ÷ 3 = 3, or 3:1.
That calculation says nothing about the probability of reaching USD 111. Fees and actual execution prices change the monetary outcome, while an intervening price area may stop the move sooner. Choose the position size to fit your loss budget; the risk-management guide explains that calculation.
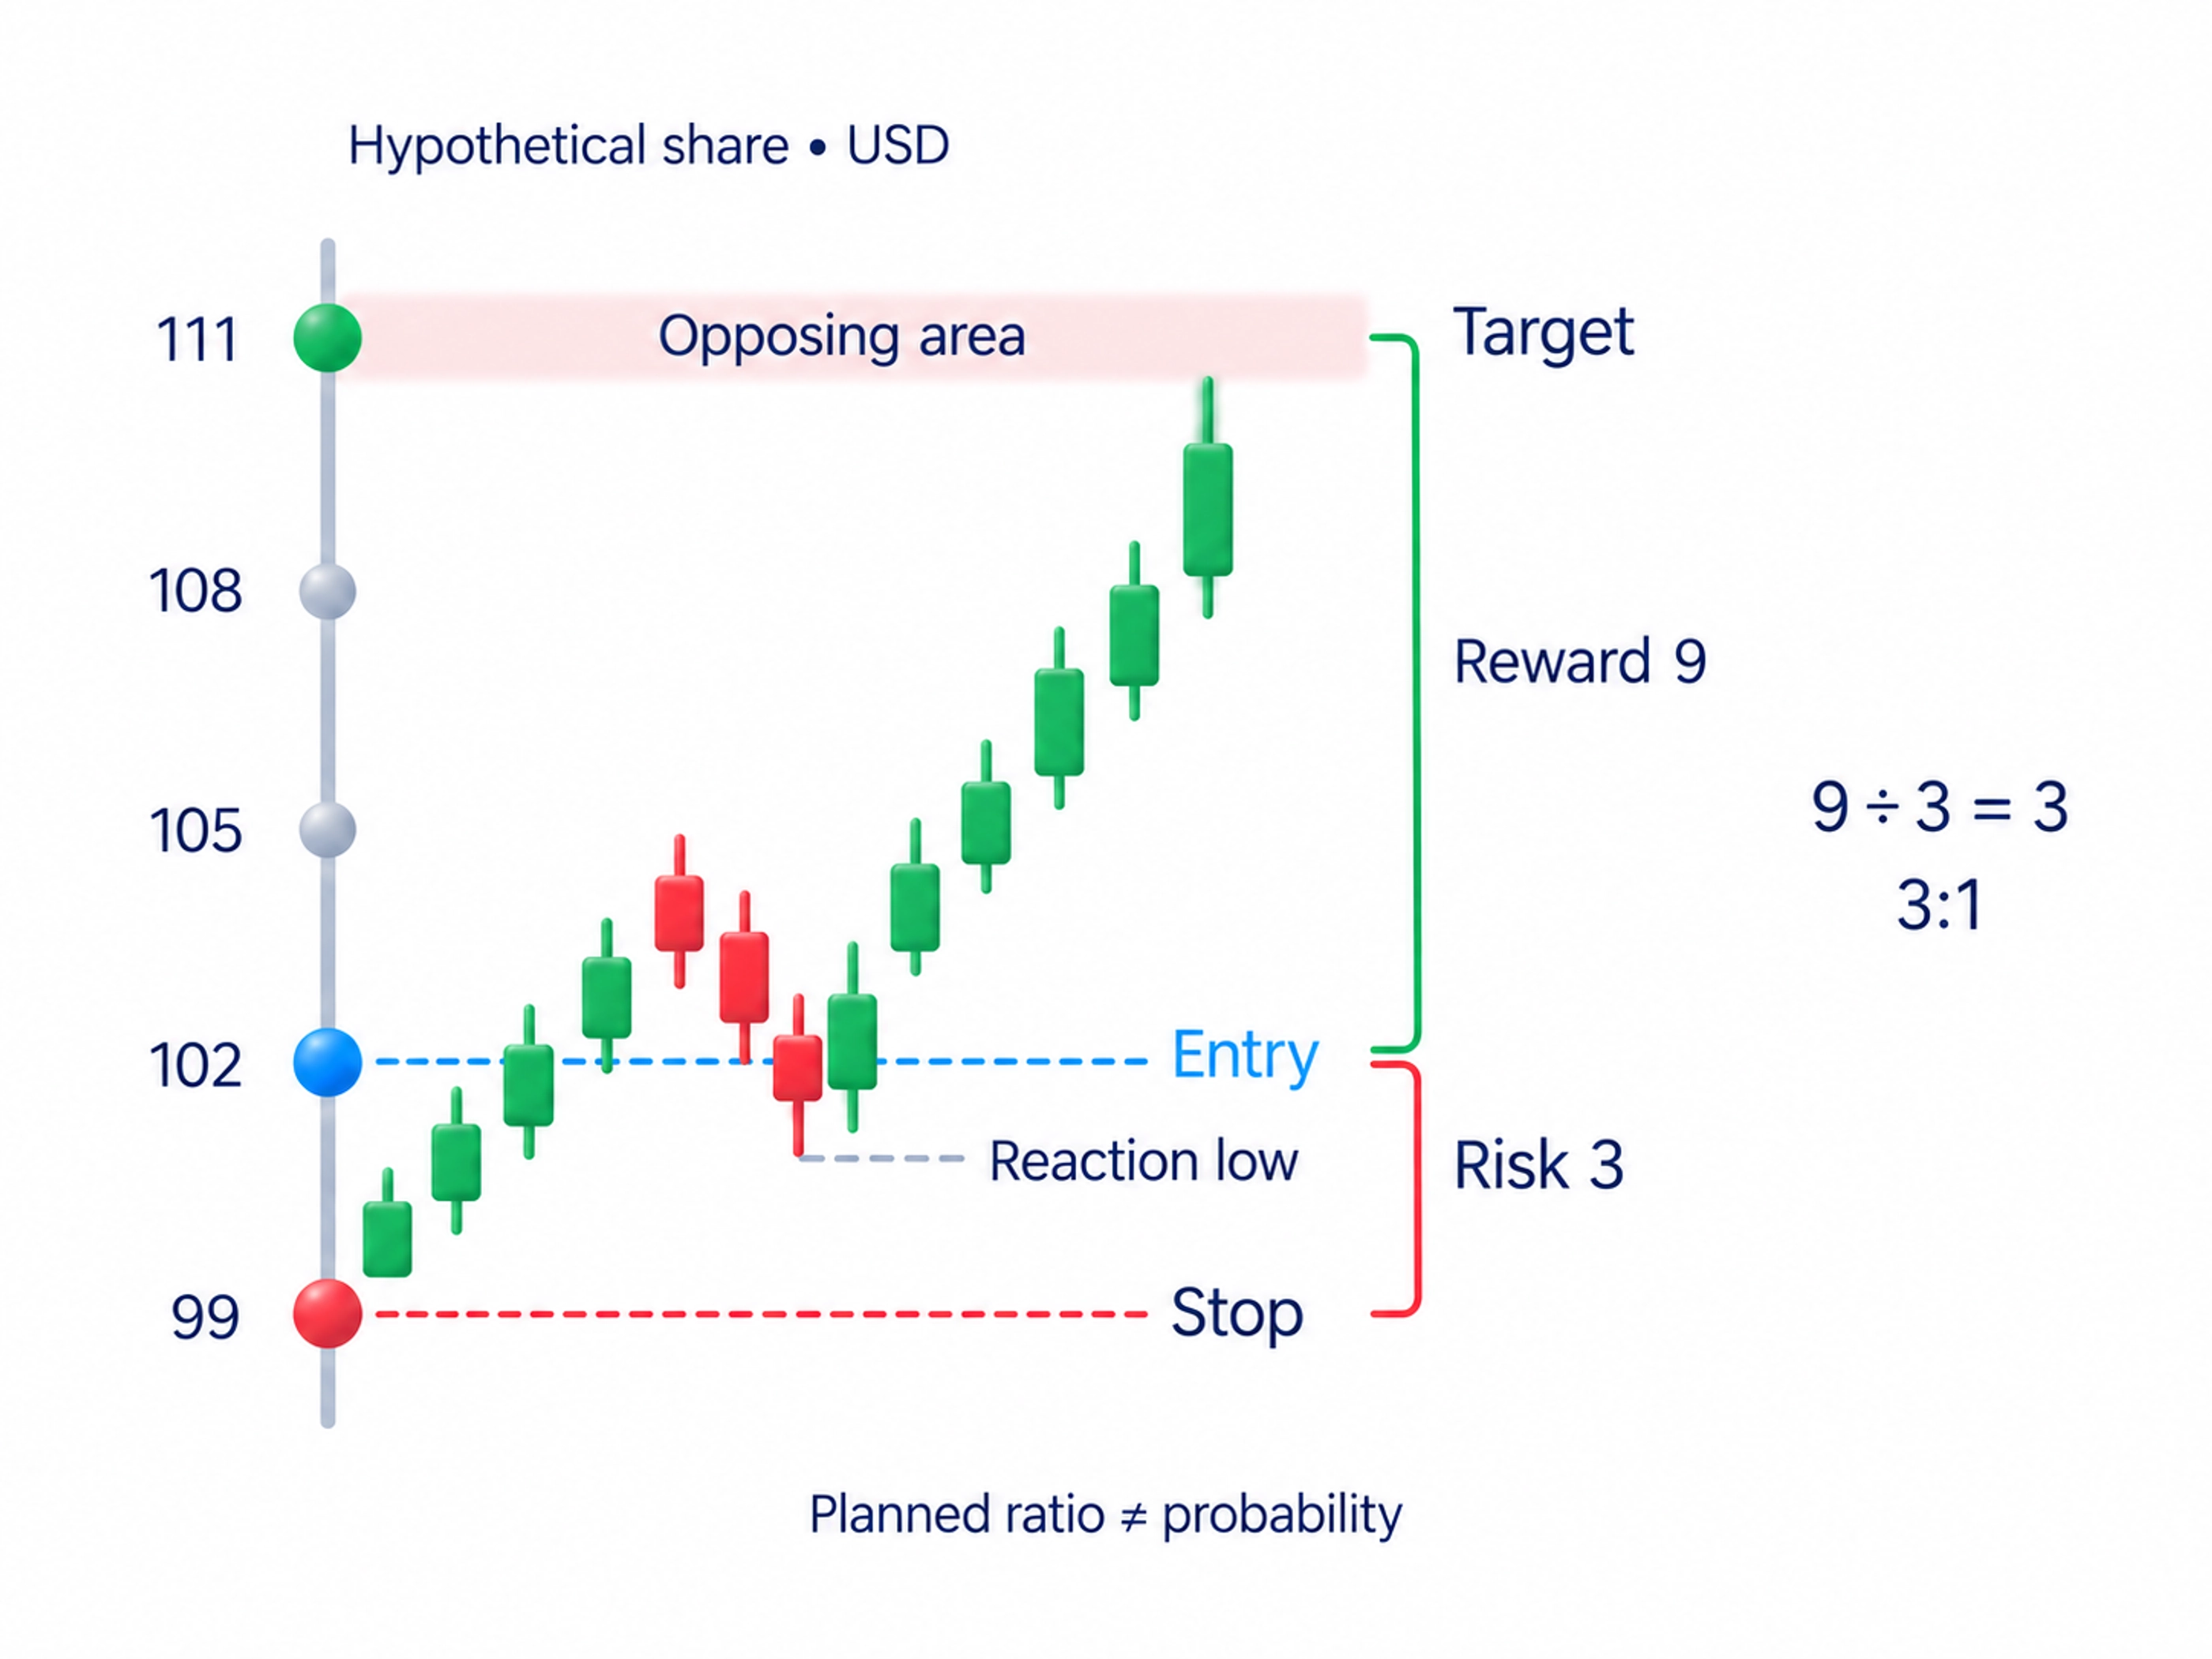
A target needs a reason on the chart. In the course, I use the opposing price area as an exit reference; that does not guarantee price will reach it. Do not select a distant price simply to reach a preferred ratio. If the next relevant area leaves too little room compared with the distance to the point where the setup fails, skipping the trade is an option.
How to practise a breakout setup
Hide the future candles and mark the zone before the exit. Record the chart period, the breakout criterion, the reaction you require and the event that cancels the setup. If you use volume, keep the data source and comparison method consistent.
Reveal the next candles gradually. Distinguish a continuation without a return, a retest that holds and an exit followed by failure of the setup. This shows which situations your rule actually covers and which ones you only find persuasive after seeing the result.
For each proposed entry, check whether every condition existed at that moment. A retest that appeared later cannot confirm an earlier trade. Keep failed cases alongside successful ones so that you assess the rule rather than collect attractive charts.
Frequently asked questions
It is a move beyond a price area where an earlier fall or rise stopped, marked in advance. The candle’s high or low crossing the boundary and a candle closing outside the zone are different observations. Choose which one your rule uses before seeing the result.
Price moves beyond the boundary and then returns inside the earlier area or range. Define the return condition in advance. High volume alone does not establish whether the move will continue or fail.
Entry orders and protective stops may be waiting beyond the level. Triggering them can add buying or selling, but that flow may not sustain further movement. The exit alone does not identify who caused it or prove deliberate manipulation.
It is a return to the boundary after a breakout. For an entry, check whether the new side holds and the expected direction resumes. A retest does not occur after every breakout.
In his failed-break demonstration, Arapov uses the extreme of the failed move as a stop reference. His course uses the opposing price area as an exit reference. Both depend on the setup, and a triggered stop does not guarantee a fill at its stated price.
About the author
Igor Arapov, a practising trader since 2013 and author of the ArapovTrade library. ORCID: 0009-0003-0430-778X.




