
Free trading course for beginners
This free course introduces the trading platform, chart reading, volume analysis and the Wyckoff method. The 32 chapters cover entries, stops, position sizing and trade journaling, followed by demo practice. Illustrations and videos show the concepts on real charts; your practice trades give you results to review.

Course contents
32 chapters
Course roadmap

A detailed guide to the course stages
- Understanding the market: the platform, charts, bars, timeframes and volume.
- Technical analysis: trends, ranges, priority change levels, reversal patterns and trend strength.
- Volume analysis and the Wyckoff method: effort versus result, interpreting activity and entry conditions.
- Psychology and risk: position sizing, fear and greed, cognitive biases, and the role of indicators and news.
- The trading system: three chart walkthroughs, followed by position management and expectancy.
- Preparing to practice: mistakes, choosing a broker and an instrument, costs and the trading journal.
- Demo practice: use consistent rules, record 100 trades and review the results. Make any decision to trade live separately, considering costs, execution and the losses you can afford.
The roadmap follows the sequence of the “Wyckoff and Volume Analysis” video course. The video provides an overview; the written chapters let you examine the concepts, chart annotations and each step of demo trading in detail.
Follow the same workflow throughout the course: read the chart, check the entry criteria, set the stop, calculate position size and record the result. Test whether your approach has positive expectancy using your own series of trades.
Check your understanding
Which stages take you from the market basics to demo practice?
Show answer
Understanding the market, technical analysis, volume analysis and the Wyckoff method, psychology and risk, the trading system, preparation for practice and demo practice.
What should you do during demo practice?
Show answer
Use consistent rules, record 100 trades and review the results. Decide separately whether to trade live.
How to start learning to trade
If you are new to trading, follow this simple plan:
- Read the chapters in order: each stage uses the definitions and rules from the previous one.
- Set up a virtual Paper Trading account or a demo account offered by your chosen broker or provider. You do not need real money at this stage.
- After each chapter, open a chart and look for the concept you have studied. Mark the relevant trend, range or level. If the structure you need is missing, do not force a setup.
- Make 100 demo trades using consistent rules, and record each one in your journal. Use this initial sample to review performance, costs and how closely you followed the system. It does not establish future profitability.
- Consider a live account only after reviewing your demo trades. Live results can differ because of execution, costs and the way you respond to real losses.
Check your understanding
In what order should you begin studying the course?
Show answer
Read the chapters in order, set up a virtual account and look for each concept on a chart.
Why make 100 demo trades and record them in a journal?
Show answer
To build an initial sample for reviewing results, costs and how consistently you followed the rules.
Introduction to charts and the trading platform
The platform displays market data and lets you place orders. A demo account allows you to practice without risking real money.
We will use TradingView to examine the price chart and volume indicator. If the layout changes, identify the instrument, timeframe and data source first.
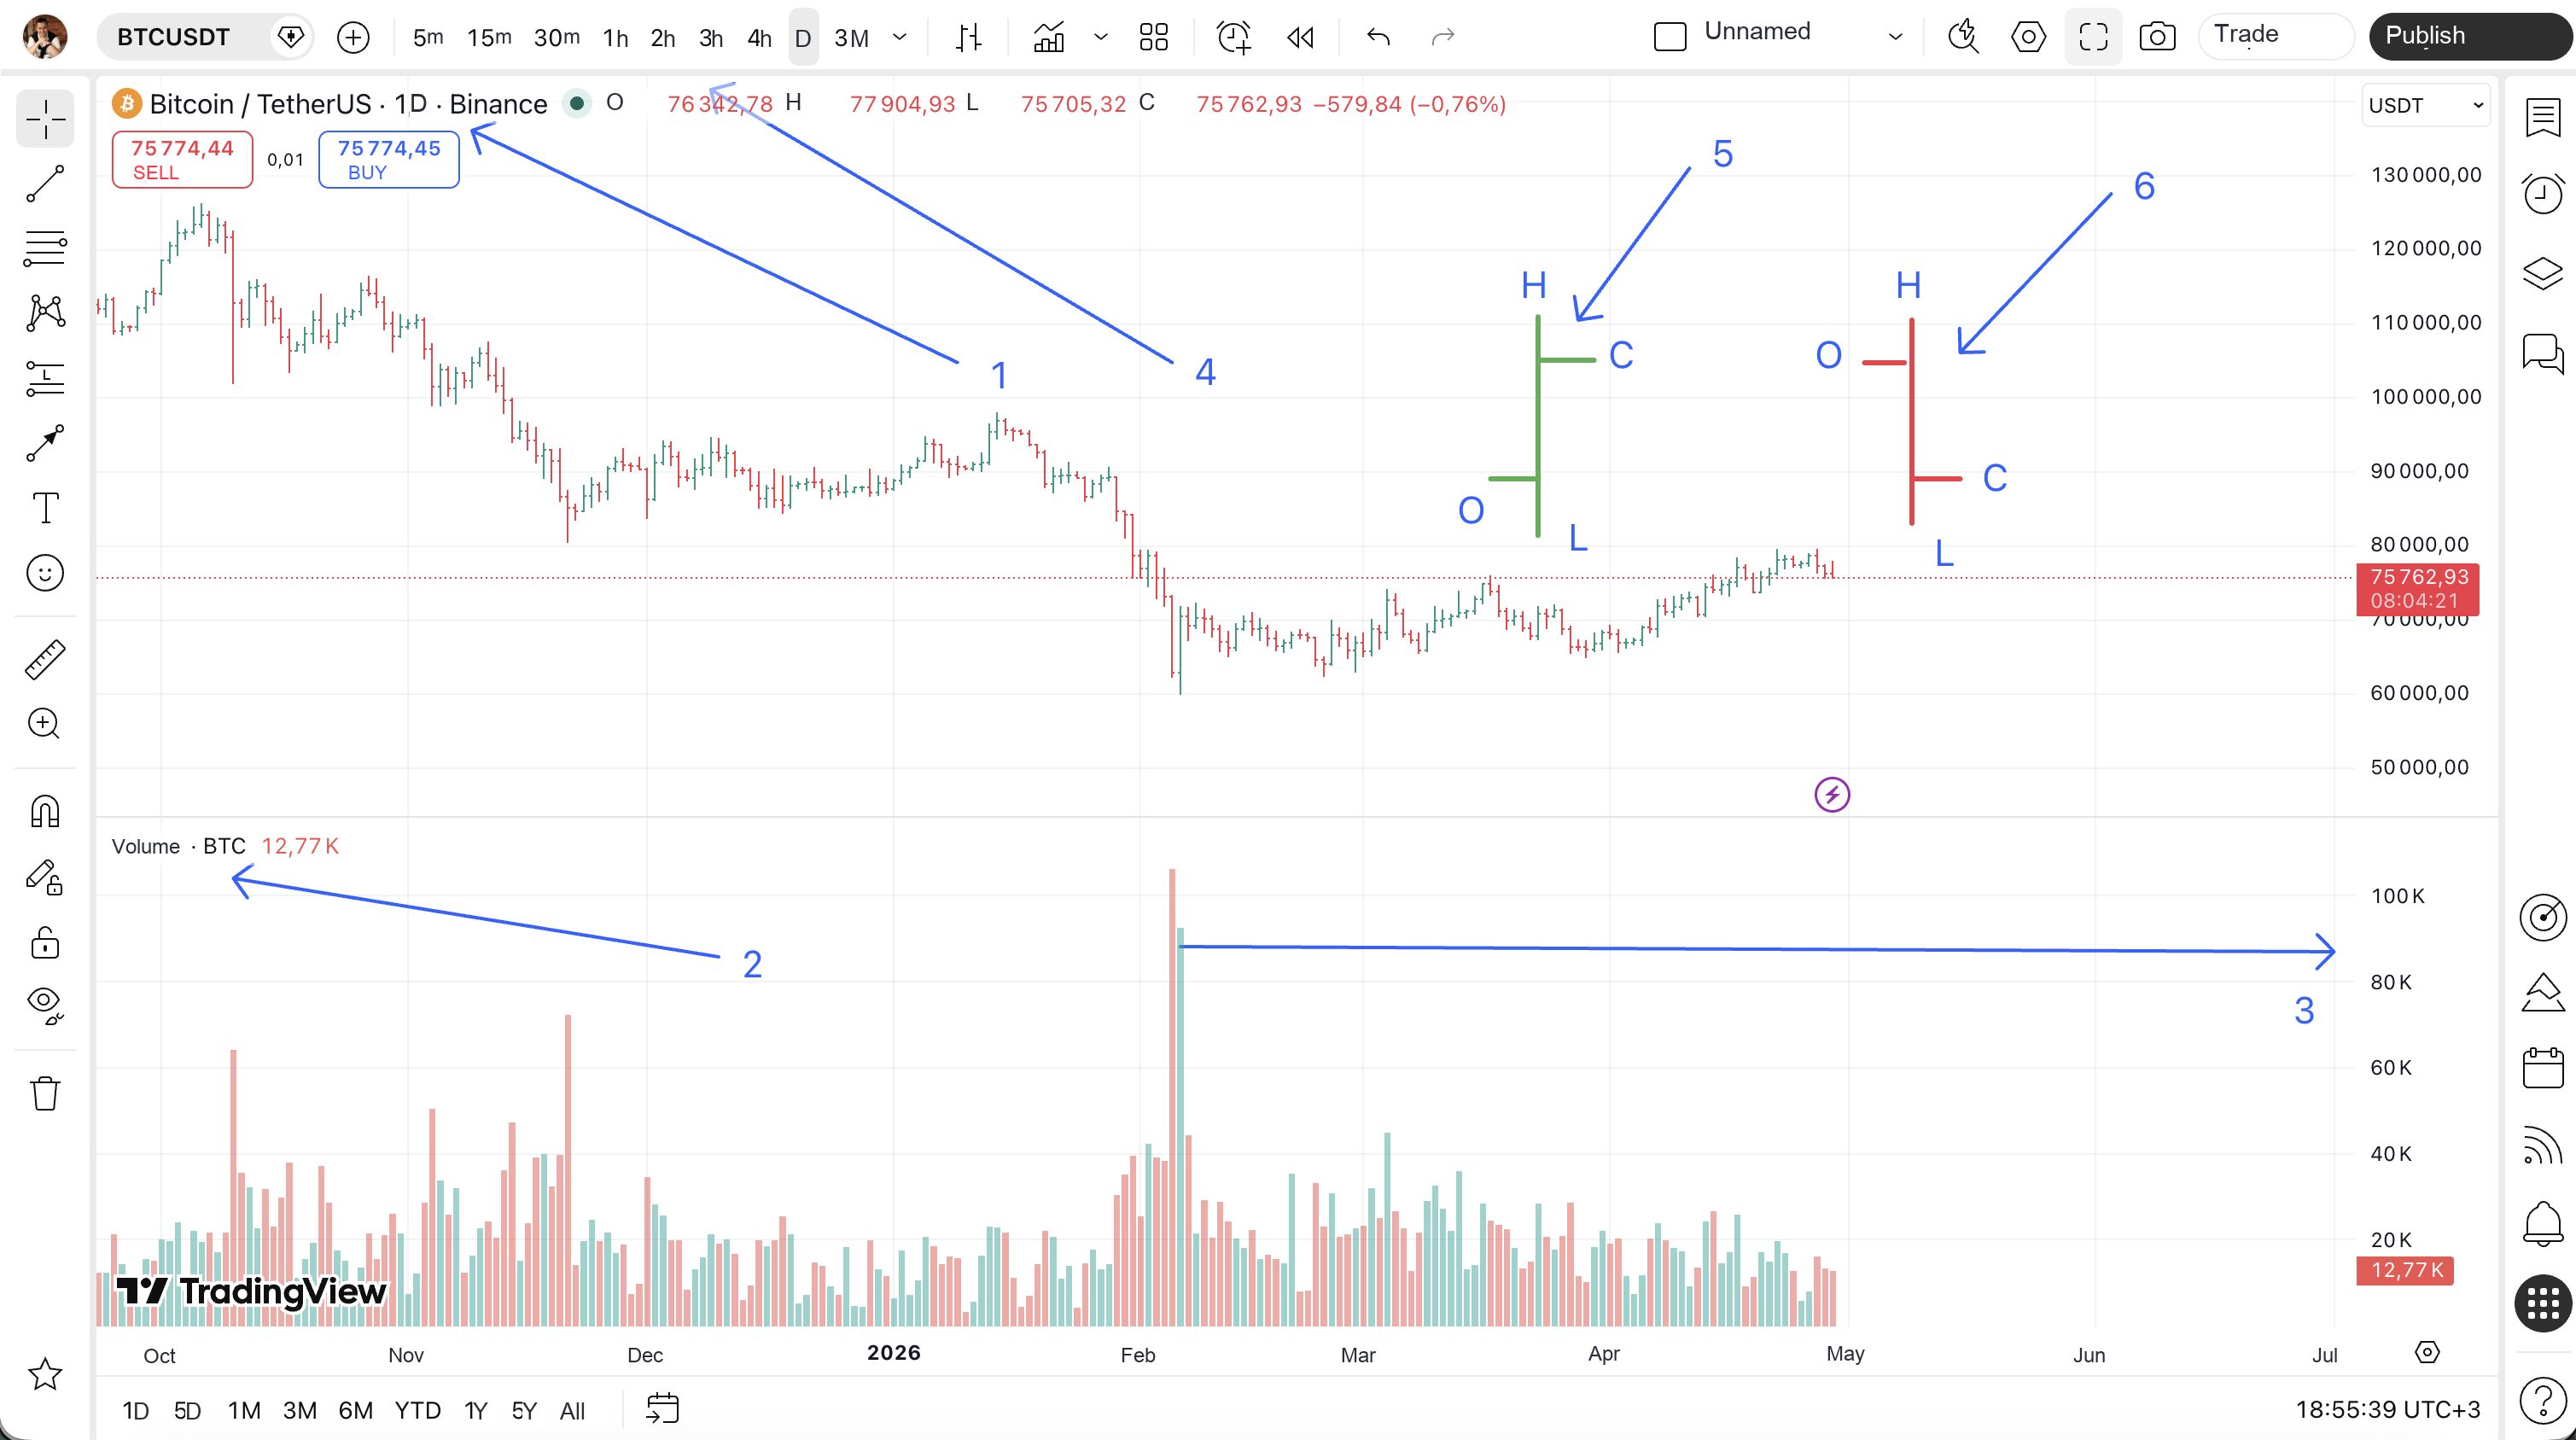
We will look at the cryptocurrency Bitcoin and how its price and volume appear on the platform. The arrows and numbers in the image identify the elements discussed below.
Instrument name, timeframe and data source
The top of the platform shows the instrument name, timeframe and data source. In our example: Bitcoin/TetherUS · 1D · Binance.
- Bitcoin/TetherUS shows the price of Bitcoin in USDT. USDT is a stablecoin designed to track the dollar; holding USDT is different from holding dollars in a bank account.
- 1D: each chart bar represents one day.
- Binance is the source of quotes and volume for the selected instrument. These figures cover that venue, not the entire market.
The saved course chart shows Bitcoin at 75,762 USDT per coin. This is the price in the screenshot, not a live quote.
Reading the price data
On a standard chart, the top row shows the selected bar’s open, high, low and close. Some values update while the bar is forming.
- OPEN: the price when the current bar opened.
- HIGH: the highest price reached during the bar’s period.
- LOW: the lowest price reached during the bar’s period.
- CLOSE: the last recorded price; for an unfinished bar, this is the current market price.
In the screenshot, the open is 76,342, the high 77,904, the low 75,705 and the latest value 75,762 USDT per Bitcoin. These four values describe the daily bar, but do not reveal whether the high or low was reached first.
Bars and Japanese candlesticks: what is the difference?
A standard bar and a standard Japanese candlestick both show the open, close, high and low for a single period, but display them differently. Synthetic chart types may use calculated values, so use standard bars or candles for the examples.
On a bar, the left tick marks the open, the right tick the close, and the vertical line the high and low. A candle’s body connects the open and close; its wicks show the high and low. Colors depend on the platform settings.

We use bars in the course examples.
An up bar (bullish bar)
A bar shows price movement over a selected period. Four values are needed to read it:
- O (Open): opening price.
- C (Close): closing price.
- H (High): highest price during the period.
- L (Low): lowest price during the period.
A bullish bar closes above its open. The green color comes from the chart settings. An up bar shows that price rose during the period; it does not count buyers, because every completed trade has both a buyer and a seller.
A down bar (bearish bar)
A bearish bar closes below its open. The example uses red, but you can change this in the settings. The bar shows a price decline, not a count of buyers and sellers.
Compare the opens, closes, highs and lows of successive bars to read price movement and mark levels. A single bar is not enough to establish a trade setup.
The volume indicator
The lower window shows volume for each bar. Check the units for the cryptocurrency pair you selected: the indicator may show coins traded or turnover in the quote currency. It does not count individual transactions. The figures cover the selected venue, not the whole Bitcoin market. Later, we will compare volume with price movement.
Check your understanding
Which four prices does a standard bar or Japanese candlestick show?
Show answer
The open, high, low and close of one period.
How do the open and close distinguish an up bar from a down bar?
Show answer
An up bar closes above its open. A down bar closes below its open.
What is a demo account and how do you open one?
A demo account uses virtual funds, so you can practice placing orders and following your rules without risking real money. The available price feed and any delay depend on the connection, and demo fills may differ from live fills.
Using TradingView, we will look inside a demo account. The screenshot marks the key elements:
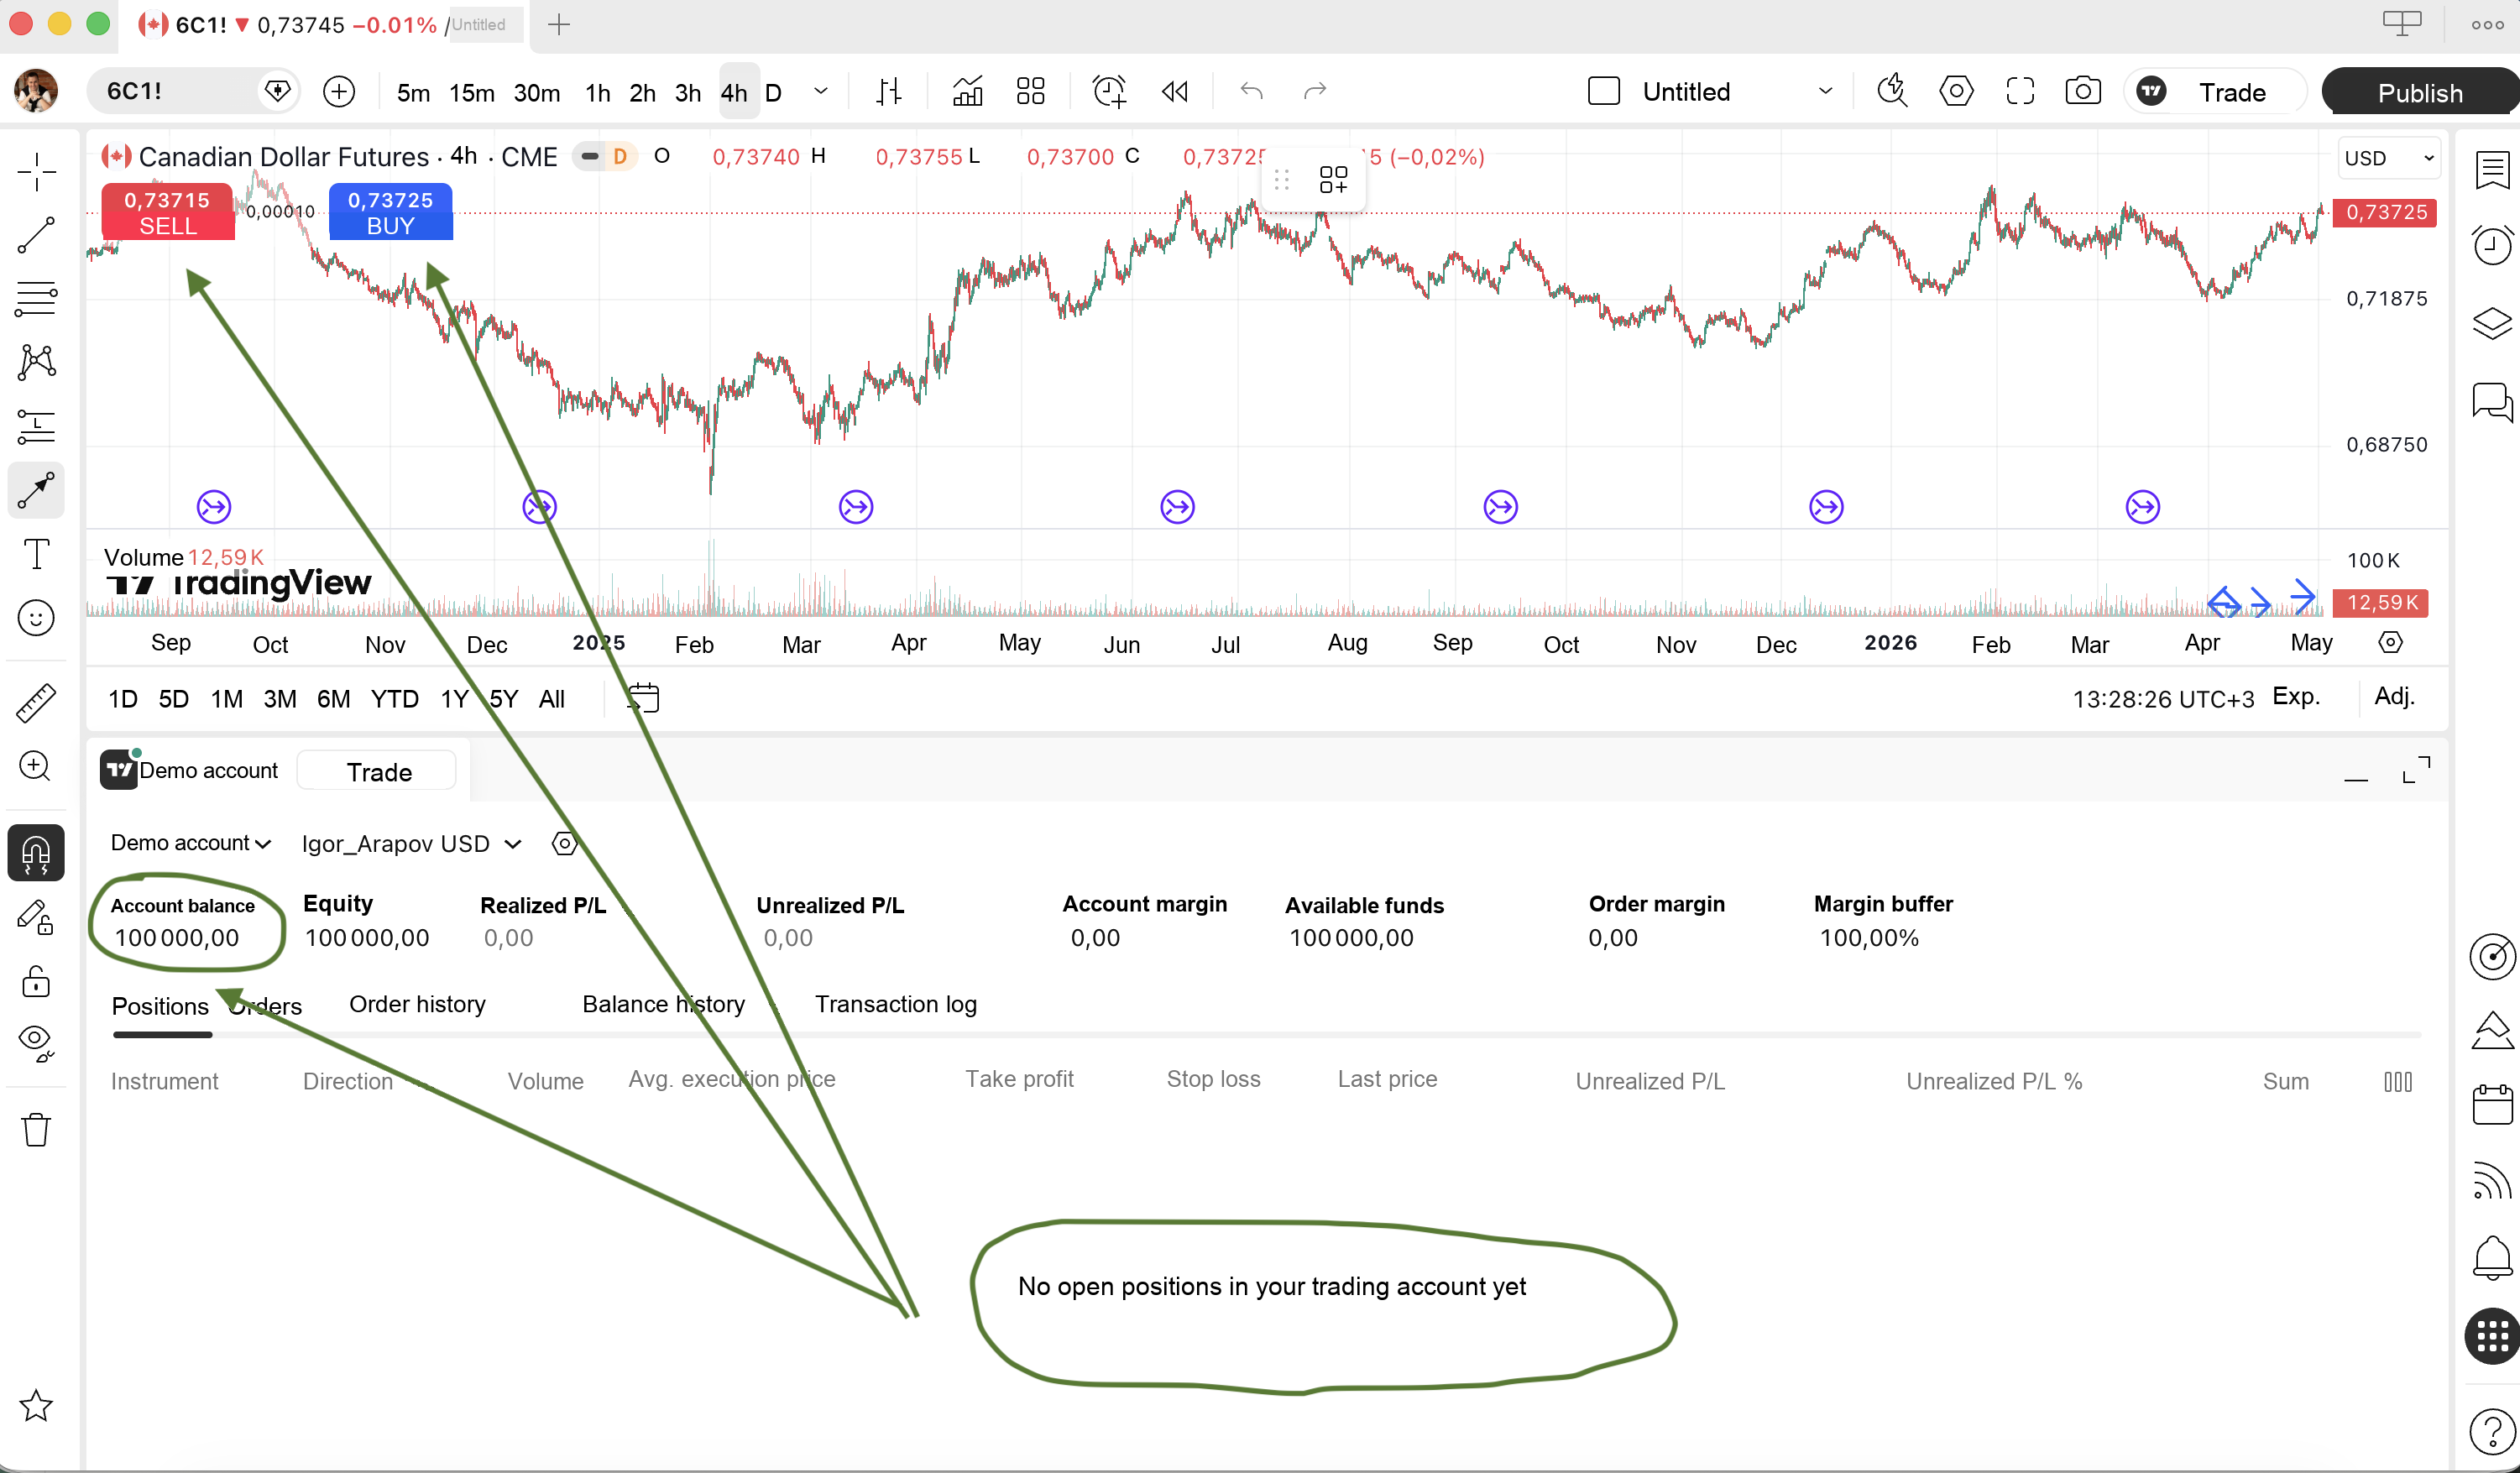
The course screenshot shows 100,000 virtual dollars in the demo account. You can change the balance and other settings. Base your practice position size on your risk limit rather than on the amount of virtual money available.
In TradingView, connect Paper Trading, the virtual-trading mode. Connecting a live brokerage account is a separate action. Button names and locations may change; check which account is connected before placing an order.
The Positions tab shows open trades. After entering a practice trade, check the instrument, direction, position size and current profit or loss. Take-profit sets an exit to take a profit; stop-loss sets a protective exit if price moves against you. How either order fills depends on its conditions.
How to open a demo account in TradingView:
- Go to TradingView.
- Register a free account.
- Open any chart.
- Open the trading panel and connect Paper Trading.
- Your virtual balance is added automatically, so you can start practicing immediately.
If your chosen broker or provider offers a demo account, check which instruments are supported, how long access lasts and which conditions apply. A familiar interface helps you practice, but does not establish how live orders will fill. Registration requirements vary by provider.
Demo trading may differ from live trading in order queues, slippage and your psychological response. Use 100 trades as an initial practice series, then review costs, rule violations and market conditions.
Keep the same planned risk throughout your demo series and record every trade. This lets you check for order-entry mistakes and test how consistently you follow your rules.
Check your understanding
What money does a demo account use, and what can you practice with it?
Show answer
Virtual funds. You can practice placing orders and following your rules using the available price feed without risking real money.
How do you connect virtual trading in TradingView?
Show answer
Register a free account, open a chart, then open the trading panel and connect Paper Trading.
Trading basics: spread, lot, long and short
Spread and commission
With the platform open and the demo account ready, we can cover three basics: the spread, position size in lots, and trade direction—long or short.
Immediately after entry, a position may show a loss because of spread and commission. Check the execution prices and how the platform calculates the result.
The spread is the gap between the best bid and ask prices. If you buy and immediately sell, this difference affects the result. It is not necessarily charged as a separate commission.
In this example, you can buy euros at 1.0850 and sell at 1.0848. The gap is 0.0002, or 2 pips when one pip is 0.0001. Buying and immediately selling at those prices loses that difference. The cash amount depends on position size; the spread is not necessarily deducted as a separate fee when you enter.

Commission is a separate charge for transactions. It may be fixed or depend on trade size; holding a position may incur additional costs. Before trading, find out what is included in the spread and which fees are charged separately.
What is a lot in trading?
A lot is a standardized unit of trade size. The platform may accept lots, contracts, shares or coins: always check the field label and product specifications.
In Forex, a standard lot is 100,000 units of the base currency. Check your provider’s minimum size and the increments in which you can increase it:
- 1 lot = 100,000 units.
- 0.1 lot = 10,000 units (mini lot).
- 0.01 lot = 1,000 units (micro lot).
Exchange-traded futures use whole contracts, each with a point value defined in its specifications. Fractional Forex lots do not carry over to futures: you cannot trade 0.233 of an exchange-traded contract.
Use your planned risk to choose position size, even on a demo account. If even the minimum position would risk more than your limit, skip the trade or assess another instrument.
Long and short positions
A short position can benefit from a price decline. How you open it depends on the instrument: borrowing shares and selling a futures contract work differently.
A long position aims to profit from rising prices. Buying and then selling at a higher price produces a gain before costs; selling at a lower price produces a loss.
A short position aims to profit from falling prices. With borrowed shares, you sell first, then buy them back to return them. Futures and CFDs (contracts for difference) create the position under the contract’s terms; you do not need to borrow the underlying asset itself.
Suppose a EUR/USD short opens at 1.0850 and closes at 1.0800. That is a favorable move of 50 standard pips before costs. The profit depends on position size and the product’s specifications; quoting these prices does not mean euros were borrowed.

Long and short describe the direction of a position. Orders are the instructions used to open or close it.
Check your understanding
What is the spread if you can buy at 1.0850 and sell at 1.0848?
Show answer
The difference is 0.0002, or 2 pips using the standard 0.0001 pip for this pair.
Which price direction do long and short positions aim to benefit from?
Show answer
A long position aims to benefit from a rise; a short position from a decline.
Types of exchange orders
An order instructs the platform to buy or sell a specified amount of an instrument. Start by distinguishing market execution, a limit price and a stop trigger. The order types available depend on the product and venue.

Market order
A market order seeks to fill against orders available on the other side of the market. The displayed price may not be available for the entire order: partial fills, delays and venue restrictions are possible.
- Buy: buy from the available sell orders.
- Sell: sell into the available buy orders.
A market order prioritizes execution over a fixed price. Slippage is the difference between the price you expect and the price you receive. A shortage of orders on the other side of the market can make that difference substantial.
Pending order
On the platform, a pending order waits for the conditions you set. A limit order sets a price boundary and can fill immediately if the current bid or ask meets it. A stop order waits for its trigger. Price touching a level does not guarantee that the whole order will fill.
Limit:
- Buy Limit sets the maximum purchase price. It is often placed below the market to await a decline, but may execute immediately if the available ask is at or below the limit.
- Sell Limit sets the minimum selling price. You can leave it above the market to await a rise; if an available bid already meets or exceeds the limit, it may execute immediately.
Stop:
- Buy Stop triggers a buy order when price reaches the specified higher level. With market execution, the final price may differ from the activation level. A breakout does not place an order automatically; a trader or program must submit it.
- Sell Stop triggers a sell order when price reaches the specified lower level. The fill depends on the orders available on the other side of the market. The activation condition and execution price are different values.
Stop Limit:
- Buy Stop Limit creates a buy limit order once the activation condition is met. The limit restricts the price, but during fast movement the order may remain unfilled.
- Sell Stop Limit creates a sell limit order after activation. If available prices are below the limit, the order may remain unfilled. Used to exit a position, it does not guarantee that the position will close.
Pending orders relative to the current price

The “Limit and Market Orders” video explains this mechanism in detail on an actual platform.
The order book: how pending orders appear
Bid is the highest price available to a seller; Ask is the lowest price available to a buyer. Their difference is the spread. Last is the price of the most recent trade. The visible order book belongs to the selected instrument and data source.

The order book displays available limit orders, which can be filled, changed or canceled. Stop orders use separate triggers and may not appear in the book. A displayed order does not reliably tell you who placed it or the size of their entire position.
Limit orders provide liquidity for incoming orders to trade against. Trades can fill at those prices while that liquidity remains available; as orders fill or are canceled, the best bid and ask can change. The book does not guarantee that a level will hold.
Leverage affects the collateral required for a position. Also calculate how your chosen position size affects the potential loss when price moves.
Check your understanding
How does a market order differ from a limit order?
Show answer
A market order is intended to execute against available orders on the other side of the market. A limit order sets a maximum purchase price or minimum selling price.
What happens to a stop-limit order once its activation condition is met?
Show answer
It creates a limit order to buy or sell.
What is leverage in trading?
Before using leverage, we will examine collateral, position size and the conditions for forced liquidation.
Leverage lets you open a position whose total value exceeds the collateral deposited. With $1,000 in capital and a $10,000 position, a 1% price change corresponds to about $100 in profit or loss before costs. Selecting leverage in the settings does not mean that such a position has already been opened.

Leverage magnifies changes in profit or loss relative to capital when the actual position size increases. If the position is 100 times your capital, a roughly 1% adverse move equals that capital before costs. Forced liquidation may occur earlier.
A margin call is a notice that funds are insufficient or a request for more collateral. Forced closure is called stop-out or liquidation, depending on the product. The venue sets the thresholds and process, and may close the position without advance warning.
For initial practice, I suggest minimal leverage or no leverage if the instrument allows it. Available collateral is not permission to use the largest possible position. First determine your acceptable loss, then the stop and position size; practice the calculation on a demo account.
Check your understanding
What does leverage allow you to do?
Show answer
Open a position whose total value exceeds the collateral deposited.
What profit or loss before costs corresponds to a 1% price movement on a $10,000 position?
Show answer
About $100: a profit if price moves in your favor, or a loss if it moves against you.
Technical analysis of the market
Technical analysis studies price movement and recurring chart structures. In this course, it gives us a consistent way to describe trends, levels and trade-invalidation conditions. A familiar chart pattern does not make the next move predictable.
Why switch timeframes?
A timeframe is the period covered by one bar. Daily and one-minute charts show different levels of detail, and can have different local trend directions. Identify your timeframe before you analyze the chart.
Use the two timeframes as follows:
- A higher timeframe, such as the daily chart, helps you identify the broader structure and key zones. It provides context but does not replace the entry criteria on your trading timeframe.
- A lower timeframe, such as 15 minutes, shows movement in detail. Check entry and stop against your rules while keeping the higher-timeframe context in mind.
From bars to waves: reading market structure
Price swings consist of sequences of bars. Within them, we mark impulses, pullbacks, local highs and lows to identify structure.
An impulse is a directional stretch of price movement. A pullback is movement in the opposite direction after an impulse. Local highs and lows are the peaks and troughs of the waves you have identified.
A wave is a price swing you have identified on the chart. It can contain bars in both directions, so you mark its boundaries at the relevant swing highs and lows. Alternating impulses and pullbacks help describe structure.
Impulses and pullbacks alternate as price moves. Sometimes the market continues without a usable pullback, leaving no entry under the plan.
Identifying structure helps choose direction; it does not tell you where price will go next.
Check your understanding
What does technical analysis study?
Show answer
Price movement and recurring chart structures.
What does a timeframe specify?
Show answer
The period of one bar.
Market phases: trends and trading ranges
First distinguish a trend from a sideways trading range. That distinction tells us which entry conditions to examine.
A trading range is sideways movement within selected boundaries. Price can temporarily move beyond a boundary; use the reaction that follows to assess whether the range is still intact.
The upper boundary of a range is commonly called resistance; the lower boundary is support.

A trend is directional movement with a sequence of highs and lows. My basic plan is to trade in the direction of that trend. Impulses and pullbacks can have different durations; a trend’s presence alone does not guarantee profit.
There are two main types of trend:
- A bearish trend has lower highs and lower lows on the chosen timeframe. A single rally does not necessarily invalidate that sequence.
- A bullish trend has higher highs and higher lows on the chosen timeframe.

I start with the highs and lows on the chosen timeframe. Lower highs and lower lows lead me to look for shorts at resistance; higher highs and higher lows lead me to look for longs at support. Priority change levels tell me when to reassess that plan. This is the approach taught in this course, rather than a rule for every trader.
Check your understanding
How does a trend differ from a trading range?
Show answer
A trend is directional movement with a sequence of highs and lows. A trading range is sideways movement within selected boundaries.
How do highs and lows distinguish bullish and bearish trends?
Show answer
In a bullish trend, highs and lows rise. In a bearish trend, they fall.
Priority change levels
In my approach, a Priority Change Level (PCL) is a dynamic chart zone from which an impulse (a buying or selling wave) begins and goes on to make new price extremes.

A break through a level alerts me to a possible change in the trading setup. To confirm a new uptrend, we check whether the area holds and higher highs and lows form; a single breakout is not enough.
I look for repeated tests of an area, usually three or more touches, to judge whether it is holding. Those reactions do not reveal anyone’s hidden position or guarantee another bounce.

On the EUR/USD chart, we will mark areas from which movement produced new lows and highs.
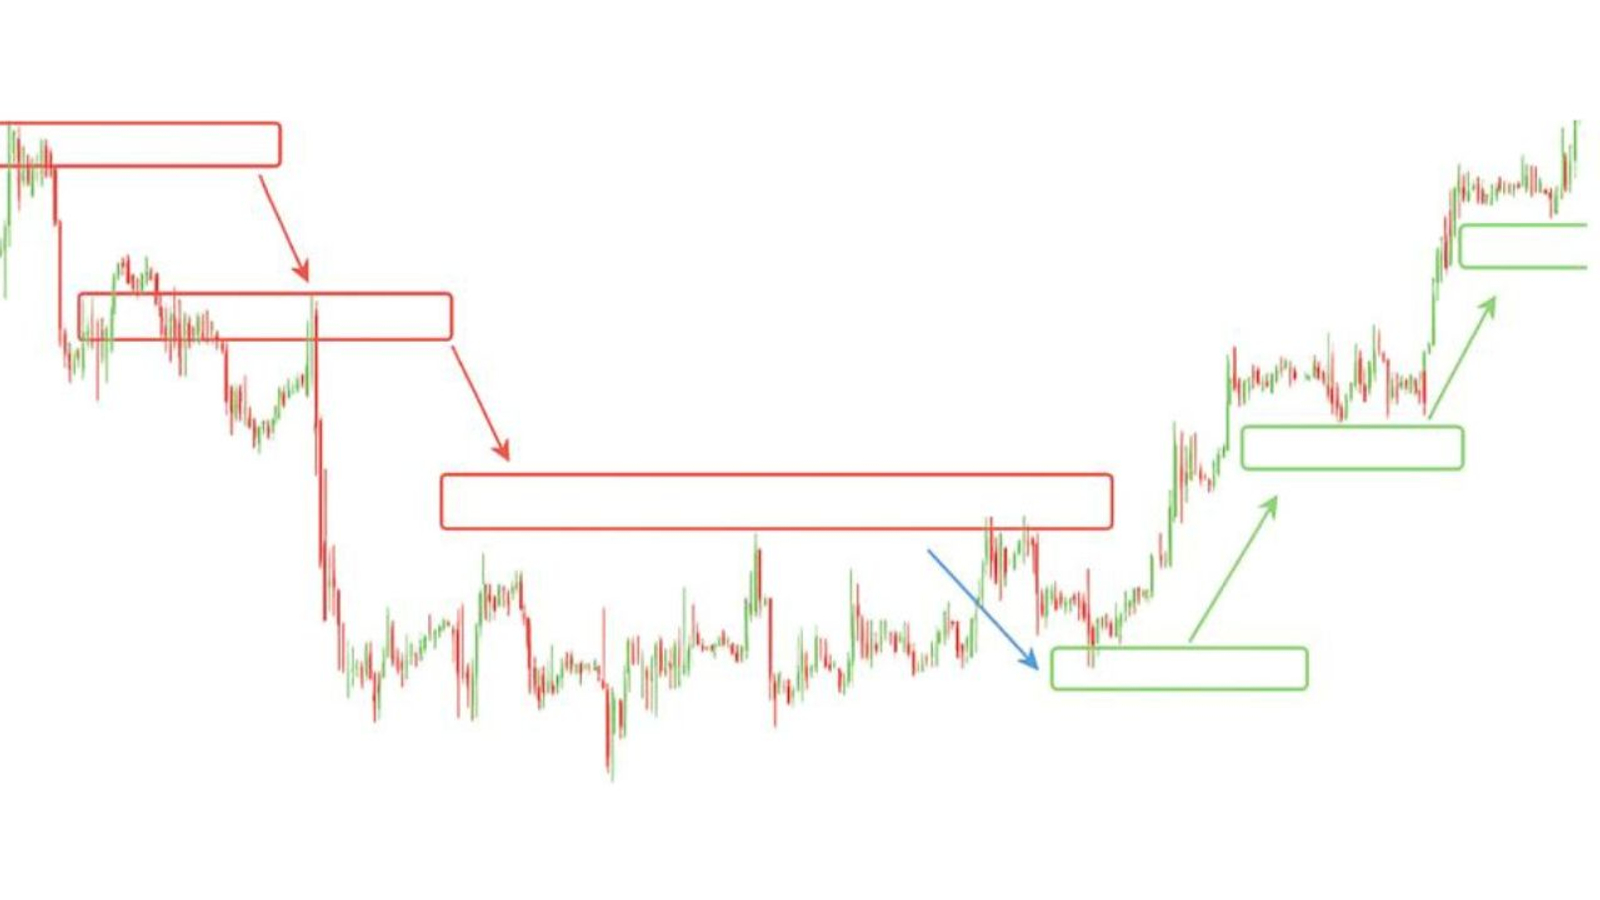
Each new low led us to mark a resistance level. While that bearish structure remained intact, our working assumption was a further decline. Here, a clearly defined range formed before the reversal; after price broke out, a bullish structure developed. Wait for the chart to show a change before changing your assumption. Our job is to respond to the structure that exists, rather than predict its replacement.
In a downtrend, I look for short entries at resistance. After a confirmed structural change, I check buying conditions at support instead of automatically continuing with the old plan.
Check your understanding
What is a priority change level, or PCL, in this approach?
Show answer
A dynamic zone from which an impulse begins and goes on to make new price extremes.
After a PCL breakout, what signs are used to check a new uptrend?
Show answer
Whether the area holds and highs and lows rise.
Reversal patterns in technical analysis
Having studied trends, ranges and PCLs, we will examine possible reversals. We need a sequence of observations rather than a prediction based on a single pattern.
The diagrams show how former resistance can become support after a breakout. We check whether the area holds in its new role and price continues higher.

In the diagram, the downward sequence stops making new lows. The move back above a low after price breaks below it is covered in more detail in the false-breakout material; we then look for a break of the marked PCL, a successful retest and higher lows as signs of a new bullish structure.
A range may form before a trend changes, but it is not required. When marking up the chart, I watch for a break of the active PCL, then assess the retest and whether a new structure develops in the opposite direction.

Price breaks above former resistance, the area holds as support, and higher lows follow. That sequence changes my working setup. A brief break without a successful retest does not confirm a new trend; different reversal patterns still require the same structural checks.

In this method, we change the planned trade direction after an observed structural change. Weakness in the old movement does not prove a new trend: check the PCL break, whether it holds on a retest and whether higher lows form.
Check your understanding
How can former resistance change its role after a breakout?
Show answer
It can become support. Check whether the area holds and movement continues.
Which sequence is checked for a new bullish structure?
Show answer
Price breaks the marked PCL, the level holds on a retest, and higher lows form.
How to assess trend strength
Compare the distance and speed of an impulse with its pullback on the same timeframe. Shorter impulses and deeper pullbacks can indicate weakening structure, but are not an entry signal by themselves.
Even a shorter impulse can continue the trend if the pullback has not broken the trend’s sequence of highs and lows. A pause alone therefore does not confirm a reversal.

A weakening trend does not yet mean a change of direction. After a PCL break, check whether the level holds and an opposite sequence of highs and lows forms.
Use “Drawing Levels” to reinforce your understanding of levels, channels and false breakouts.
Check your understanding
What do you compare to assess trend strength?
Show answer
The distance and speed of the impulse compared with its pullback on the same timeframe.
What relationship between impulses and pullbacks suggests a weakening trend?
Show answer
Impulses shrink while pullbacks expand. This is a reason to check for weakening structure, not a standalone entry signal.
Market volume analysis
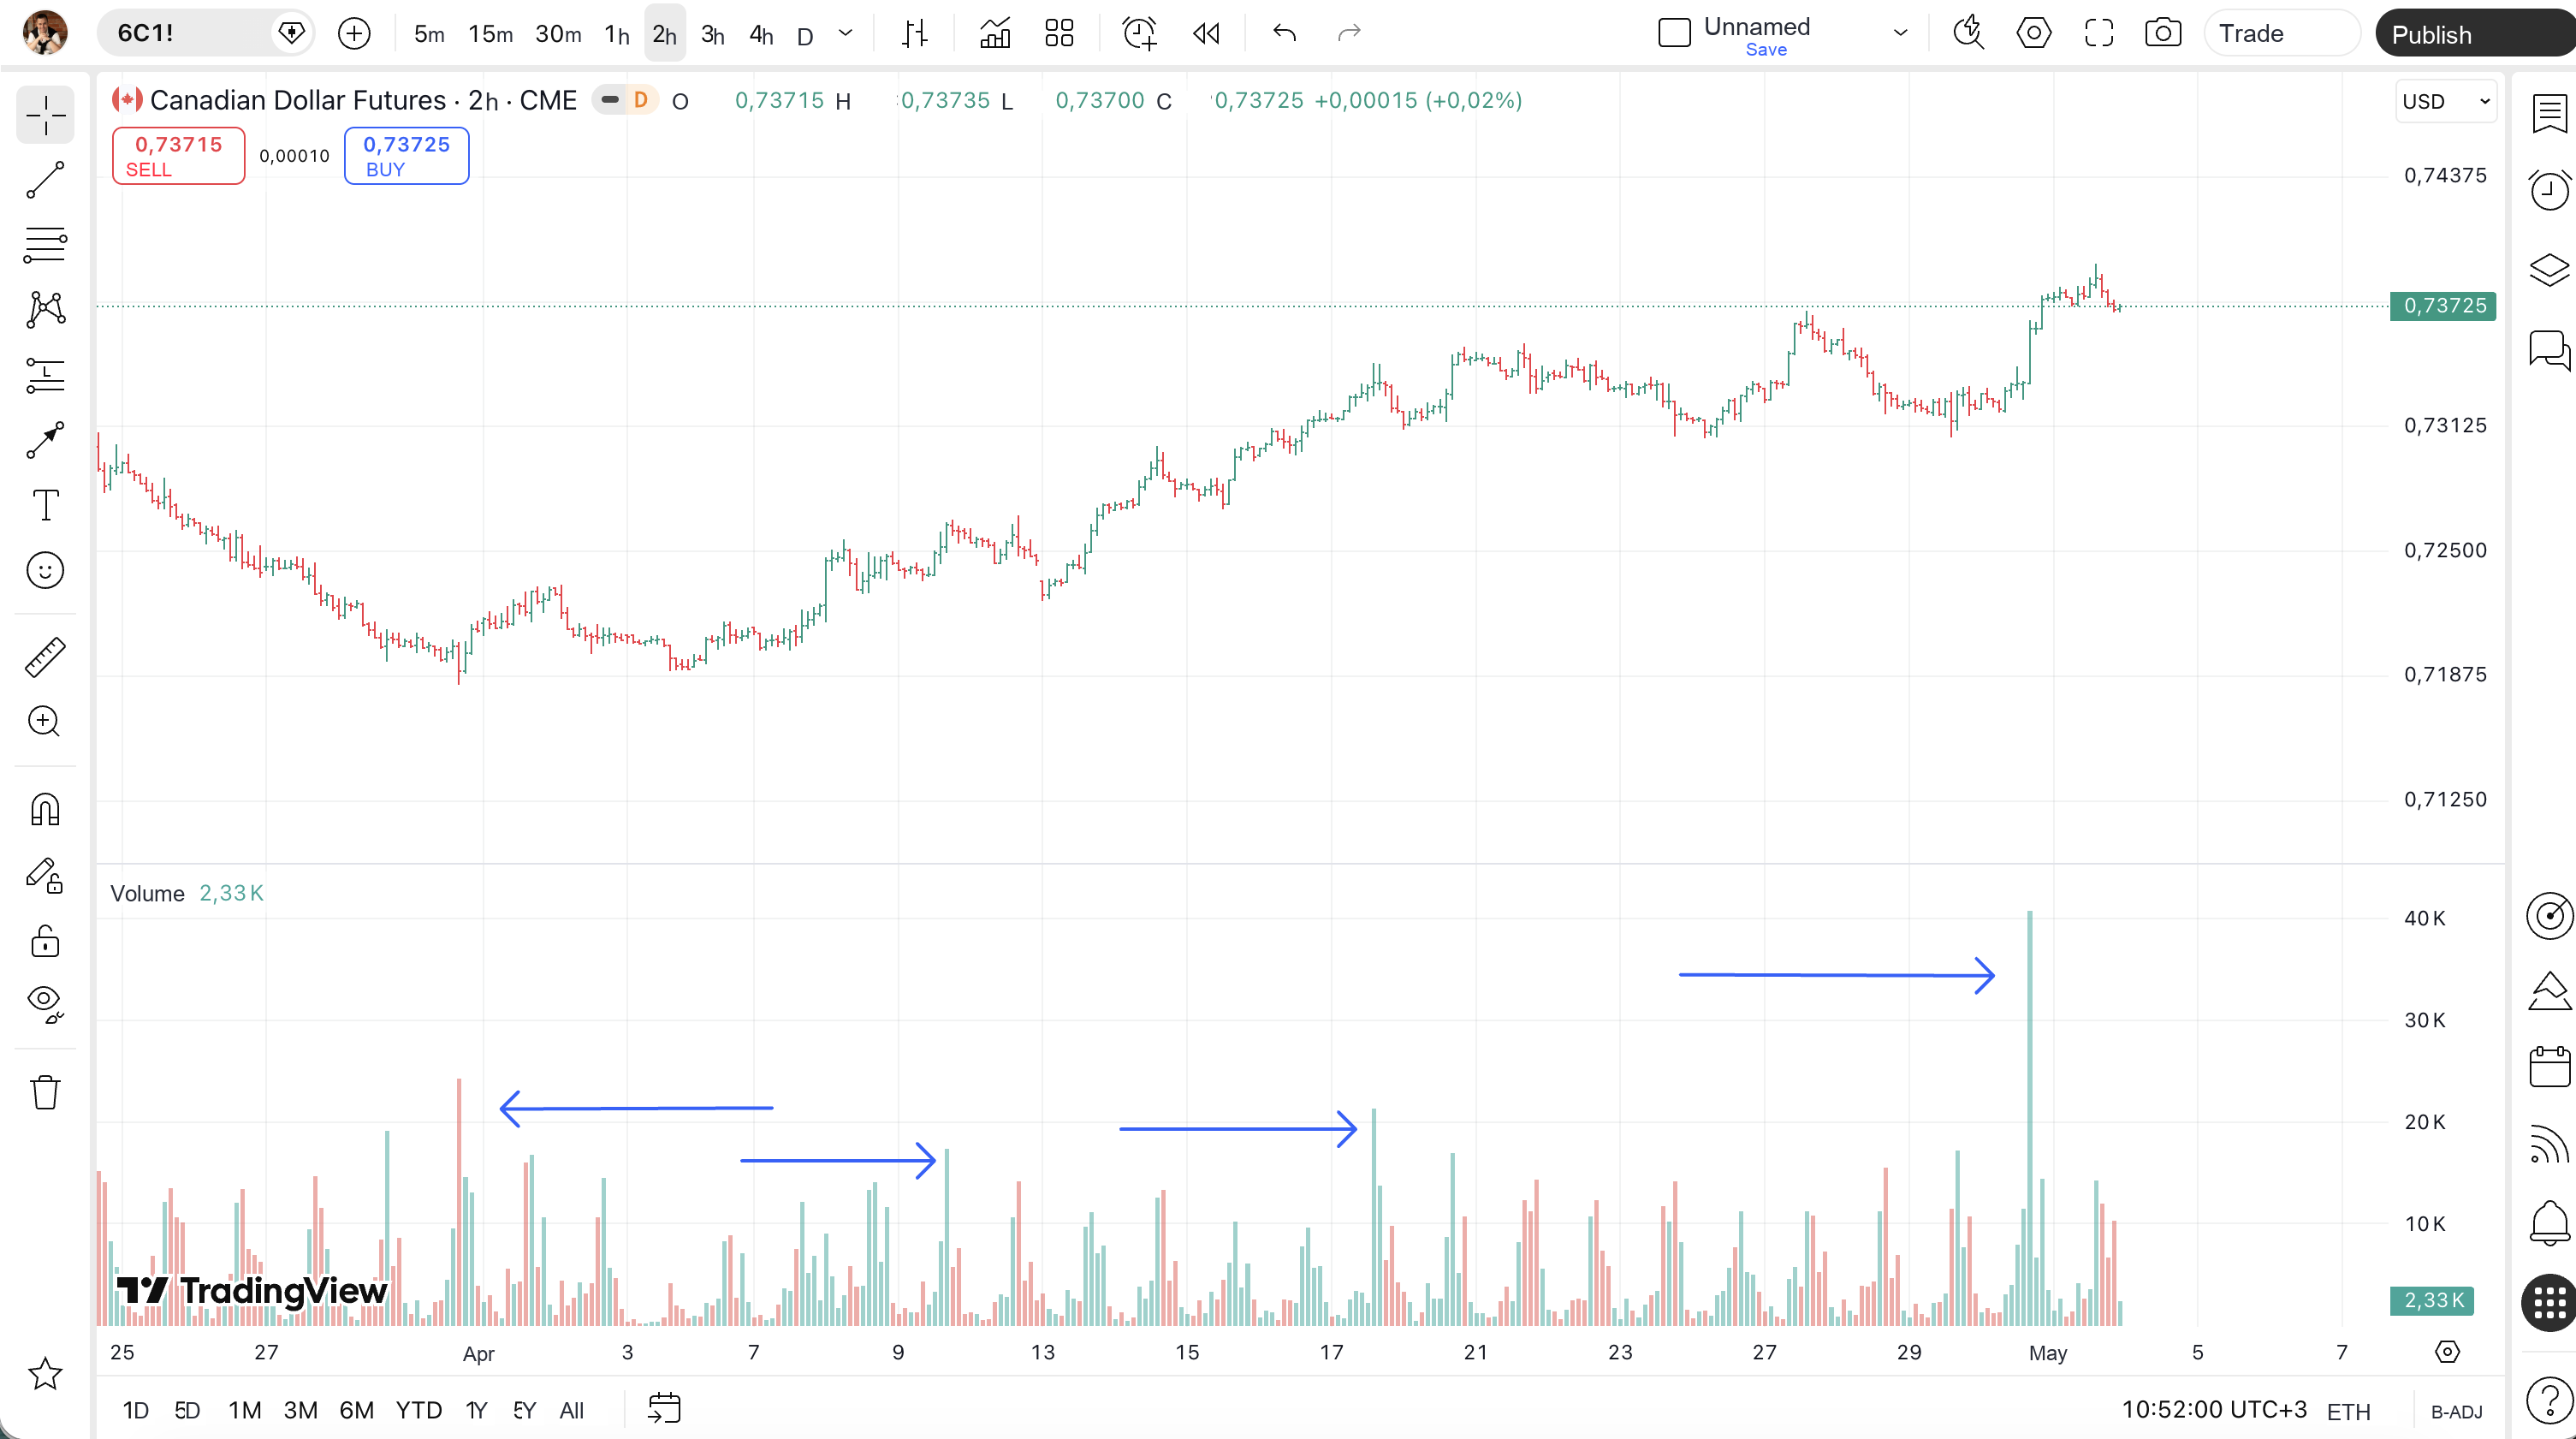
Volume analysis compares the number of units traded with price movement. Exchange-traded futures volume counts contracts, not transactions. For other data sources, check the units: tick volume counts quote updates.
I use volume alongside levels and price reactions to assess possible activity by large participants. Volume alone cannot identify them, reveal their intentions or predict their next move.
Key aspects of the analysis:
- Higher volume means more units were traded than during the comparison period. Check that the contract, venue, session and source have not changed. This value does not identify the participants.
- Lower volume means less trading activity in the same units over a comparable period. It does not prove that large participants are absent or promise a sharp move afterward.

Check your understanding
What does volume analysis compare?
Show answer
The number of units traded and the movement in price. For an exchange-traded future, volume shows the number of contracts in executed trades.
How does higher volume differ from lower volume?
Show answer
Higher volume means more units were traded during the period; lower volume means fewer. Compare the same units over comparable periods.
Working with levels: a liquidity shortage example
In this example, we examine price and volume at a level, then watch the reaction that follows. The chart does not directly show who placed the orders or what they intended.
We will examine a Euro futures example using CME Group data to see how the market reverses at a level after a false breakout.
Every sale needs a buyer and every purchase needs a seller. A large order can fill at different prices if available liquidity is limited. I therefore watch for unusually high activity near levels, without assuming that all large participants share the same view of value.
Limit orders can absorb incoming trades and slow a move, while triggered stops can add buy or sell orders. How they fill depends on the order type. A bar cannot identify every order owner or prove that stops were deliberately targeted. I wait for the price reaction: does the move continue beyond the level, or does price return to the range?
A false breakout is a move beyond a marked level followed by a return. It can involve stop activation, news or changes in available orders. The chart alone does not prove that someone deliberately moved price to trigger other people’s stops.
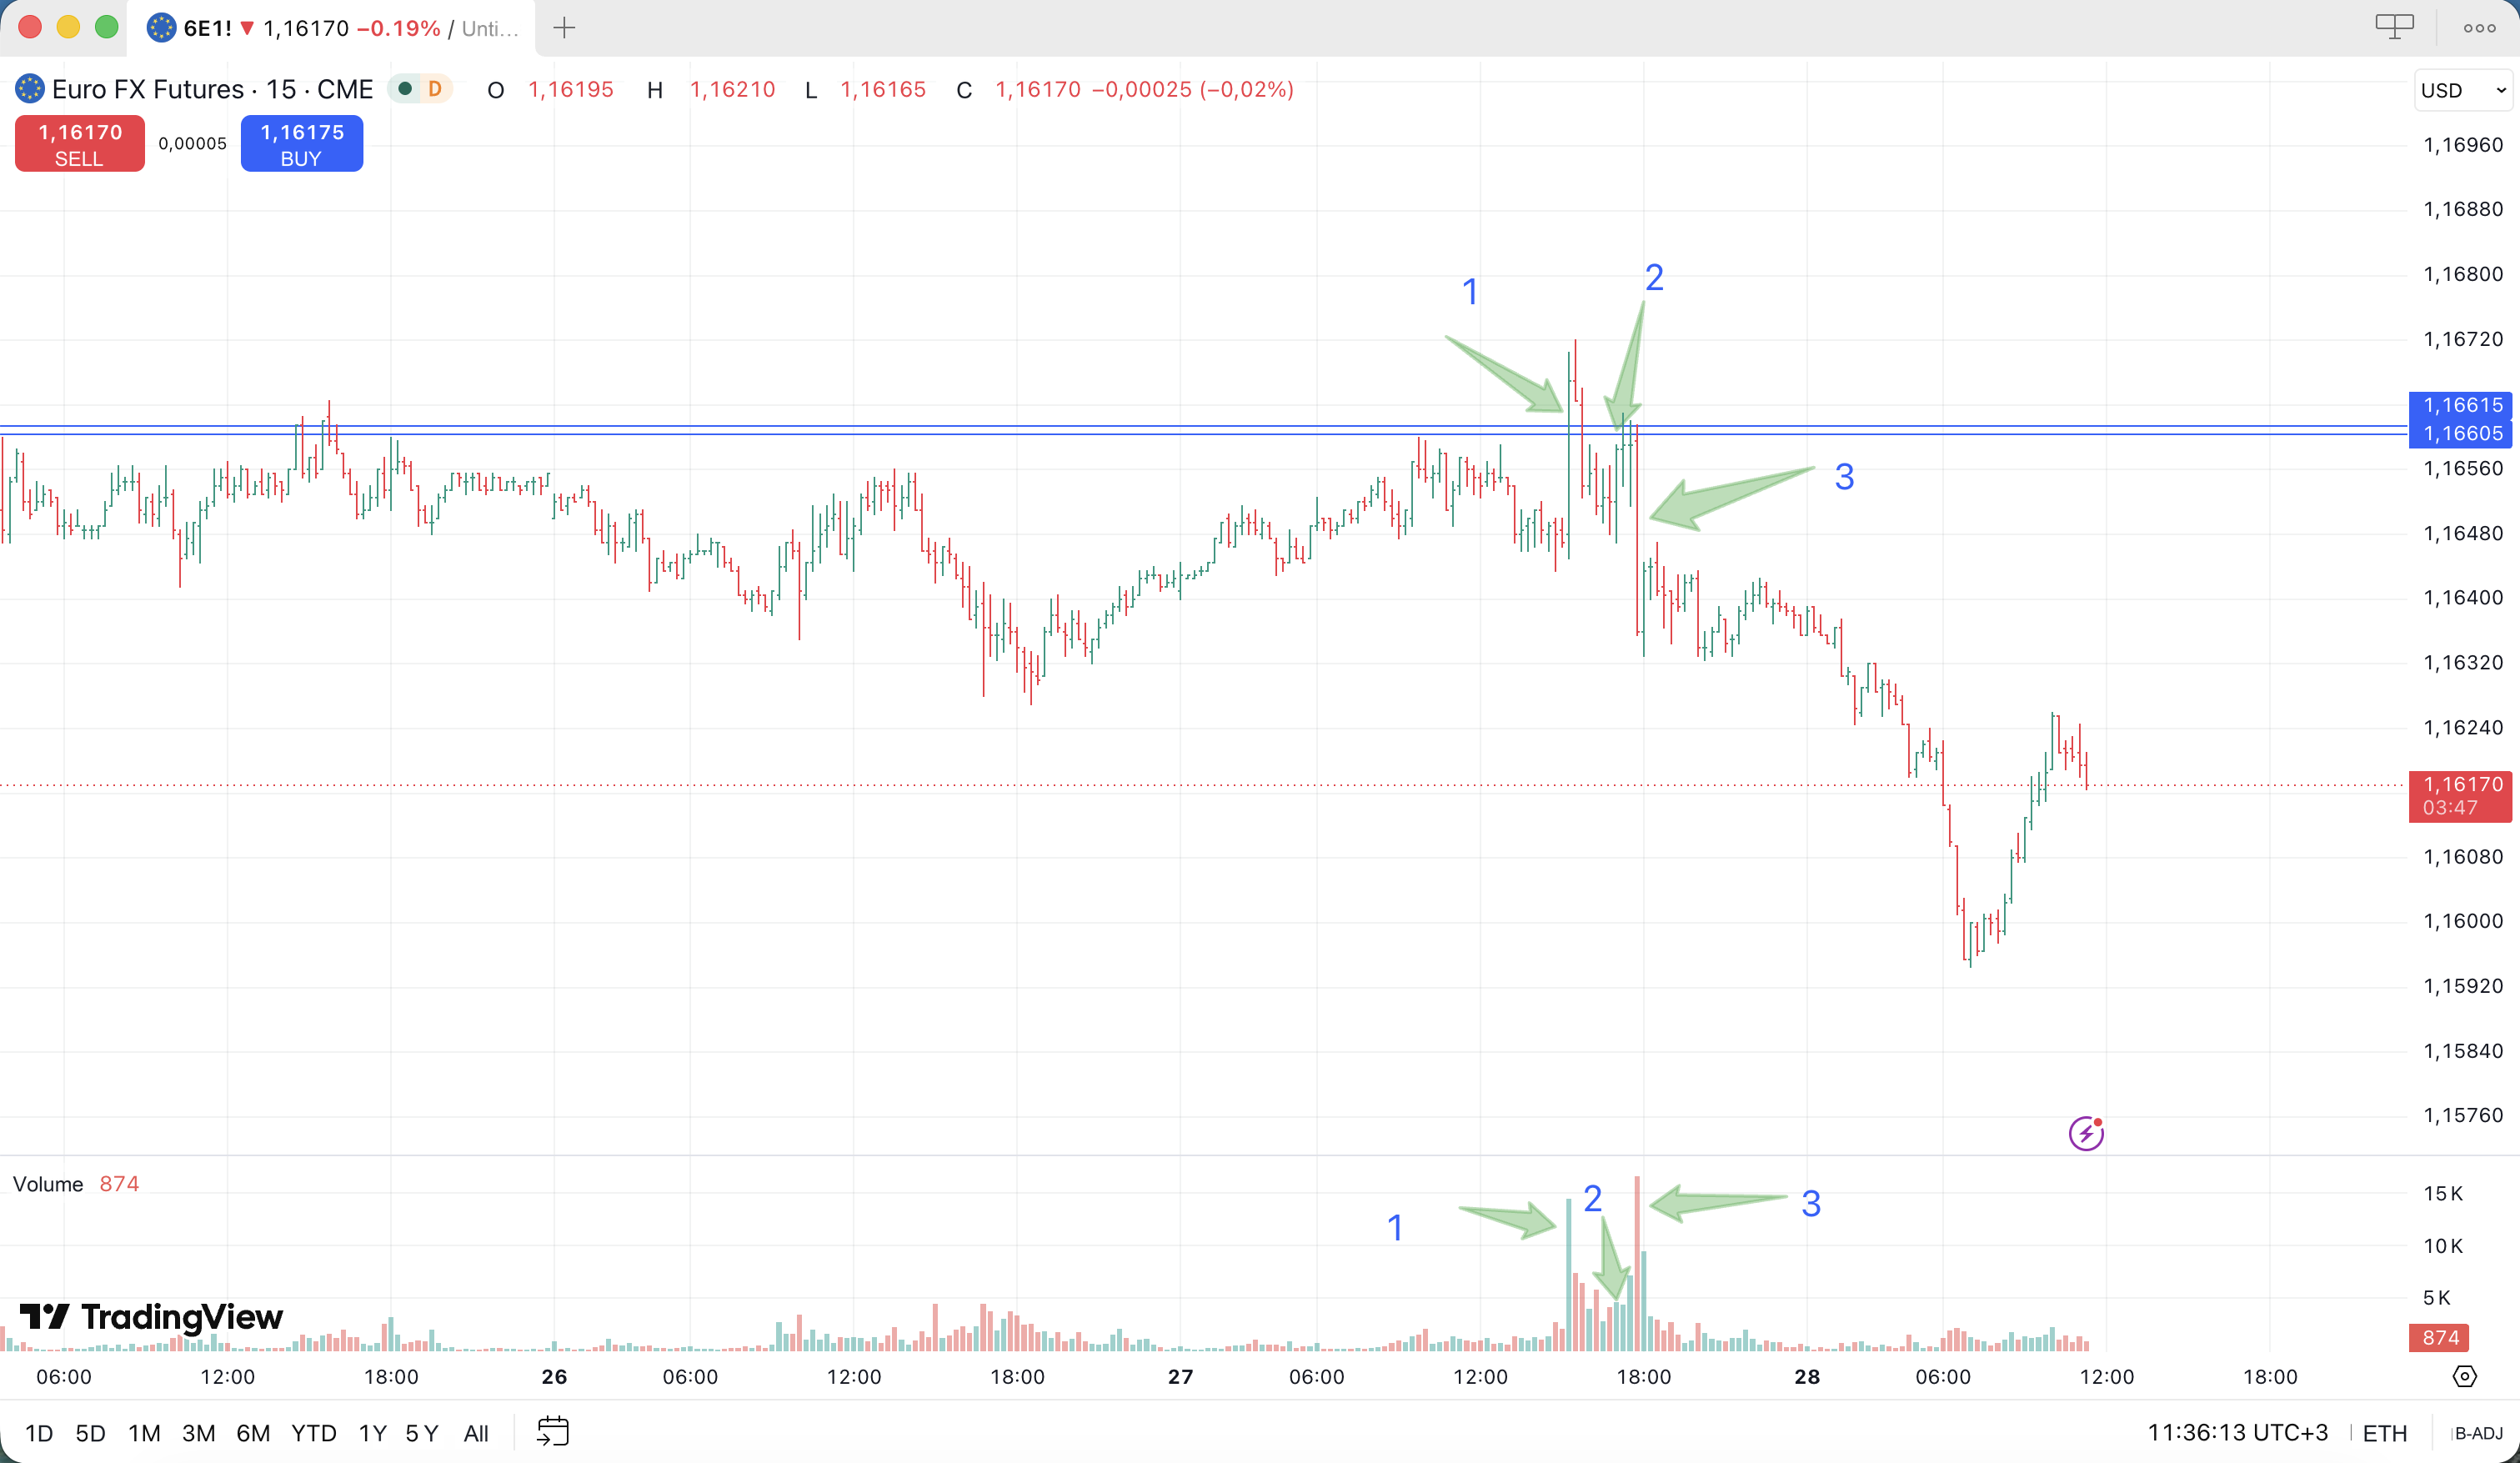
1. A wide up bar appears near the level. Triggered buy stops are one possible explanation for the movement and volume, but the chart does not confirm this. If high activity fails to lift price further, I assess whether selling is absorbing the buying, then wait for the next price reaction.
2. The following up bars have smaller ranges, roughly half the first bar’s range in the image. This shows a smaller price range; it does not identify the sellers or reveal the size of a hidden position.
3. A wide down bar then breaks below nearby support levels. This is consistent with aggressive selling relative to available buy orders, but the image does not identify the participants. Check whether the bearish structure remains intact after a pullback.
Here, structure changes at a level with high trading activity. I start at that area and examine liquidity alongside the impulse and pullback that follow. Inferring activity by large participants does not identify them. The “Market Liquidity” video explores this reasoning.
Check your understanding
What is a false breakout of a level?
Show answer
Price moves beyond a marked level and then returns.
How did movement near the level change in the example?
Show answer
A wide up bar appeared first, followed by up bars with smaller ranges. Then a wide down bar broke below nearby support levels.
The Wyckoff method
The Wyckoff method compares price and volume to analyze accumulation, distribution and directional movement. The Composite Operator models the activity of large market participants; it does not prove that one side controls the entire market. “Volume Analysis Strategy” helps relate these concepts to a chart.
Smart Money is an interpretation of the behavior of large market participants, not a prediction of where price must go next.
In Wyckoff analysis, the subsequent price reaction helps test an accumulation or distribution hypothesis. See the chart study in “The Wyckoff Method.”
Check your understanding
What does the Wyckoff method analyze?
Show answer
It compares price and volume to analyze accumulation, distribution and directional movement.
What does the Composite Operator mean in the Wyckoff method?
Show answer
It is a model of the activity of large market participants, not proof that one side controls the entire market.
Effort versus result in the Wyckoff method
Effort versus result compares trading activity with the price movement it produces. Volume measures the units traded; the price range, close and subsequent movement show the result.

Compare volume with price movement. Does higher activity move price farther, or does price make little progress?
This relationship can be used to analyze:
- Trend strength.
- The distance covered by each price wave.
- The behavior of individual bars.
When high volume produces little price movement, I consider whether opposing orders are absorbing the activity. When higher volume accompanies a larger move, I assess the progress achieved. Neither observation identifies the participants or reveals the size of their hidden positions.
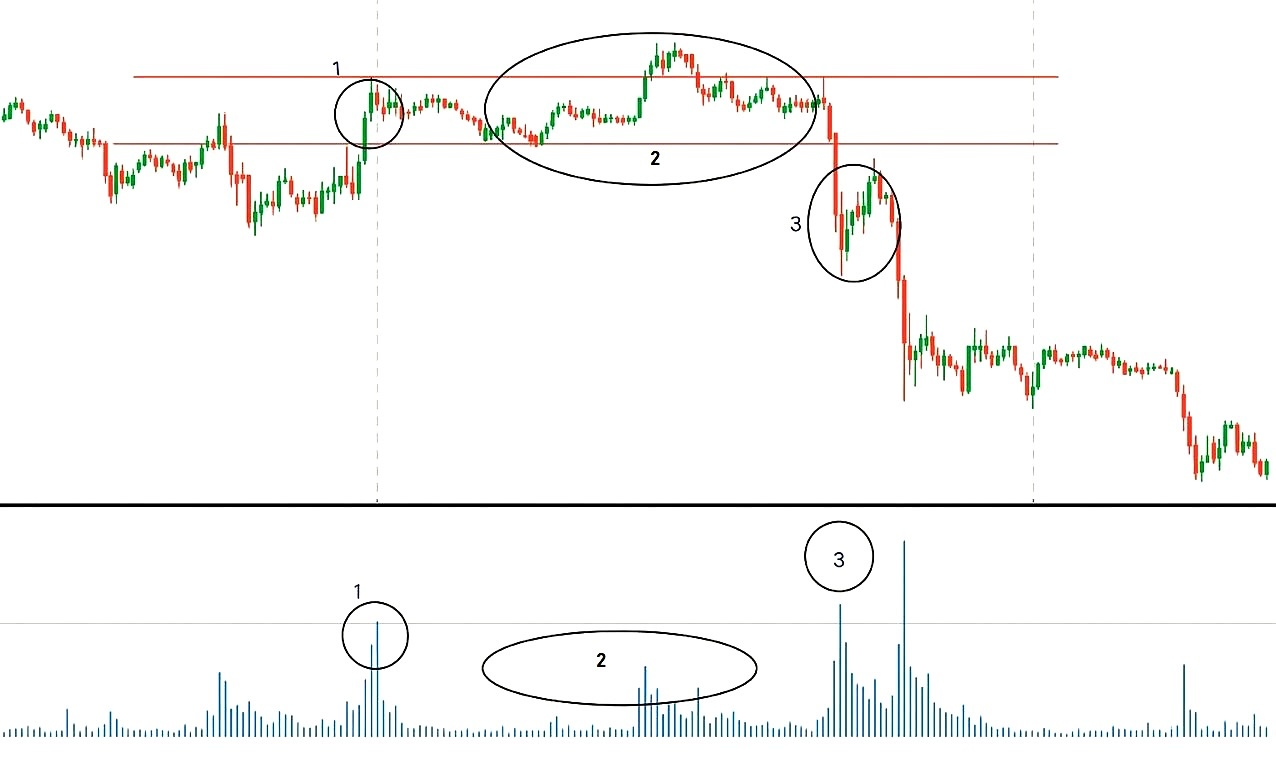
The GC gold futures chart shows how I compare volume with price movement. It illustrates the analysis sequence, rather than a promised trading result.
Zone 1: price rallies on high volume, then stalls and forms a range. We compare effort with the subsequent result, not just one bar. This is a reason to test the possibility that selling pressure is absorbing the buying; total volume cannot establish that there were more sellers than buyers.
In Wyckoff analysis, a rally that stalls on high volume can suggest supply; a selloff that stalls can suggest demand. Check the context and what happens next: a single high-volume bar does not establish professional buying or selling.
Zone 2: price fails to hold above the first bar’s area and returns to the range. This failed move is called a false breakout. Resistance then forms, followed by new lows. It does not establish that a particular participant lost interest.
Zone 3: a downward impulse begins, with new lower highs and lows. In my plan, this is a reason to look for a short entry on a pullback after checking the level and risk. Not every decline leaves enough room to the target.
This sequence shows the method in use: a stall, a failed breakout, then new structure. We test the distribution hypothesis through these events, not through claims about unknown participants’ intentions.
Effort versus result helps form a hypothesis. We check the entry condition separately through the impulse, pullback and reaction at the level.
Check your understanding
What does “effort” mean, and how do you assess the result?
Show answer
Volume represents the trading activity, or effort. Assess the result using the price range, close and the movement that follows.
How do you assess price movement alongside high volume?
Show answer
High volume with little price movement can suggest that opposing orders are absorbing the activity. When higher volume accompanies a larger move, assess the price progress achieved.
How to identify a trade entry
In the course’s system, I wait for a pullback after an impulse and check for continuation in the direction of the new structure.
A pullback can occur for several reasons, including traders closing positions. A breakout can trigger stops, whose fills depend on order type and available liquidity. The chart cannot establish that profit-taking by one group was the sole cause of a pullback.

Price may move without returning to the chosen area, especially after new information. Then the pullback-entry condition is not met. The two images show different sequences; do not force the current chart to match your preferred example.
Returning to the gold chart, we will examine wave 3.
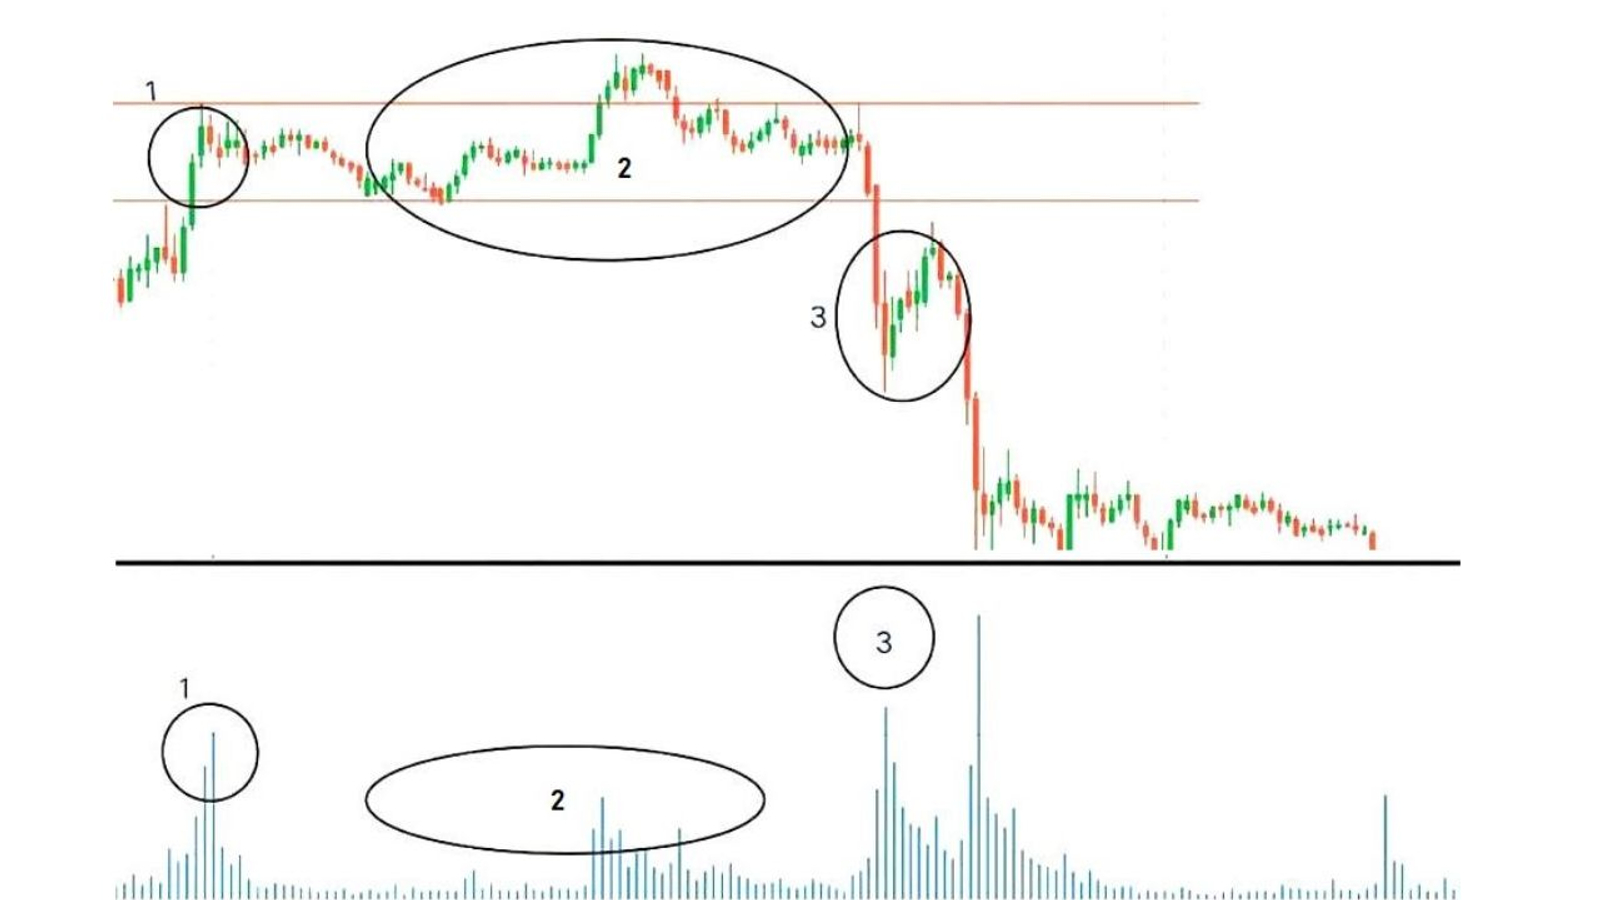
Wave 3 on the gold chart shows a wide down bar on high volume. The move lower expands, but total volume does not tell us how much came from stops or who was selling. Next, we look for a pullback to the broken level.
Without a pullback, there may be no planned entry. I do not chase movement simply because the earlier breakout looked strong.
A new downward impulse while price stays below the broken level supports the short setup. If price returns above it, reassess the setup. Neither outcome makes the next move certain.
In zone 3, price breaks below the range. The pullback stays below the former lower boundary and has less volume than the preceding downward impulse. Price then resumes its decline. I use that pullback and continuation to assess a short entry.
Once the entry criteria are clear, set the protective exit and calculate position size from your maximum acceptable loss.
Check your understanding
What sequence is checked before entry in the course’s system?
Show answer
After an impulse, wait for a pullback and check for continuation in the direction of the new structure.
What supports a short setup after a pullback to a broken level?
Show answer
Price stays below the level and begins a new downward impulse. A return above the level calls for reassessment.
Trading psychology
Stick to the risk limit you set before the trade. Increasing position size or canceling a stop in an emotional reaction can lead to a larger loss than planned. Trading psychology explains why such decisions arise.
Risk management defines the maximum acceptable loss before entry. Experience does not make a large risk safe: size the position for the stop distance, account capital and the possibility of consecutive losses.
The amount you fund your account with and your risk per trade must always meet two criteria:
- They must feel comfortable at your current level of experience.
- They must not threaten your financial security.
Check your understanding
Which emotional actions can increase a loss beyond the plan?
Show answer
Increasing position size or canceling a protective stop.
Which two criteria should account funding and risk per trade meet?
Show answer
They should feel comfortable at your current stage and not threaten your financial security.
How to size a position for your risk
For a long position, place the stop below the swing low whose break would invalidate the setup; for a short position, place it above the corresponding swing high. Use that distance to calculate position size, rather than choosing the size first. Costs and actual fill prices can make the realized loss differ from the plan.

Before calculating, check the point value, the currency used for profit and loss, and the allowed trade-size increment. Use the specifications for this product. Practice the calculation and order entry on a demo account rather than assuming another market’s specifications apply.
For the calculation, we use a hypothetical contract: a one-point price change is worth $10 per contract. A tick is the instrument’s minimum price increment; take its size and monetary value from the specifications.
Inputs:
- Capital: $35,000.
- Acceptable risk: 1% of capital.
- Distance to stop: 150 points.
- Value of one point: $10 per contract.
 Capital: $35,000.
 Acceptable risk: 1% of capital.
 Distance to stop: 150 points.
 Value of one point: $10 per contract.
Choose the risk percentage with possible losing streaks, total account exposure and account size in mind. The 1% in this exercise is an input, not a universally safe limit or a rule followed by all professionals.
Position-size formula:
Position size = (Capital × Risk percentage × 0.01) / (Stop distance in points × Point value).
Theoretical size = (35,000 × 1 × 0.01) / (150 × 10) = 350 / 1,500 ≈ 0.233 contracts. The unit is contracts because point value is specified for one contract.
Check the permitted trade-size increment:
If the exchange permits only whole contracts, rounding down gives 0 contracts. One contract with this stop has planned risk of 150 × 10 = $1,500, exceeding the $350 limit. We do not open this trade.
Consider a smaller contract or another instrument only after checking its own point value and trade-size increment. Do not arbitrarily tighten the stop to reach your preferred position size. Even a permitted size does not guarantee the exact loss: costs and slippage can increase it.

Check your understanding
How do you calculate position size for a chosen risk?
Show answer
Position size = acceptable monetary loss / (stop distance × point value for one contract). In the example, 350 / 1,500 ≈ 0.233 contracts.
What size is permitted in this example if only whole contracts can be traded?
Show answer
Rounding down gives 0 contracts, so the trade is not opened. One contract risks $1,500, exceeding the $350 limit.
Fear and greed in trading
I use fear and greed to explain some crowd behavior, such as chasing a fast move or refusing to close a losing trade. They do not explain every price change. The practical lesson is to stick to the risk limit set before entry.
In this course, we treat trading as work governed by rules. A practice trade tests a condition; it is not entertainment. Profit remains the goal, but discipline alone cannot promise it.
Check your understanding
Which actions does this chapter associate with fear and greed?
Show answer
Chasing a fast move and refusing to close a losing trade.
What practical task does the chapter on fear and greed set?
Show answer
Stick to the risk limit set before entry. Use practice trades to test your rules, rather than trade for entertainment.
Cognitive biases in trading
Cognitive biases are persistent errors in evaluating information. The disposition effect appears when a trader quickly closes a winner to lock in the feeling of success but holds a loser to avoid admitting a mistake. Check your journal for protective orders canceled before execution or profitable trades closed before their exit rules were met.

Overconfidence can lead to excessive trading and underestimated losses. Check your journal for more entries without valid setups and for the effect of additional costs. The illusion of control arises when confidence in a tool or a familiar chart pattern is mistaken for certainty about future prices.
Confirmation bias means seeking only evidence that supports your position. Also write down what would invalidate your setup before entering. Anchoring ties a decision to the entry price instead of new information.

Herd behavior encourages traders to mistake popularity for evidence. Check whether your own entry rule is met, rather than count how many people agree.

Check your understanding
How does the disposition effect appear?
Show answer
A trader quickly closes a winner to lock in the feeling of success but holds a loser to avoid admitting a mistake.
How does confirmation bias differ from anchoring?
Show answer
With confirmation bias, you seek only evidence supporting your position. With anchoring, you tie the decision to the entry price instead of new information.
How to reduce the influence of cognitive biases
Written rules make decisions less dependent on mood. Setting a stop before entry helps you follow the plan, but it can still be canceled and does not ensure an exact fill. Check the journal for stops moved farther from entry in a way that increases the planned loss.
Record the profit or loss, your entry rationale and your state of mind at the time. Reviewing these records reveals recurring rule violations. Automated execution can reduce emotional decisions during order placement, but cannot repair poor rules or eliminate operational failures.

For a review of cognitive-bias research and mechanisms, see “Psychology of Investment Decisions: Cognitive Biases of Retail Traders in Financial Markets,” coauthored with Professor Inna Sytnyk (Investytsii: praktyka ta dosvid, issue 4, 2026).
Check your understanding
How do written rules help reduce emotional influence on decisions?
Show answer
They leave less room for decisions driven by mood. A stop set before entry helps you follow the plan.
What should you record in the journal to review recurring violations?
Show answer
The profit or loss, your entry rationale and your state of mind at the time. Also check for stops moved farther from entry in a way that increases the planned loss.
Indicators in trading
An indicator calculates and displays information from selected data. Understand its formula, period and signal criteria, rather than judge it by the color of a line or arrow.
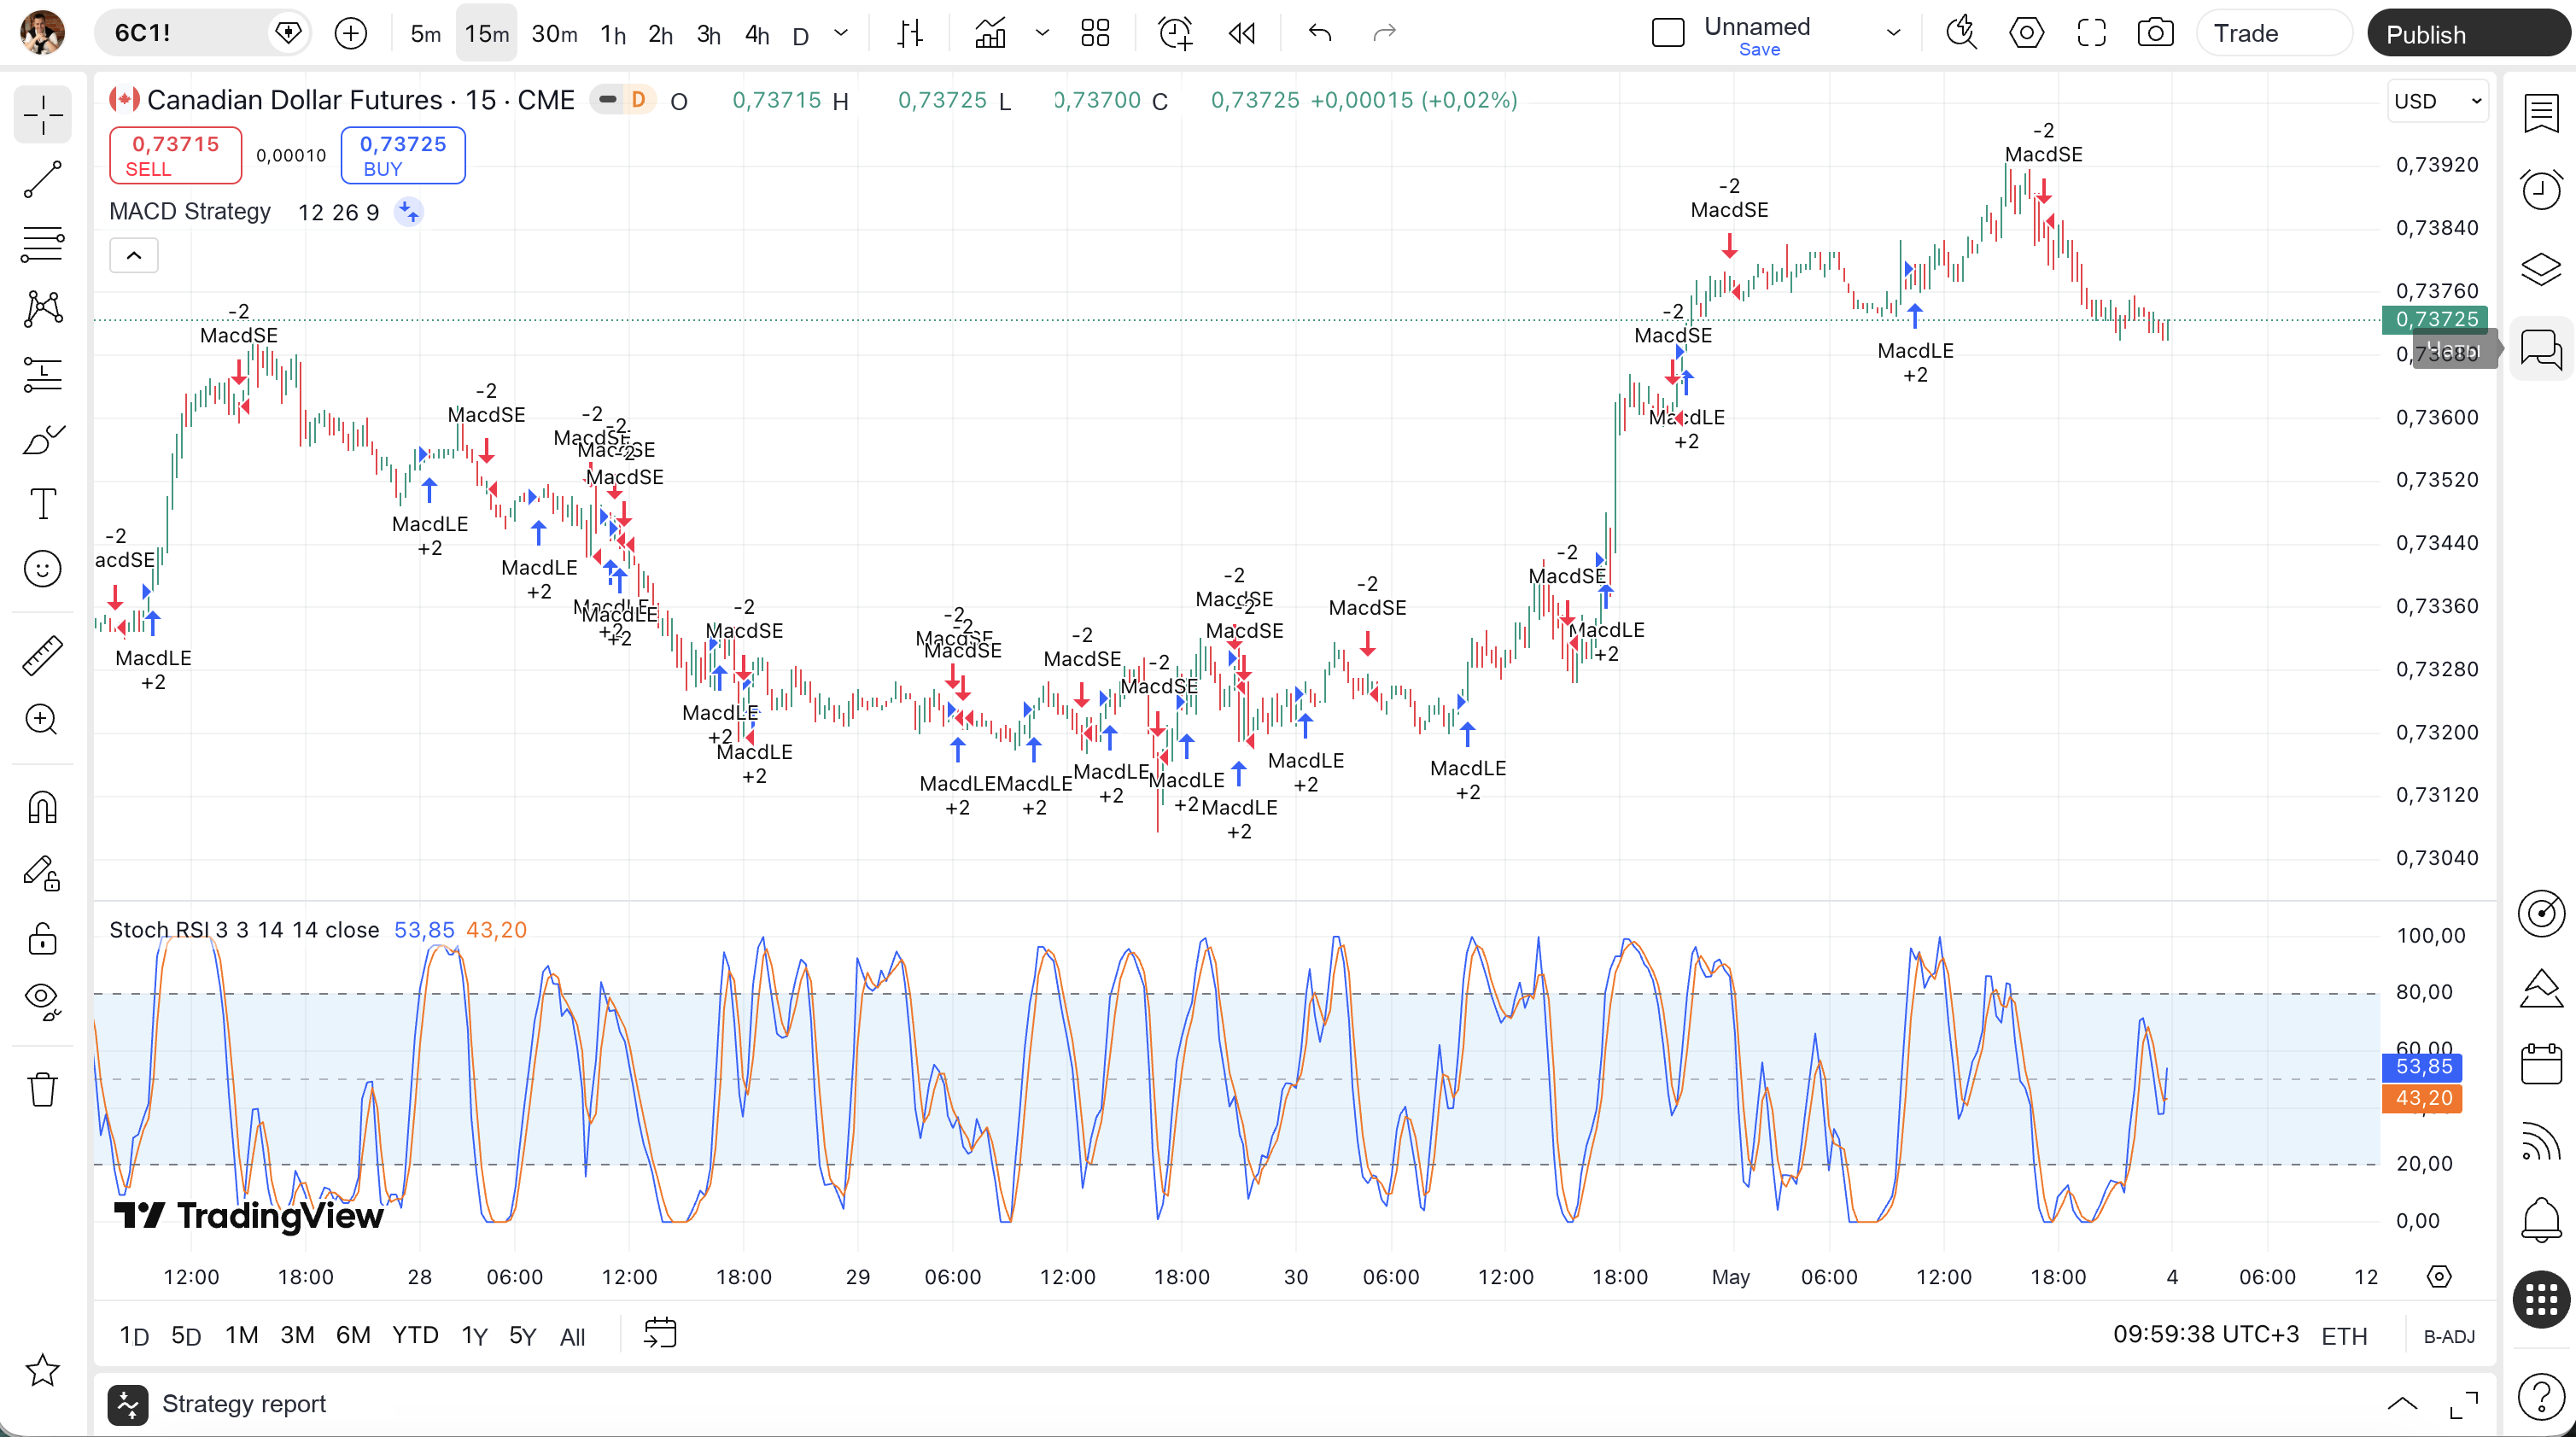
After a losing trade, check whether you followed the rules and review the market conditions. Changing indicators after every loss prevents a fair comparison of one system across a series of trades.
I spent several years searching for an indicator to predict the market. In this course, I explain why indicators play a supporting role for me: I check structure, volume and price reaction first.
Searching for a “holy grail,” a method that always predicts the market, distracts from testing specific rules. Indicators, martingale and scalping do not remove the need to limit risk and assess results. In my teaching sequence, we first define what must happen before entering and what would invalidate the setup, then assess a series of trades.
Averaging price data can make an indicator lag, but not all indicators work alike. Compare the calculation, period and data source; an indicator’s name tells you nothing about how accurately it can predict price.
Define the signal so it can be observed: which line crossed which, and on which bar? This lets you compare the same event across trades without rewriting the explanation after the outcome.
Keep an indicator only if you can state what it adds to your reading of structure, the PCL and volume.
Check your understanding
What does a trading indicator display?
Show answer
A calculation based on selected data. To use it, understand the formula, period and signal conditions.
What role does the author give indicators in his system?
Show answer
A supporting role: he checks structure, volume and price reaction first. He keeps an indicator if its contribution to the analysis is clear.
Fundamental analysis in trading
Fundamental analysis examines the economic and business factors that affect an asset’s value. For currencies, these may include interest rates and inflation; for a company, income and liabilities. Distinguish the data itself from participants’ expectations.
Read news in the context of the reported data and market expectations. Beginners do not need a detailed macroeconomic model, but should consider the timing of major events when assessing execution and risk.
COT reports can provide additional context: they show aggregate open positions by participant category as of a particular reporting date and are published afterward. They do not reveal every fund’s current plan or establish that hedgers are always right.
I suggest beginners learn charts and volume first so they can apply the course rules consistently. This is a teaching order, not a claim that price already fully reflects all future news. New information can change the market.
The market reacts to both the reported figure and how it compares with expectations. The same announcement can therefore produce different market reactions.
Separate the news from the trading decision: an event announcement does not determine your entry, position size or stop.

Check your understanding
What does fundamental analysis study?
Show answer
The economic and business factors that affect an asset’s value. These may include interest rates and inflation for currencies, and income and liabilities for a company.
Why can the same news produce different market reactions?
Show answer
The market reacts to both the reported figure and how it compares with expectations.
Building a trading system
Real-chart example: Euro futures
On this Euro futures chart, we will examine volume, the price reaction and the change in structure around the PCL. The contract is quoted in dollars per euro, but its terms and execution differ from a retail Forex pair. The numbers identify the steps in the analysis. This example uses a 15-minute chart; test the rules separately before switching to a different timeframe.
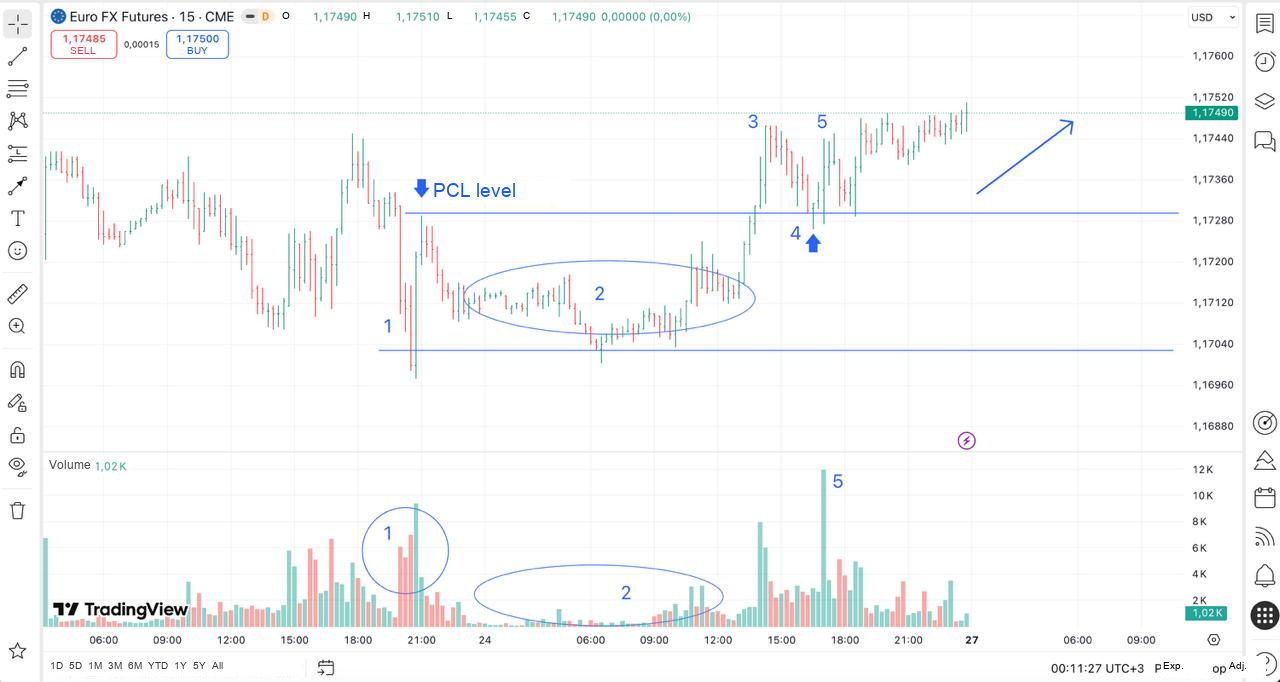
1. A wide down bar on the Euro chart is accompanied by high volume; afterward, price stops making new lows. In Wyckoff terms, I consider this a possible beginning of accumulation. The chart shows that the decline stalled, but it does not identify the buyers behind that activity.
2. A range forms. Another attempt to move lower fails to break the previous low, and volume decreases during that move. This adds support to my accumulation hypothesis, which I then test against the eventual breakout from the range.
3. Price breaks the marked resistance. We now have an observable structural change, not just an accumulation hypothesis. The breakout alone does not replace checking the pullback and subsequent movement.
4. Pullback 3–4 returns to the broken resistance and briefly moves below it. Point 4’s low is above the low of range 2; a bullish pin bar forms there. I plan the stop below point 4’s low. After the pullback, I check for price returning above the PCL and continuing at point 5.
5. Price moves higher after the pullback, accompanied by increased volume. The sequence 1–5 supports planning a long trade if the course criteria are met, the target leaves enough room and position size fits the risk limit. It does not guarantee that the rally will continue.
Once the new structure forms, this approach looks for trades with the trend from support, as shown in the diagrams.
Real-chart example: Japanese yen futures
This example shows Japanese yen futures. Check the symbol and quote unit: CME yen futures express the yen’s value in dollars, whereas USD/JPY expresses the dollar’s value in yen. Do not treat their quote directions as identical. We will read the contract shown and the sequence of areas 1–5.
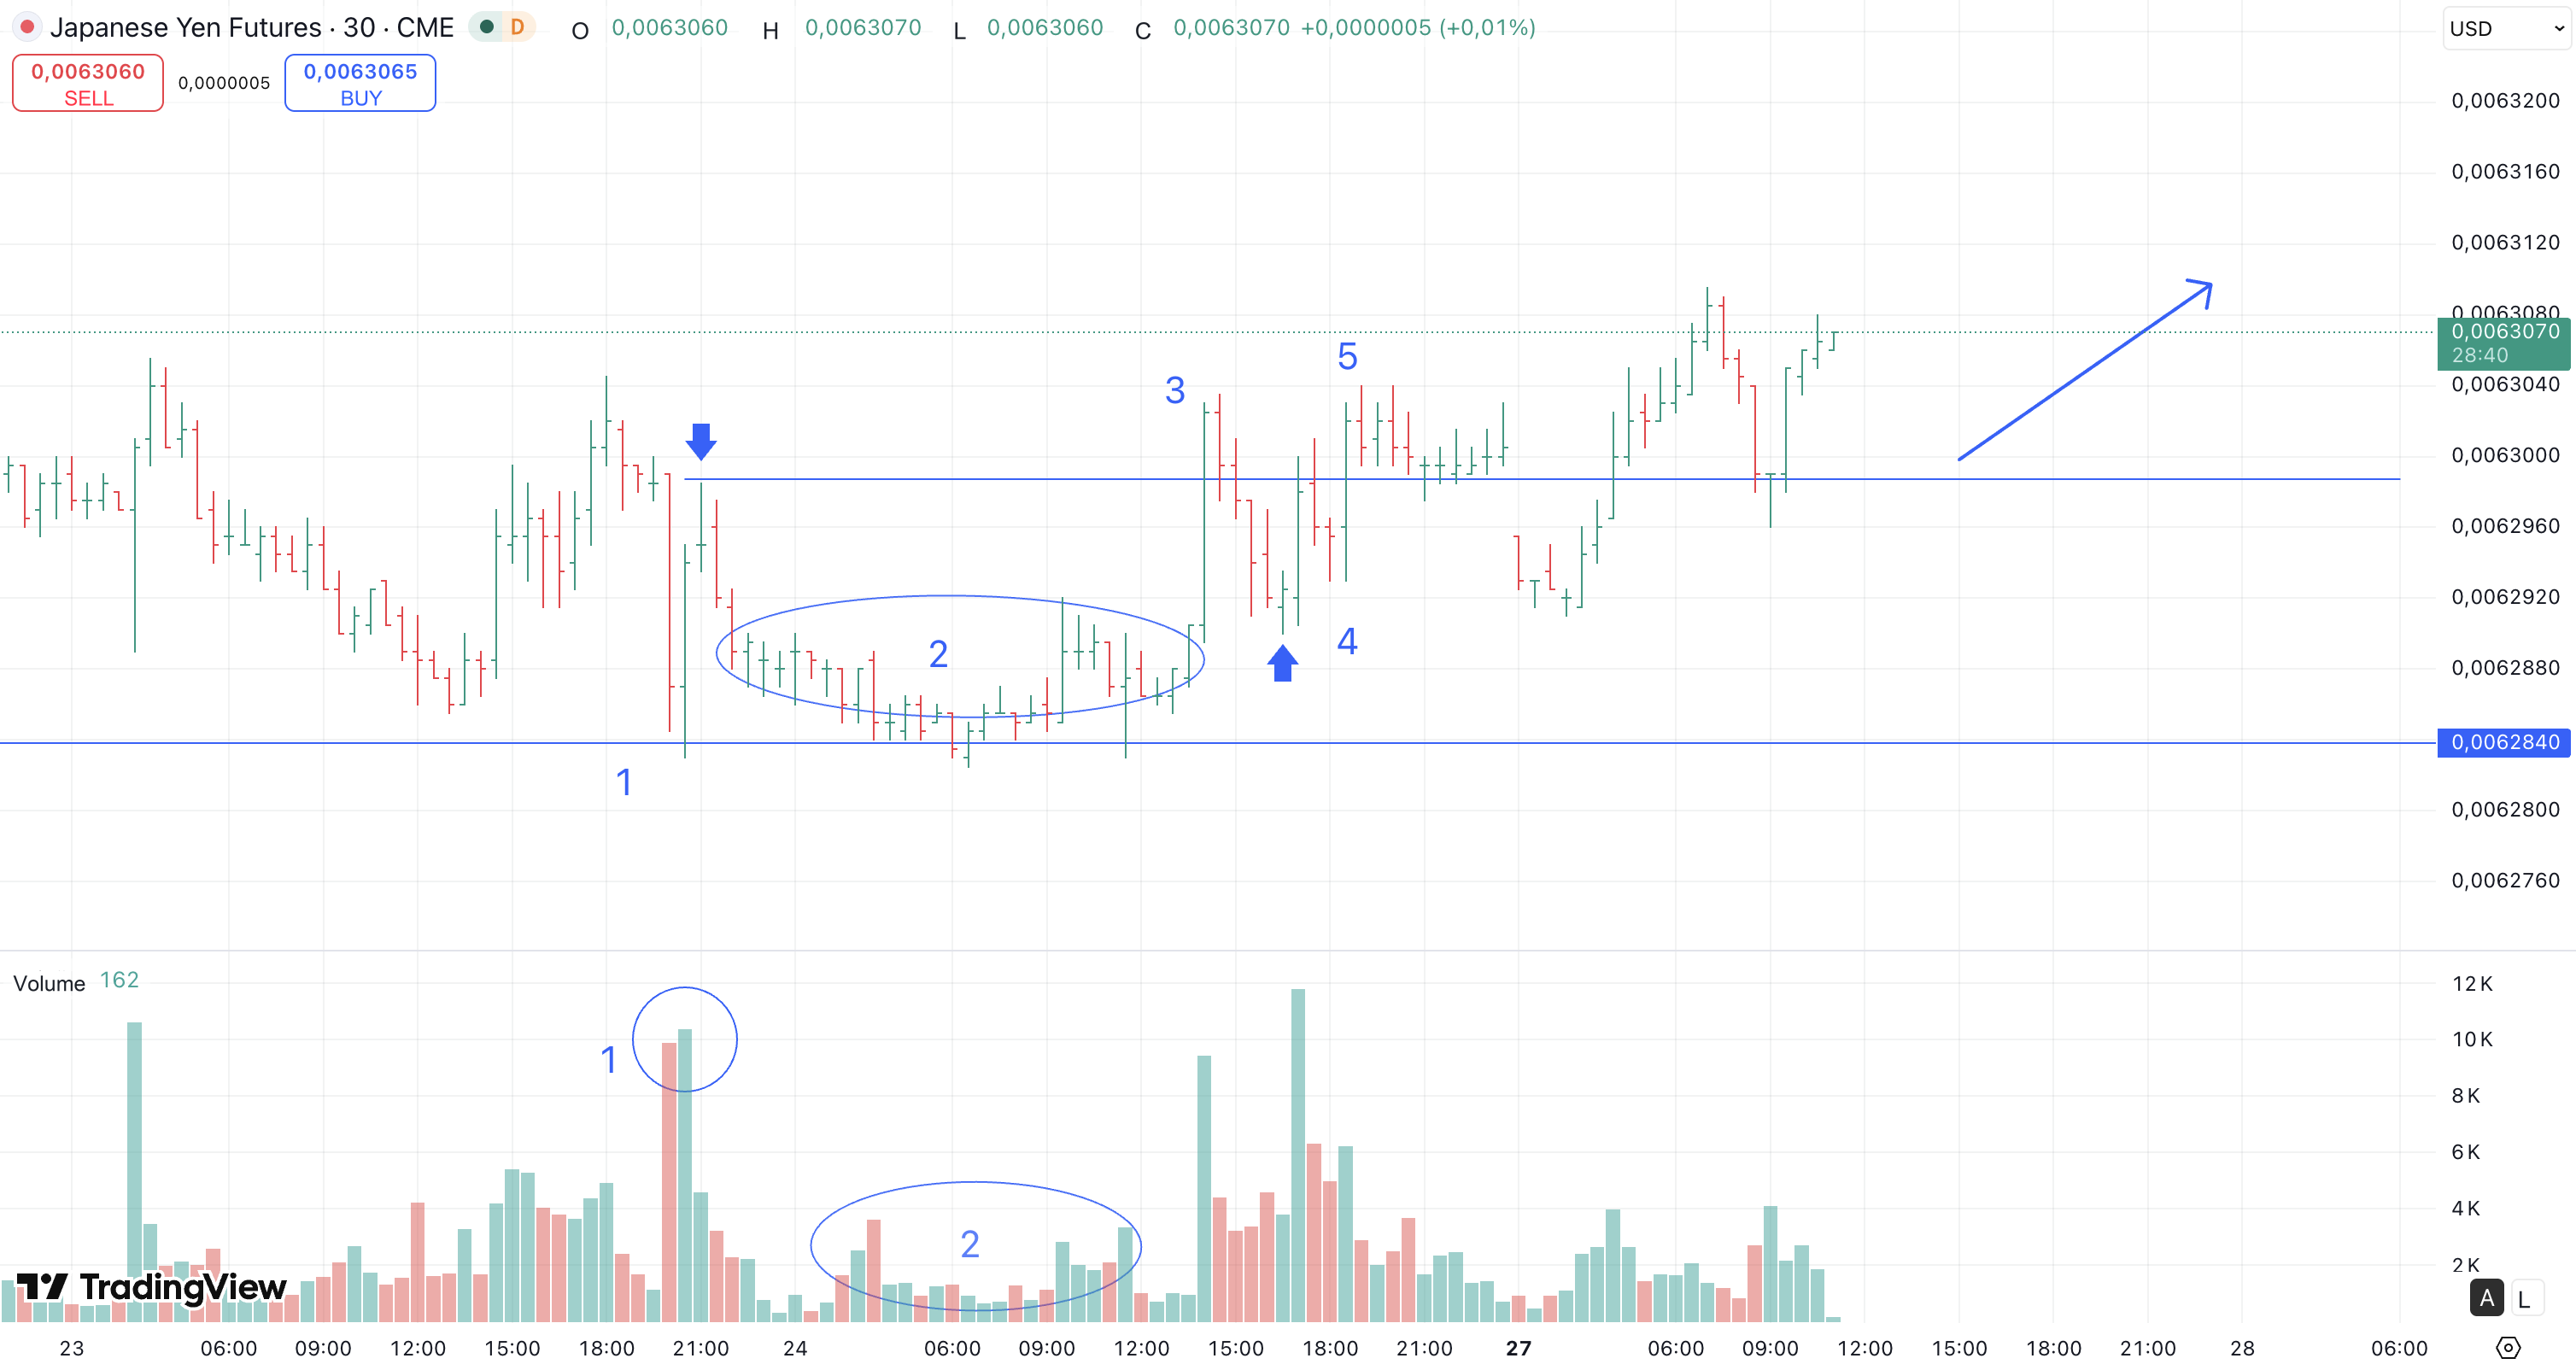
1. At point 1, a sharp decline on high volume stalls; range 2 then forms. I consider a possible selling climax, but accumulation needs confirmation from later events.
2. A range forms, and the next attempt to move lower weakens. This gives us another observation after the first event; lower volume alone does not imply that price will rally.
3. Price moves above the marked resistance. In my plan, I then wait for a pullback and level test, wave 3–4. Without a pullback, this entry may not develop.
4. Pullback 3–4 returns below the broken resistance. Point 4’s low remains above the low of range 2. I plan a stop below low 4, then check for a return above the PCL and a renewed rally at point 5.
5. Price moves higher again on increased volume. Before entry, I check the distance to the target, position size and costs.
The same sequence appears on another contract. If any required stage from 1–5 is missing, this model gives no entry. The sequence defines conditions we can test, rather than guaranteeing a result.
In this course, we begin by following the direction indicated by market structure. I treat trading within a range and Price Action, meaning the interpretation of price behavior, as later topics once the basic sequence is understood.
Real-chart example: distribution in Euro futures
The previous Euro futures example examined accumulation. On another chart segment, we will check distribution and the transition from upward to downward structure. Numbers 1–5 mark the observation sequence. The data belongs to this contract and chart interval, not to all EUR/USD trades.
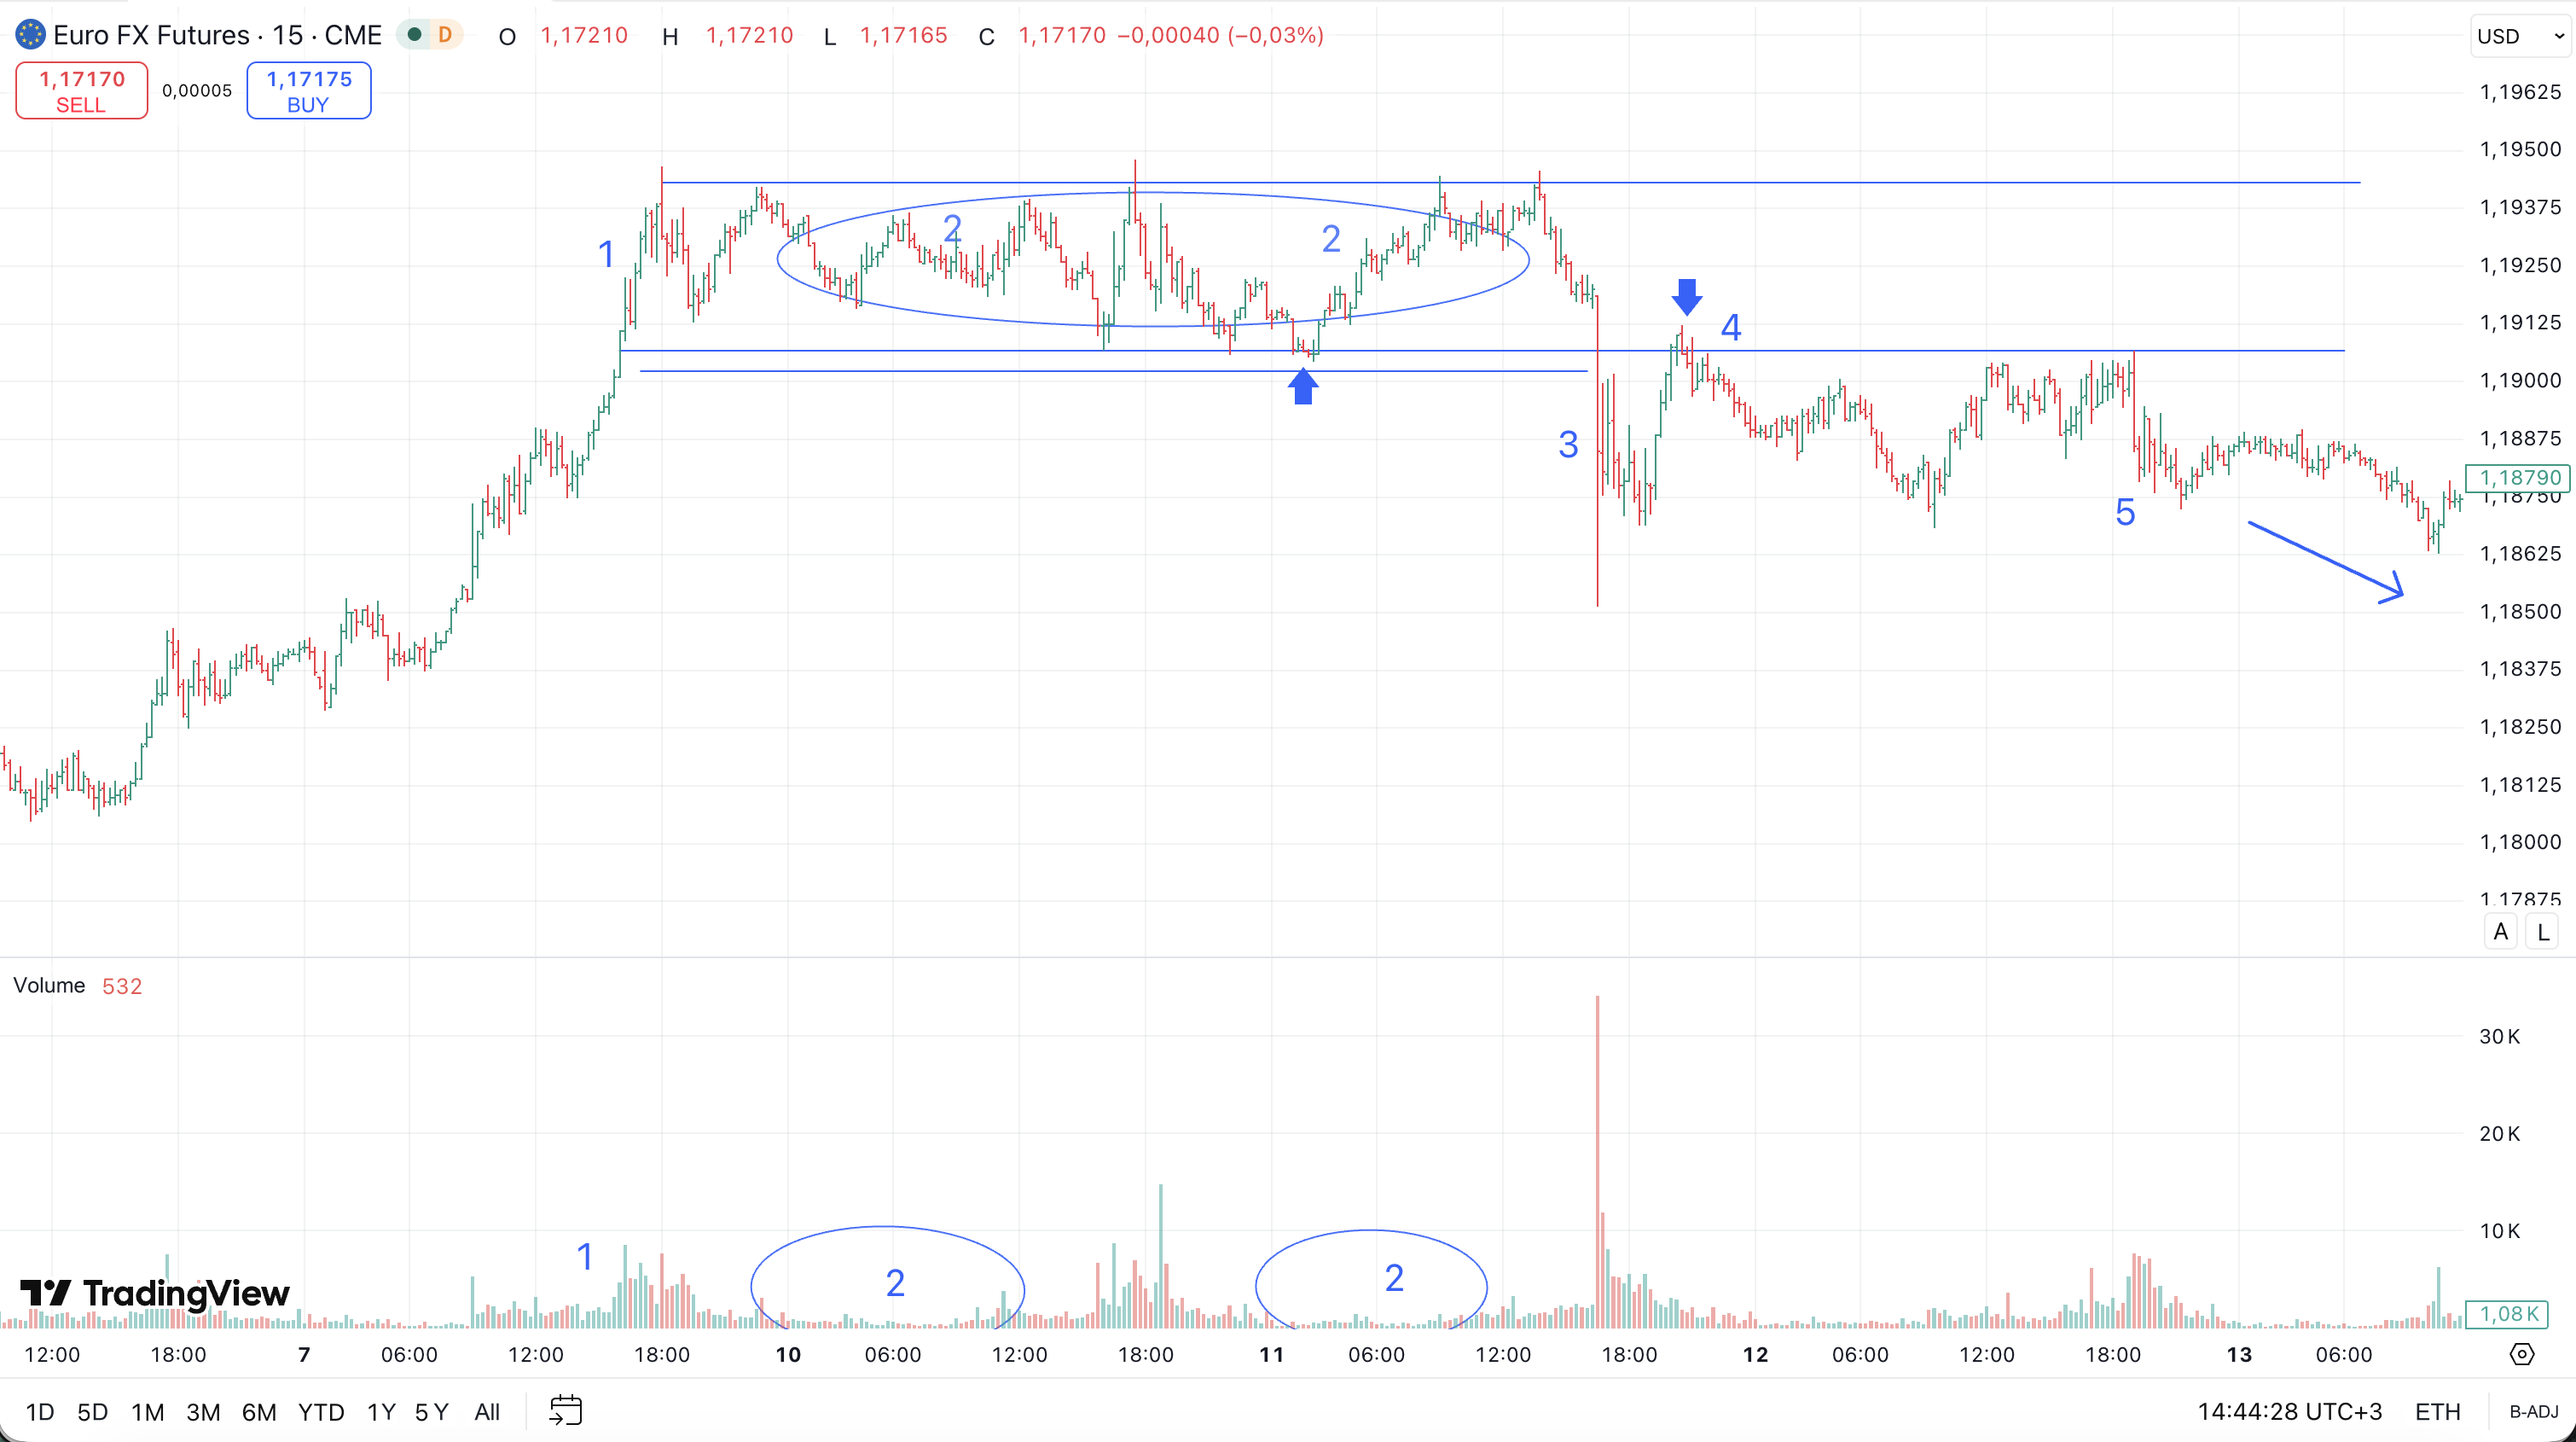
1. A high-volume rally stalls on the Euro chart. In Wyckoff terms, I consider a possible buying climax and a distribution hypothesis. Total volume does not identify the sellers.
2. A range forms, and another attempt to rise does not break the high. Weaker continuation supports the hypothesis but is not a short-entry signal on its own.
3. Price moves below support. After the breakout, I wait for pullback 3–4 to check whether former support holds as resistance.
4. Pullback 3–4 returns to former support and briefly moves above it. Point 4’s high is below the peaks of range 2. I plan the protective stop for the short position above point 4’s high; after the pullback, I check for a return below the area and continuation at point 5.
5. Price moves lower again on increased volume after the test at points 3–4. The chart does not reveal how many sell stops were triggered. Before entry, the planned risk must be acceptable and there must be enough room to the target.
The long and short setups follow the same analysis sequence: high activity and a stall, a range, a breakout, a test and continuation. The shape and duration of the moves can differ.

Check your understanding
In what order does the author check long and short setups?
Show answer
High activity and a stall, a range, a breakout, a test and continuation.
What do you check during the pullback after resistance breaks in the long example?
Show answer
Compare pullback low 4 with the low of range 2. Then check for a return above the PCL and a renewed rally at point 5.
Position management: how do you exit a trade?
Define the stop, target and invalidation condition before entry. You can then judge how you managed the trade against your plan, rather than against the best possible price in hindsight.
Uncertainty means we do not know the next price. New information can change market prices and structure. Plan the exit instruction in advance, while recognizing that the exact fill is unknown.
I use the marked opposing level as a target reference. How often that target is reached must be checked across a series of trades. Before entering, compare the distance to the target with the stop distance, and note any levels in between.
Exit discipline means following the exit criteria set before entry. Use the target and invalidation condition in your plan. If structure changes, apply your management rule rather than changing it merely to avoid accepting a loss.
After the trade, compare the action taken with the plan. A loss within the rules and a rule violation call for different conclusions.
How I manage positions and take profits
In these examples, I look for a long entry after the low at point 4, as price rallies toward point 5. The chart marks an entry area, rather than the exact bar on which the order filled.
For a long position, I place the stop below the higher low at point 4; for a short position, above the lower high. A fall below that low or a rise above that high invalidates the respective setup. The stop level does not guarantee execution price, so record the actual loss separately.
Before entry, I mark the nearest significant opposing zone as the target. I use impulse projection only as a reference and compare it with actual levels in the image. The next move may not cover the same distance as the first; if the nearest obstacle leaves insufficient room for the selected ratio, I skip the trade.

You can place a limit order in the target area in advance to take profit. It restricts price, but may fill only partly or not at all.
Once a change in structure in favor of the trade is confirmed, I consider moving the stop to entry under my management rule. This may still leave a loss after commission, spread and slippage. Do not move the stop in a way that increases the planned loss, hoping price will recover.
After exit, I record how closely the trade followed the plan, what changed in structure and which costs were incurred. Consistent rules make the system easier to assess, but do not ensure a positive result.
Check your understanding
Where does the author place the stop for a long and a short position?
Show answer
For a long position, below the higher low at point 4; for a short position, above the lower high. A fall below that low or a rise above that high invalidates the respective setup.
How does the author choose the target?
Show answer
Before entry, he marks the nearest significant opposing zone. If the nearest obstacle leaves insufficient room for the chosen risk/reward ratio, he skips the trade.
Trading expectancy: a profitable-system model
This worked example links stop placement, the risk/reward ratio and the win rate. In both examples, position size is the same, stops and targets execute at the specified prices, and costs are excluded for now. The win rates are inputs to the calculation, not measurements from a real system.
- In the course’s system, we set the protective exit before entry. A stop limits the planned loss, but execution price can differ from the selected level. Do not cancel protection in the hope of a recovery.
- The risk/reward ratio compares the planned loss if the stop is reached with the planned profit if the target is reached. We use a 5-point stop and a 15-point target, giving a ratio of 1:3. This is a model assumption and my selection criterion, not sufficient proof of profitability.
- Win rate is the proportion of trades in the sample that made a profit. Combined with the size of wins and losses and the costs, it determines the average result. One successful example does not establish a win rate.
I use a risk/reward ratio of at least 1:3 as a trade-selection condition when there is room to the chosen target. It does not guarantee positive expectancy: win rate, actual exits and costs matter.
An example with a 1:3 risk/reward ratio:
- Stop-loss: 5 points.
- Take-profit: 15 points.
- 10 trades: 4 losers and 6 winners (60% win rate).
- Losses: 4 × (−5) = −20 points.
- Gains: 6 × (+15) = +90 points.
- Total result: +70 points over 10 trades.
The same 1:3 ratio, but a win rate of only 40%:
- 10 trades: 6 losers and 4 winners.
- Losses: 6 × (−5) = −30 points.
- Gains: 4 × (+15) = +60 points.
- This hypothetical series returns +30 points before costs, with identical size for every trade and execution at the specified prices.

In this model, one 15-point winner covers three 5-point losses. For a positive average before costs, the win rate must exceed 25%; costs raise the required rate. Actual trading results can differ from this exercise.
A system with a positive average can still produce consecutive losses. Keeping risk small limits the damage from a losing streak; it cannot make poor rules profitable. Use the journal to review actual wins, losses and costs, and set risk so the account can withstand consecutive losses. See “Account Drawdown.”
The calculation shows the model’s conditions, not a future result.
Check your understanding
What determines a trading system’s average result?
Show answer
Win rate, win size, loss size and costs.
What is the result of four 15-point wins and six 5-point losses?
Show answer
4 × 15 − 6 × 5 = +30 points before costs. All trades use the same position size and fill at the specified prices in this example.
Common mistakes beginners make
Watch for the following rule violations in practice. Each changes the planned risk or prevents a fair assessment of the system.
- Trading without a stop-loss leaves no planned protective exit. Price may never return to your entry, and one large loss can outweigh the gains from earlier trades.
- Unplanned additions to a losing position. Increasing size while price moves against you increases the total loss. In this system, hope is not a reason to average down: risk is set before entry.
- Overtrading means opening unnecessary trades without the required conditions. If the system provides no reason, do not open another position. Write down your reason for entry before submitting the order.
- In the course’s system, I do not sell just because price has risen for a long time. Changing direction requires a change in the observed structure. A long-lasting rally alone is not a reason to sell.
- Trying to win back a loss. Increasing position size and entering without a valid setup add pressure to the account. After a violation, stop opening new trades and review the recorded risk and entry rationale.
- Moving to a live account without reviewing practice. One hundred practice trades are my initial assignment, but the number itself does not prove profitability. Consistent rules, a complete journal and cost assessment are needed.
Emotions can lead to these mistakes. That is why trading psychology and risk management stand alongside technical analysis in this course.

Check your understanding
Which mistakes alter a trade’s planned risk?
Show answer
Trading without a stop, unplanned increases to a losing position, and increasing position size to try to win back losses.
What does this chapter call overtrading?
Show answer
Opening unnecessary trades without the required conditions. If the system gives no reason, do not open another position.
How to choose a broker
A broker or other trading provider gives access to specific markets and products under an agreement. Exchange trading and OTC products may fill orders differently. Check the legal entity, the product and the agreement first.
- Regulation and licensing. Find the exact legal entity in the regulator’s register. Check its permitted services, the jurisdiction of the agreement and its contact details. A license does not protect against every loss or cover market losses. A clone firm may misuse another firm’s license number.
- Available instruments. Check access to the required stocks, futures, currency or cryptocurrency product and its specifications.
- Order execution. Learn the rules for stop activation, partial fills and gaps. A demo account checks the interface, not future order queues or live slippage.
- Commissions and spreads. Compare the costs of entering, exiting and holding the same position. Frequent trades increase recurring costs.
- The trading platform. On a demo account, check that you understand how to place orders, that positions are displayed clearly and that the required data is available. A convenient demo interface does not establish the quality of live execution.
- Customer support. Check how quickly and competently support responds before opening a live account. It may matter at a critical moment.
Before depositing money, review the agreement and costs, verify the legal entity in the regulator’s register and test the demo interface. Time spent on a demo account does not by itself establish the quality of live execution or the protection of your funds.

Check your understanding
What should you check when choosing a broker?
Show answer
Regulation and licensing, available instruments, order execution, commissions and spreads, the platform and support.
How do you check a trading company’s license?
Show answer
Find the exact legal entity in the regulator’s register and check permitted services, the agreement’s jurisdiction and contact details.
What can a beginner trade?
A beginner is better served by focusing on one instrument and learning how it is quoted, how position size is measured and what the costs are. We will examine the main categories.
- Futures. These exchange-traded contracts have an expiry date and defined specifications. Some involve delivery; others settle in cash. Volume refers to the particular contract, and exchange rules do not remove every risk associated with a broker. The course uses futures to study comparable exchange-volume data.
- Forex. An OTC currency market; a retail product may be a CFD or another contract with a provider, not a direct interbank trade. There is no unified volume for all Forex. Check the source and units when reading the indicator.
- Stocks represent ownership in a company. Available trade sizes, costs and short-selling conditions vary by venue and provider. Calculate the capital required for the instrument itself rather than making assumptions about the market category.
- Cryptocurrency may trade around the clock. Volatility, the size of price fluctuations, varies across coins and periods. Check whether you are buying a coin or a contract, which volume data the venue provides and how funds are held. On illiquid instruments, execution may differ from the displayed price.
Start with one available instrument and check its specifications, demo conditions and liquidity. You can study structure and volume in different markets, but test rules on specific data. One hundred practice trades provide an initial sample, not automatic permission to use real money.

Check your understanding
Which main instrument categories are discussed here?
Show answer
Futures, Forex, stocks and cryptocurrency.
How does the author suggest a beginner choose an instrument?
Show answer
Focus on one available instrument. Learn how it is quoted, how position size is measured and what the costs are. Check the contract specifications, demo conditions and liquidity.
How to begin demo trading
Set up a virtual account and select one instrument. Before each trade, mark the structure, entry criteria, stop and target, then calculate the allowed position size. After closing the trade, record the result and whether you followed the rules. Review any mistakes before the next trade and keep a record of them in the journal.
Begin with at least 100 demo trades under consistent rules. Review results and violations, not just the overall gain. Changes in market, timeframe or execution conditions require separate testing; a positive demo result does not promise future profit.

Check your understanding
What should you mark before each demo trade?
Show answer
The structure, entry condition, stop, target and permitted position size.
What initial demo-practice assignment does the author set?
Show answer
Complete at least 100 demo trades under consistent rules. Then review the results and violations, not just the overall gain.
The trading journal
Record every trade in the journal, including accidental entries and rule violations. To assess a particular system, flag the trades that followed it. Do not delete inconvenient entries: doing so hides actual risk and distorts results.
Estimate expectancy using the average result of trades taken under the chosen rules. After the practice series, review entries, exits, costs and adherence to the plan. That sample average does not guarantee future results. Assess risk separately before deciding to trade live.
What to record for every trade:
- Date and time: when the trade was opened.
- Instrument: what you traded.
- Direction: long or short.
- Entry price: the price at which you opened.
- Stop-loss: the protective order’s level.
- Take-profit: the target.
- Result: actual fill prices and position size, profit or loss before and after costs.
- Entry rationale: what you saw on the chart, such as a PCL, selling climax or level breakout.
If you cannot explain the reason for entry, label the trade as a violation or an accidental entry. Record what happened and which rule you need to follow.
For system analysis, separate rule-compliant trades from violations. Calculate the overall account result using every trade so an accidental loss does not disappear from the assessment.

Review the journal regularly. Compare trades made under similar conditions, and examine costs, rule violations and losing streaks. A small set of successful trades does not establish an edge. If the rules change, label the new version separately.
Check your understanding
What should you record about every trade?
Show answer
Date and time, instrument, direction, entry price, stop, target, result and entry rationale. Include actual fill prices, position size and costs in the result.
How do you separate system assessment from the overall account result?
Show answer
Analyze trades under the system’s rules separately from violations. Calculate the overall account result using every trade, including accidental entries.
Final assignment: analyze a new chart
Choose the instrument and timeframe you will practice with on a demo account. Select a chart segment not shown in the course examples and analyze it.
- Identify structure. Mark highs and lows. Show where there is a trend and where there is a range.
- Mark the PCL. Show the area from which an impulse began and made a new high or low.
- Check the scenario. Find the stall, range, breakout, test and continuation. Compare price movement with volume.
- Build a plan. Mark the entry area, stop and target. Calculate position size using your chosen risk and the instrument’s specifications.
- Save the analysis. Add a chart screenshot and the reason for your decision to the journal. If entry conditions are absent, record which stage is missing.
Deliverable: an annotated chart and journal entry that explain the trade rationale or why you chose not to trade.
Frequently asked questions
Yes. This course’s materials are free for independent study. They cover the platform, analysis rules, risk and demo practice in sequence.
The time required depends on your starting knowledge and how much you practice. Work through the chapters, then complete and review the practice series. The initial assignment is one hundred trades; there is no fixed schedule or guaranteed point at which you are ready to trade live.
A 1:3 ratio means the planned profit at the target is three times the planned loss at the stop. In the exercise, the target is 15 points and the stop is 5 points. A positive result also depends on win rate, costs and actual execution.
Smart Money interprets the activity of large participants through price, volume and liquidity. That interpretation cannot establish who traded during a particular bar or prove deliberate manipulation.
Excessive position size, canceling a stop, unplanned additions to a loser and entering without confirming the entry conditions can cause losses. Record entry conditions and acceptable risk to check adherence to the plan.
Practice on a demo account first. A live trade requires enough funds for the instrument’s minimum size, collateral and acceptable loss. The same risk percentage is not safe for every account and system.
A PCL is an area from which an impulse begins and creates a new high or low in the structure being analyzed. In this system, it is a reference for reading structure: watch the subsequent reaction to judge whether the area holds or breaks.
A false breakout is a move beyond a marked level followed by a return. Higher volume or a candle pattern may accompany it but is not part of the required definition. Entry in this course requires a separate check of structure and risk.
About the author
Igor Arapov has traded since 2013 and created the ArapovTrade library. ORCID: 0009-0003-0430-778X.




