What fundamental analysis examines
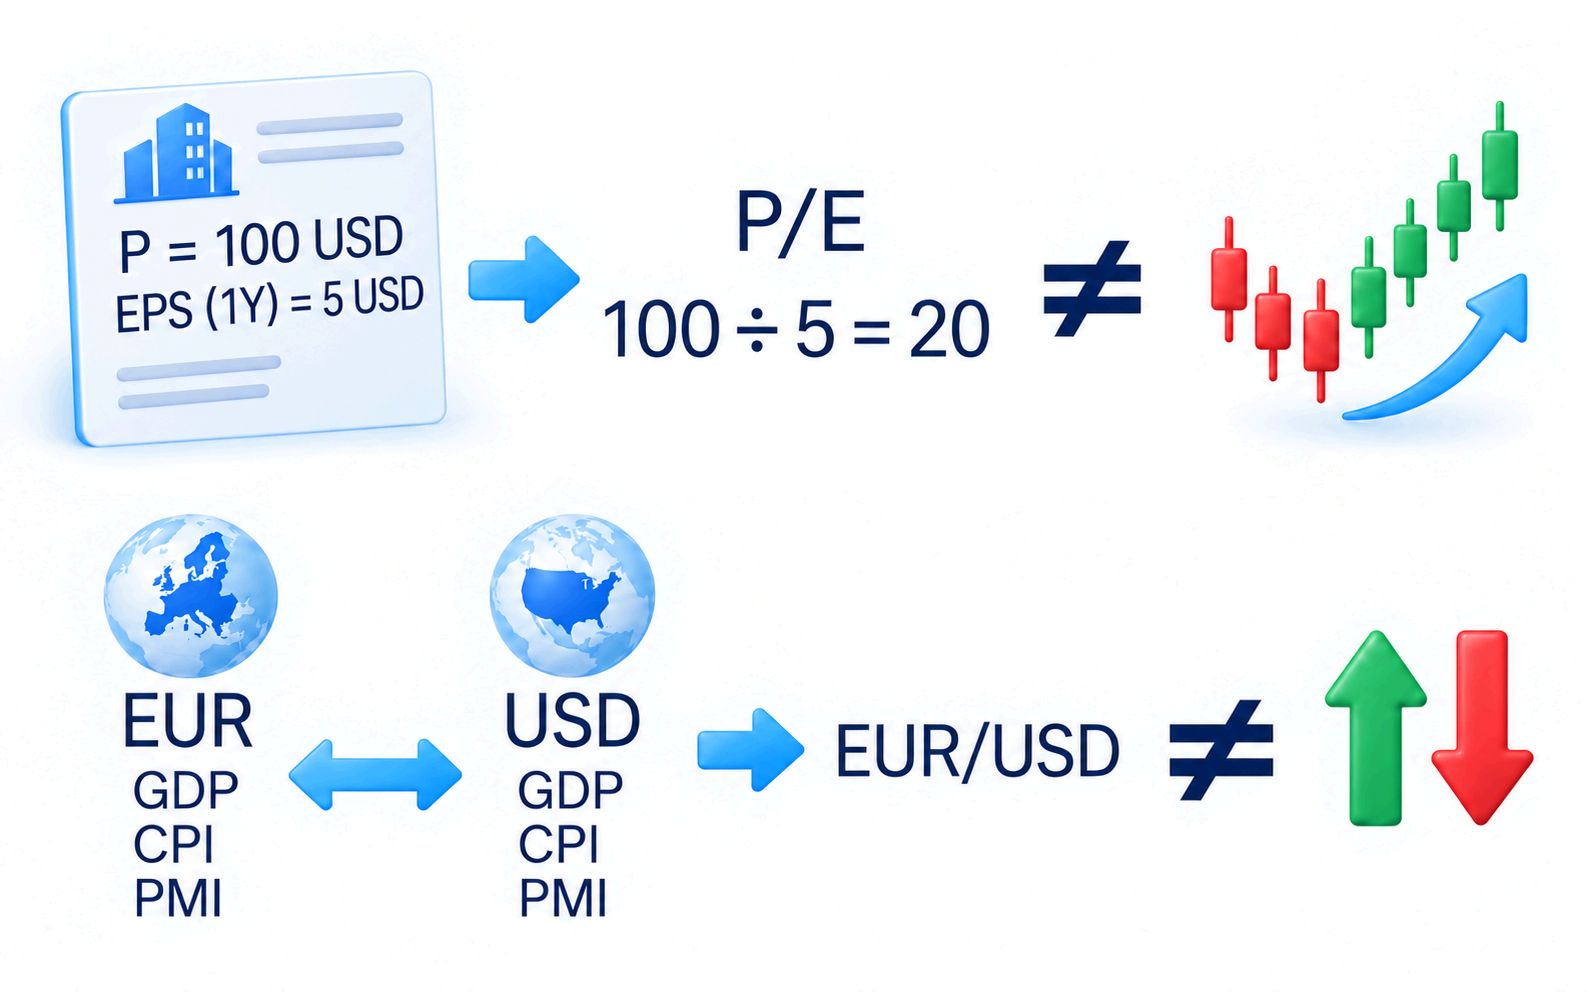
Fundamental analysis examines a business and its economic environment to judge an asset's value and the conditions that could change it. For a share, the evidence includes the company's earnings, debts and ability to generate cash. For a currency, it includes inflation, economic activity and monetary policy. An assessment is an argument based on assumptions, not a guaranteed future price.
You can start with the economy and industry, then examine a company. Or start with the business: what it sells, who pays it and whether its income can cover its commitments. Either way, connect the information to the asset you are evaluating. A collection of headlines is not an analysis until you explain why those developments matter.
A sound company can fall in price, and disappointing results can accompany a short-lived rise. An investor's assessment of future earnings therefore does not supply an immediate trade entry. The differences between gold, oil and stock indices also affect which economic evidence is useful: a company's accounts cannot explain an oil supply disruption on their own.
Reading a company’s accounts
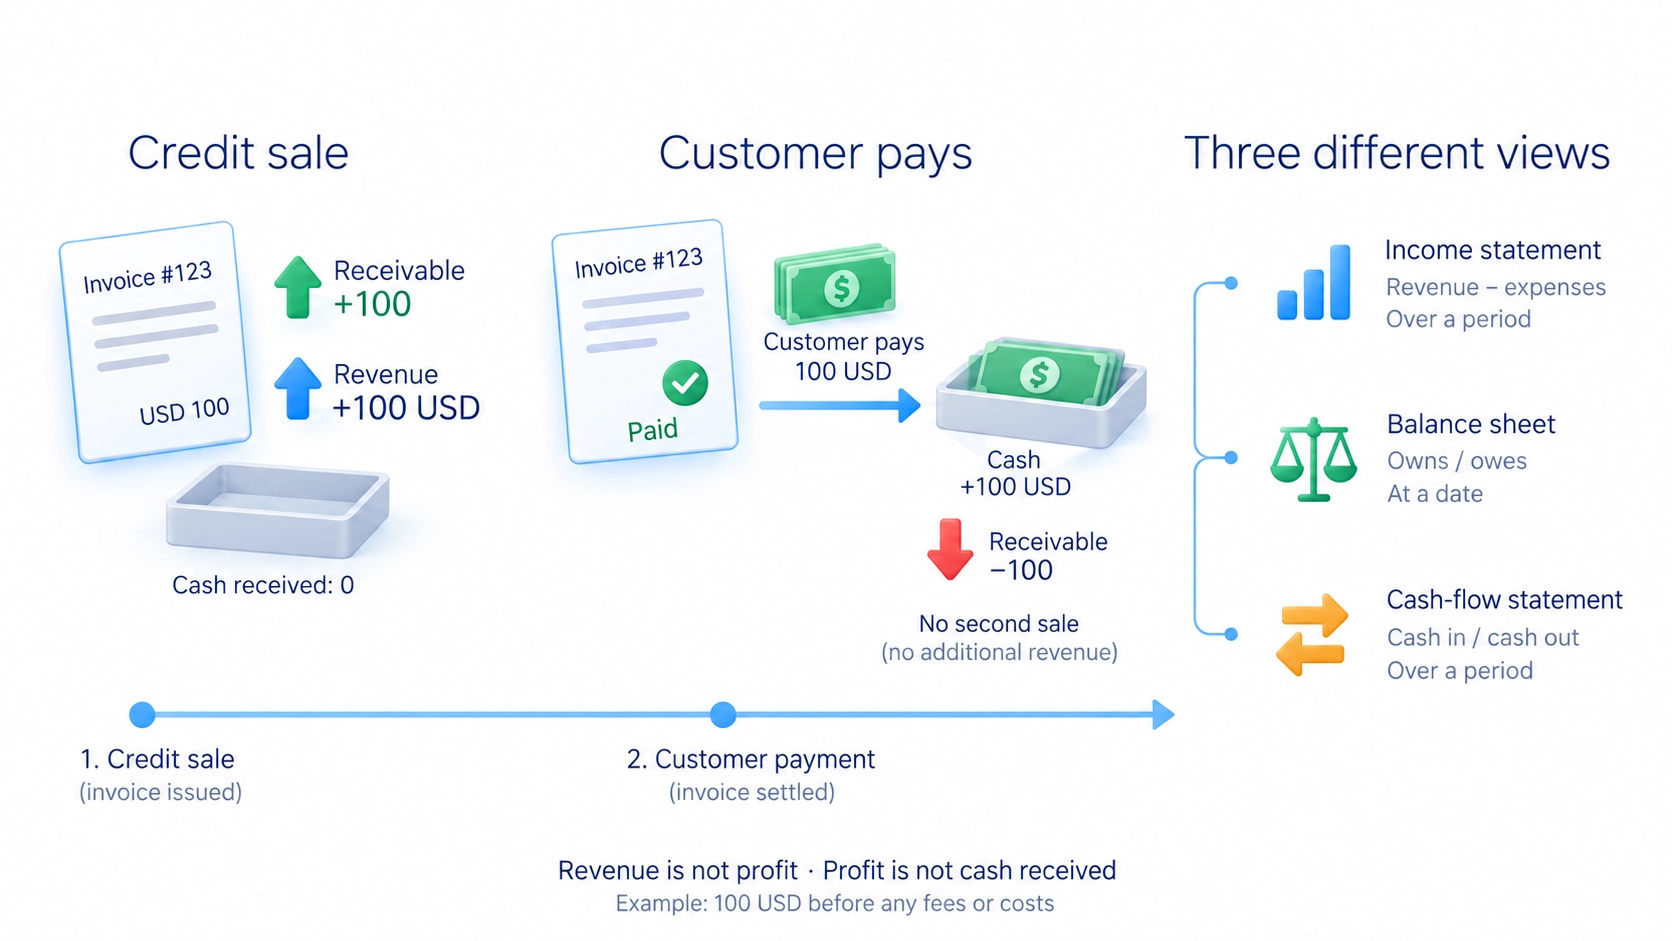
Start a company review with its balance sheet, income statement and cash-flow statement. The balance sheet records what the company owns and owes at a date. The income statement records revenue and expenses over a period. The cash-flow statement records cash received and paid. A sale on credit can increase reported revenue before the customer pays, so profit and available cash are different measures.
Check whether sales are growing, whether the business keeps a useful share of that revenue as profit and whether ordinary operations generate enough cash for necessary spending. Read the debt repayment dates and financing costs as well. Selling a building can improve a period's result without improving the continuing business; the notes to the accounts help explain such differences.
Compare like periods and similar businesses. Check seasonality, reporting currency and accounting choices before deciding that one company is improving faster than another. Read the business description, risk factors and management's explanation alongside the numbers. A filing is evidence supplied by the company, not a regulator's promise that the investment will succeed.
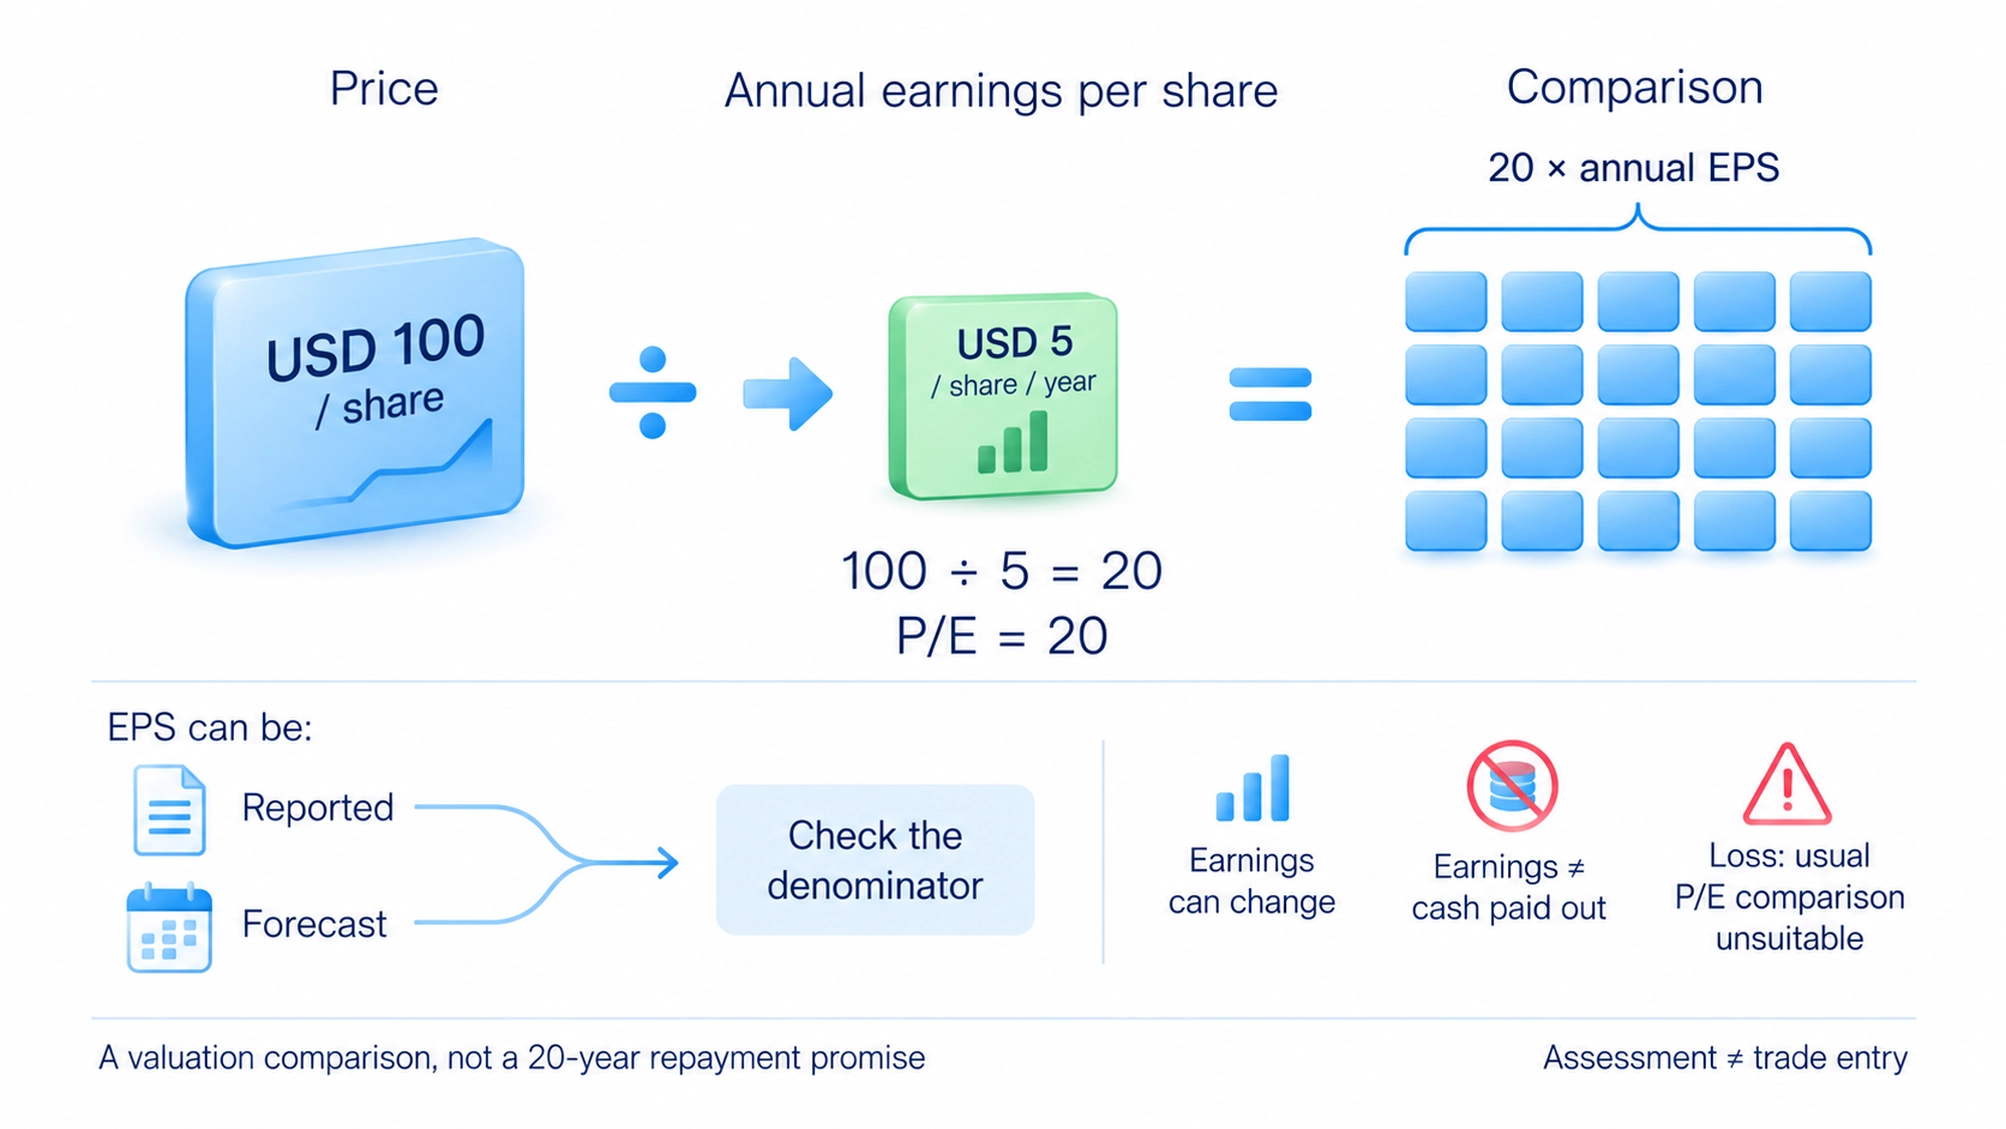
Valuation connects expected future earnings with the price paid now. One simple comparison is the price-to-earnings ratio, or P/E: share price divided by annual earnings per share. In a hypothetical example, a share costs USD 100 and annual earnings per share are USD 5. P/E is 100 ÷ 5 = 20: the share price is twenty times those annual earnings.
That does not promise repayment of the purchase price in twenty years. Earnings can change and need not all be paid to shareholders. A low P/E can reflect either a modest price or weak business prospects. A loss makes the usual positive-earnings comparison unsuitable. Check whether the denominator uses reported past earnings or a forecast, and whether a one-off item distorted it; then return to the business, competitors and customers behind the figure.
Understanding economic indicators
Economic statistics describe conditions in which companies operate and currencies are exchanged. Before comparing a number, identify its period, units and method. A monthly change is not the same as a yearly change, and seasonally adjusted data remove estimated recurring seasonal effects. Mixing those bases can create an apparent improvement that the data do not support.
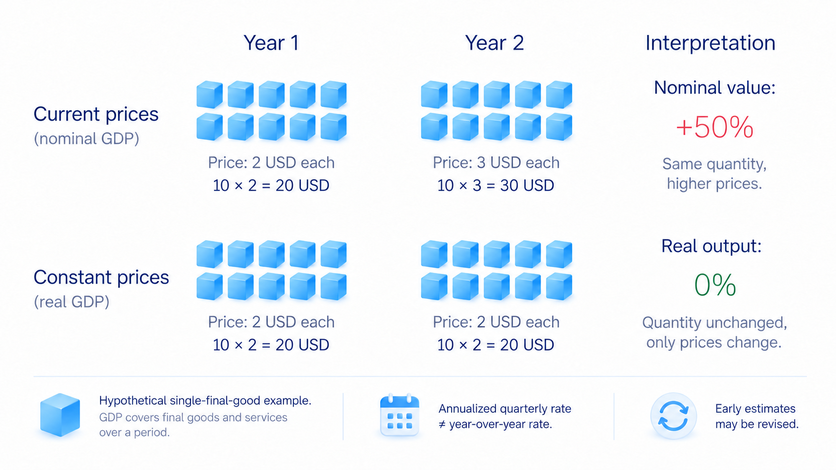
Gross domestic product, or GDP, measures production of final goods and services within an economy over a period. Nominal GDP uses current prices; real GDP adjusts for price changes. A rise in the nominal total need not mean the same rise in production. Early estimates can be revised as more information arrives, and an annualized quarterly growth rate is not a year-over-year rate.
The Consumer Price Index, or CPI, tracks changes in the prices of a weighted basket of consumer goods and services. It does not measure the prices of every asset or reproduce each household's spending. Distinguish a monthly change from a yearly change and the full index from a measure excluding selected categories before judging whether inflation has accelerated.
Employment reports describe different aspects of the labour market. In the United States, payroll job counts come from a survey of employers, while unemployment comes from a household survey. The unemployment rate uses the labour force, people working or meeting the definition of unemployed, rather than the whole population. Read the components and revisions instead of treating one headline as a complete measure of economic strength.
The Purchasing Managers' Index, or PMI, summarizes surveyed businesses' reports of changes from the previous month. A reading above 50 usually indicates improvement under that survey's method; below 50 indicates deterioration. It is not a percentage growth rate of GDP. Manufacturing, services and combined indexes cover different activities, so choose a measure relevant to the business or economy under review.
How interest rates affect assets
A central bank's policy rate helps influence financing conditions. More expensive borrowing can restrain spending and investment, but the effect takes time and depends on existing debts, demand and financial conditions. A rate decision does not move every market price in the same direction or produce an immediate, fixed change in the economy.
The Federal Reserve, the US central bank, is often called the Fed. Markets consider both its current decision and what it suggests about future policy. Comments about future borrowing costs can change expectations even when the announced rate stays unchanged. Read the decision and explanation together rather than reacting only to the rate number.
Higher financing costs can increase a company's expenses and change the value investors assign to future earnings. For currencies, relative conditions in the two economies and existing expectations matter. For bonds, promised payments must be compared with the return buyers now require; the bond guide explains that price-and-yield mechanism. A rate increase alone is not a universal instruction to buy dollars or sell shares.
Why good news can accompany falling prices
Company results, inflation and employment releases, and central-bank decisions can change expectations of income, costs and financing. Their importance depends on the asset and the question being considered. The same release need not matter equally to an export business, a domestic retailer and a currency pair.
Price can respond to new information relative to what participants expected. Strong earnings may disappoint if an even stronger result was already anticipated. Revised earlier figures, management's outlook and the market's existing condition can also affect the response. A positive reported number can therefore accompany a price fall without making the number itself incorrect.
Expectations develop before publication. Participants can adjust their holdings using public forecasts and their own assessments. That does not mean someone necessarily knows the unpublished result. A price chart alone cannot tell you exactly what information each buyer or seller possessed, or prove that every large participant prepared the same trade.
Risk-on and risk-off describe changes in willingness to accept risk. In one case participants become more willing to hold riskier assets; in the other they reduce those holdings. These are broad descriptions, not laws making every share, currency or gold price move together. Each instrument also has its own financing, supply, demand and trading conditions.
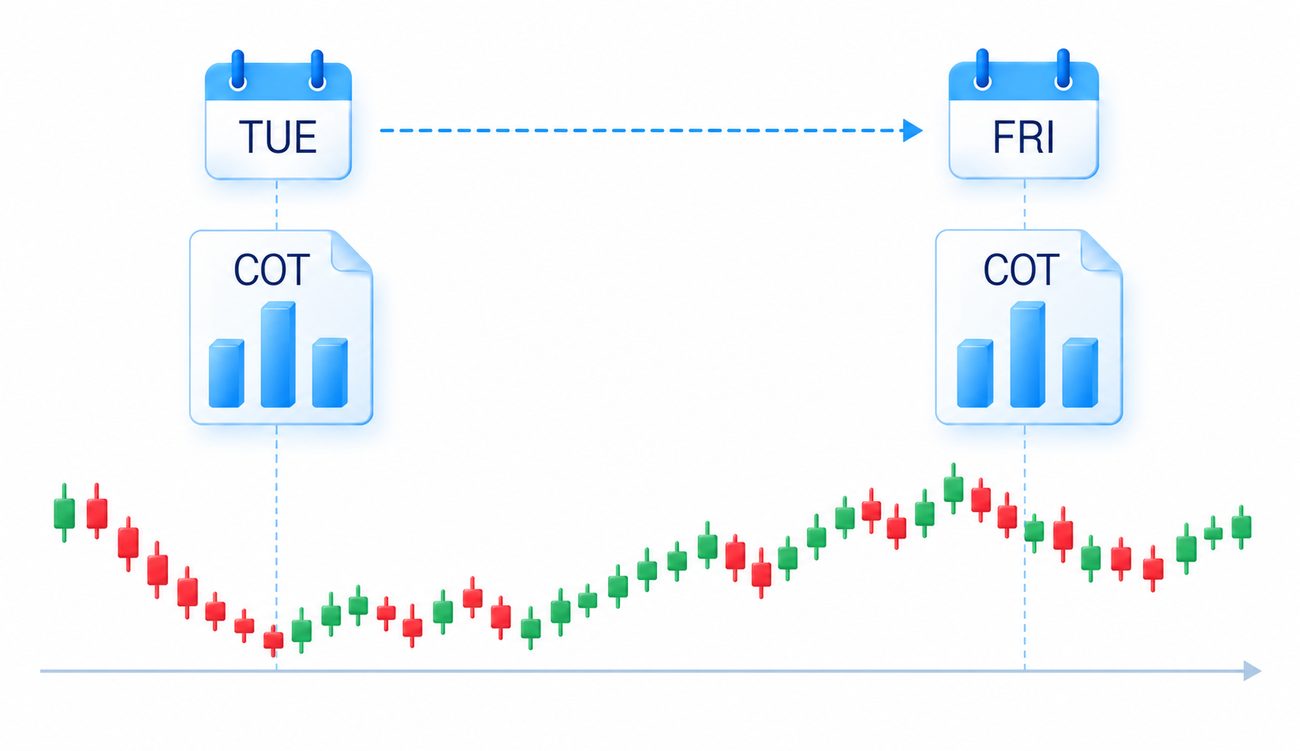
Commitments of Traders reports, commonly called COT, add information about categories of holdings on specified futures markets. The US Commodity Futures Trading Commission generally reports Tuesday's data on Friday, so the figures are not real-time. Categories do not disclose each trader's purpose: a holding may offset a risk elsewhere. A change in reported holdings does not, by itself, specify an entry.
Using an economic calendar
An economic calendar lists scheduled releases, previous readings, forecasts and publication times. Check its time zone, units and original data source. A forecast is an expectation, not a known result. After release, compare the actual figure with the forecast and check whether the earlier reading was revised; a changed comparison base can alter the interpretation.
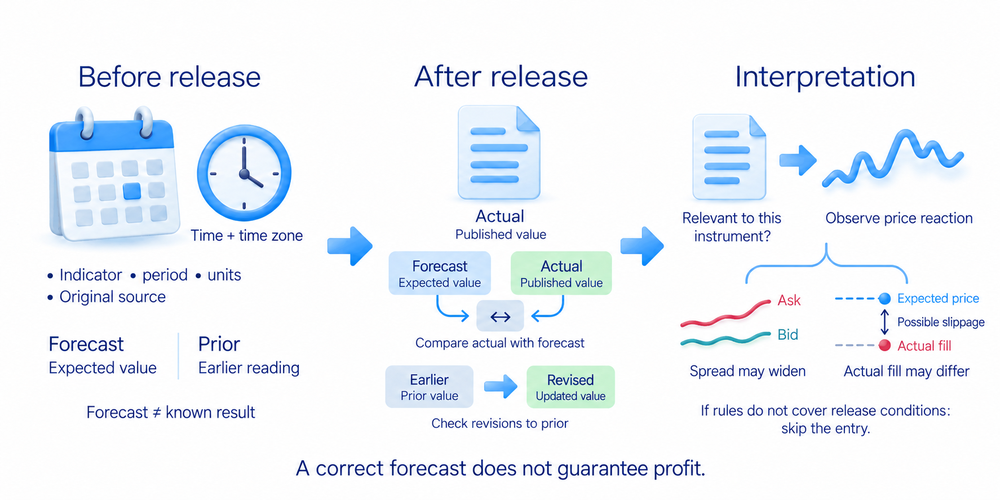
Before an event, decide why it matters to your instrument and intended holding period. A company's results may matter more to its shares than a general economic statistic. A currency pair involves two economies. Record what would change your assessment and the reason, such as higher financing costs reducing the business's cash available after expenses.
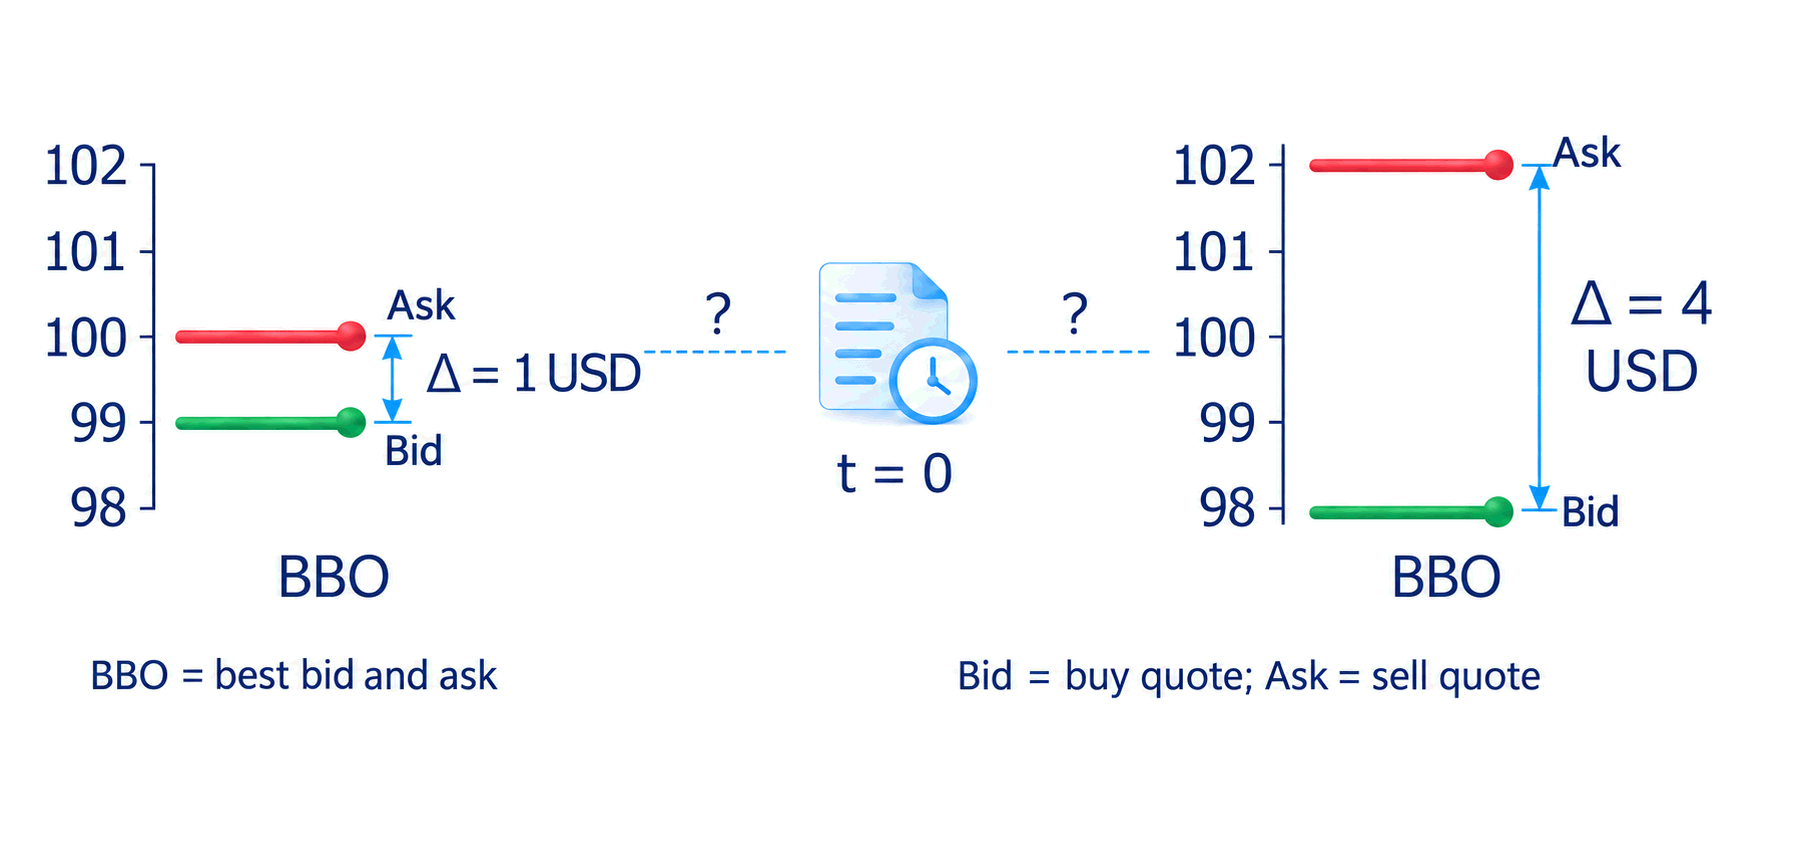
Trading during a release adds execution uncertainty. Price can change rapidly, the gap between available buying and selling prices can widen, and the actual fill can differ from the expected price. Even a correct reading of the statistic does not ensure a profit. If your trading rules were not designed for those conditions, the announcement is not a reason to improvise an entry.
My free trading course first develops chart reading, price structure and trading volume, the quantity traded in the selected data source. Fundamental analysis is introduced as a separate area requiring its own preparation. This order avoids asking an economic report to provide an exact entry price. The optional video on fundamental analysis discusses that role; the written explanation here does not require watching it.
Keep your assessment with its evidence: source, data period, expected effect and the observation that would make you revise it. This gives you a checkable argument instead of “the news is good, so price must rise.” Use the method to explain particular conditions and assumptions, then keep the separate decision about opening a trade subject to its own rules.
Frequently asked questions
It studies a business and its economic environment to assess an asset's value and factors that could change it. Company accounts matter for shares; inflation and monetary policy matter for currencies. The assessment does not promise a precise future price or date.
For a company, examine revenue, expenses, cash generated and debt. For an economy, examine production, inflation, employment, business activity and central-bank policy. Choose evidence relevant to the asset, and compare matching periods and units.
The result may have been weaker than expected, even though it was positive. Earlier expectations, revised data and the outlook for future results can also change the response. A good number does not oblige buyers to raise the asset's price.
They influence borrowing costs, financing conditions and assessments of future earnings. Markets also consider the expected path of policy, so a rise or cut alone does not determine the direction of every asset.
Verify the time zone, period and units. Compare the actual result with the forecast and check changes to the previous reading. Then explain why the information matters to the particular instrument rather than treating a calendar colour as an entry signal.
They describe greater willingness to hold riskier assets, or a reduction of those holdings. They do not impose the same direction on every instrument or replace an assessment of its own conditions.
COT provides delayed information about categories of futures holdings. Tuesday's figures are generally published on Friday. The report supplies context, but it does not reveal every participant's intention or determine the moment to open a trade.
About the author
Igor Arapov, practising trader since 2013 and author of the ArapovTrade library. ORCID: 0009-0003-0430-778X.




