Gold, oil and stock indices give you access to different markets. To compare them, identify the product you would actually trade and the cash value of its price movements. Buying a metal, a fund share or a futures contract gives you different rights, even when their charts follow a similar price.
What does XAU/USD mean?
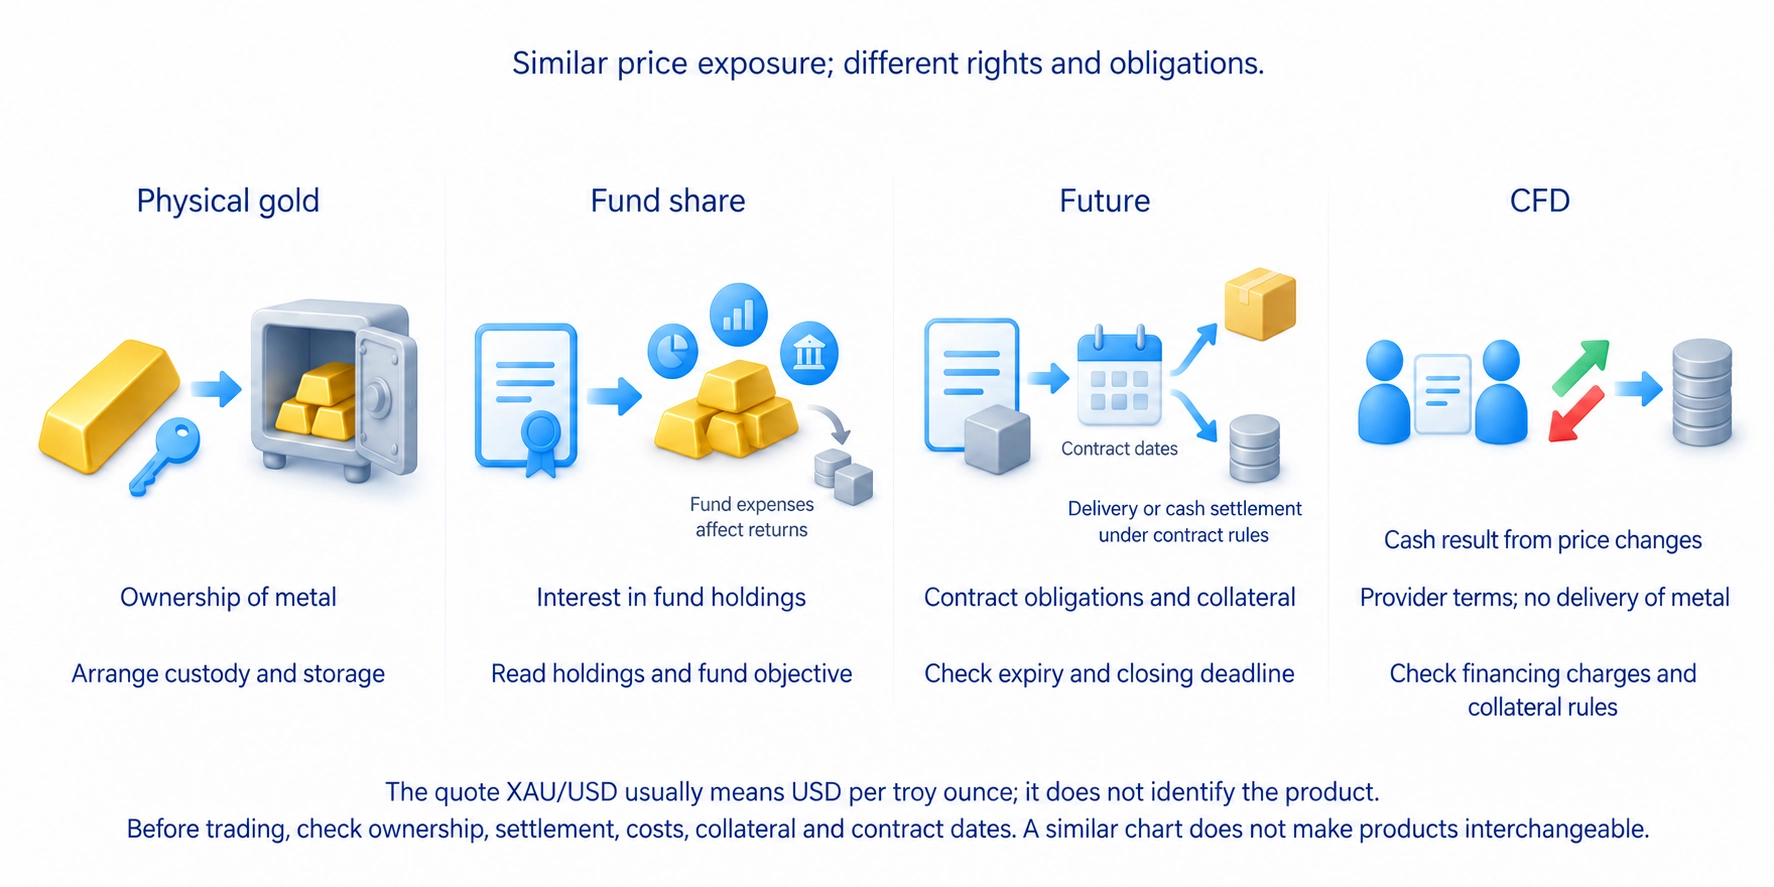
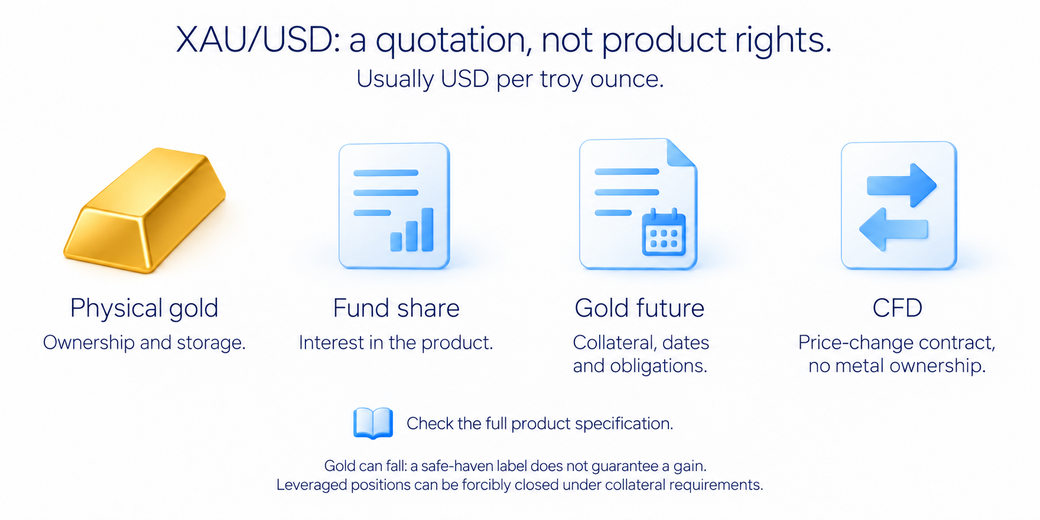
XAU/USD quotes gold in US dollars, usually per troy ounce, the weight unit used for gold. It tells you how the price is expressed, not the full terms of the product. A broker's XAU/USD contract and an exchange-listed gold future can follow similar prices while creating different obligations.
Physical gold has storage and ownership arrangements. A fund share gives you an interest in a product with its own holdings and expenses. A future requires collateral, funds or eligible assets pledged for the position, and has contract dates. A contract for difference, or CFD, settles price changes under the provider's terms rather than handing you the metal. Read the product specification before treating these as interchangeable.
Gold prices respond to demand for the metal, investor demand, currency movements and expectations about interest rates. Gold itself pays no interest, so the returns available elsewhere affect the cost of holding it. The guide to bond interest and yields explains the income paid by debt investments. Rising interest rates do not make a gold price fall inevitable: demand, the dollar and views about financial risk can change together.
Gold is often described as a safe-haven asset. This describes a reason investors may hold it, not a guarantee of a gain in every crisis. Its price can fall. A leveraged gold product, where the position's value exceeds the funds committed to it, can also be forcibly closed under its collateral requirements, even though gold's reputation sounds protective.
If you examine volume from the GC gold future, check the contract month and the source of the data. This volume records trades in that contract, not every gold purchase worldwide. A CFD feed may instead show the number of quote updates. One large volume reading does not identify a trader or reveal their intention.
How are Brent and WTI different?
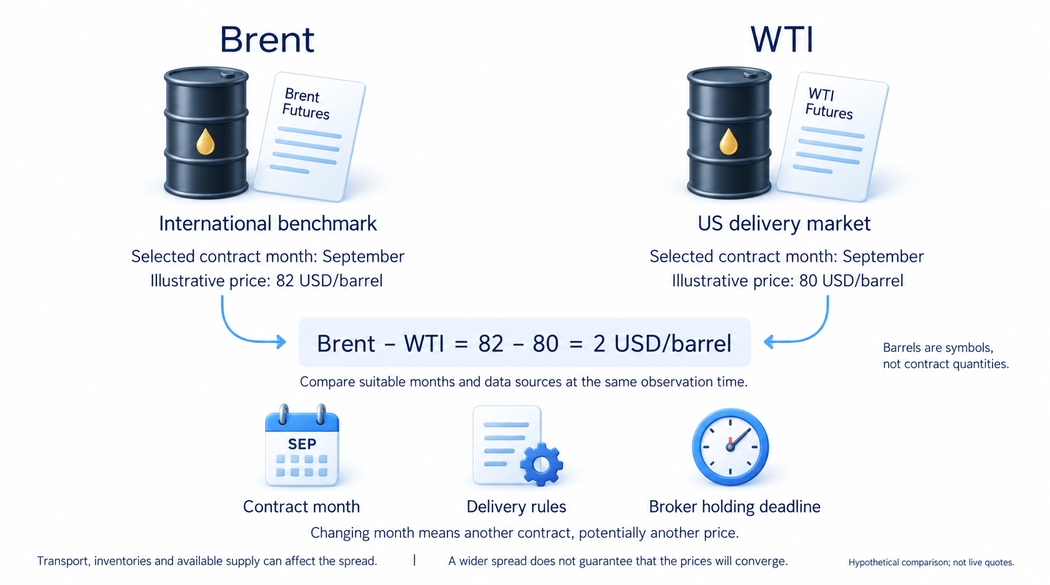
Brent and WTI are crude-oil benchmarks: prices used as reference points for oil trading. They refer to different delivery markets and infrastructure, with different contracts. WTI is associated with the US market; Brent is an international benchmark whose underlying basket has evolved beyond a single North Sea oil stream. Similar movements do not make their prices identical.
The Brent-WTI spread is the difference between the selected Brent and WTI prices. State which price you subtract from which, and compare suitable contract months and data sources. Transport, inventories and available supply can affect that difference. A wider spread does not prove that one price must soon return to the other.
Oil prices depend on supply, demand and expectations about both. Production decisions, economic activity, refinery operations and supply disruptions can change those expectations. A production cut is not a ready-made buy signal: it may already be expected, or weaker demand may work against it. The guide to fundamental analysis explains how to separate a published figure from the market's expectations.
The US Energy Information Administration's (EIA) weekly petroleum report includes inventories and other parts of the oil balance, such as production, imports and refinery activity. An inventory change adds information about available supply, but does not describe the entire world market. Compare it with expectations and the rest of the report. A single stockpile number cannot determine the next price reaction.
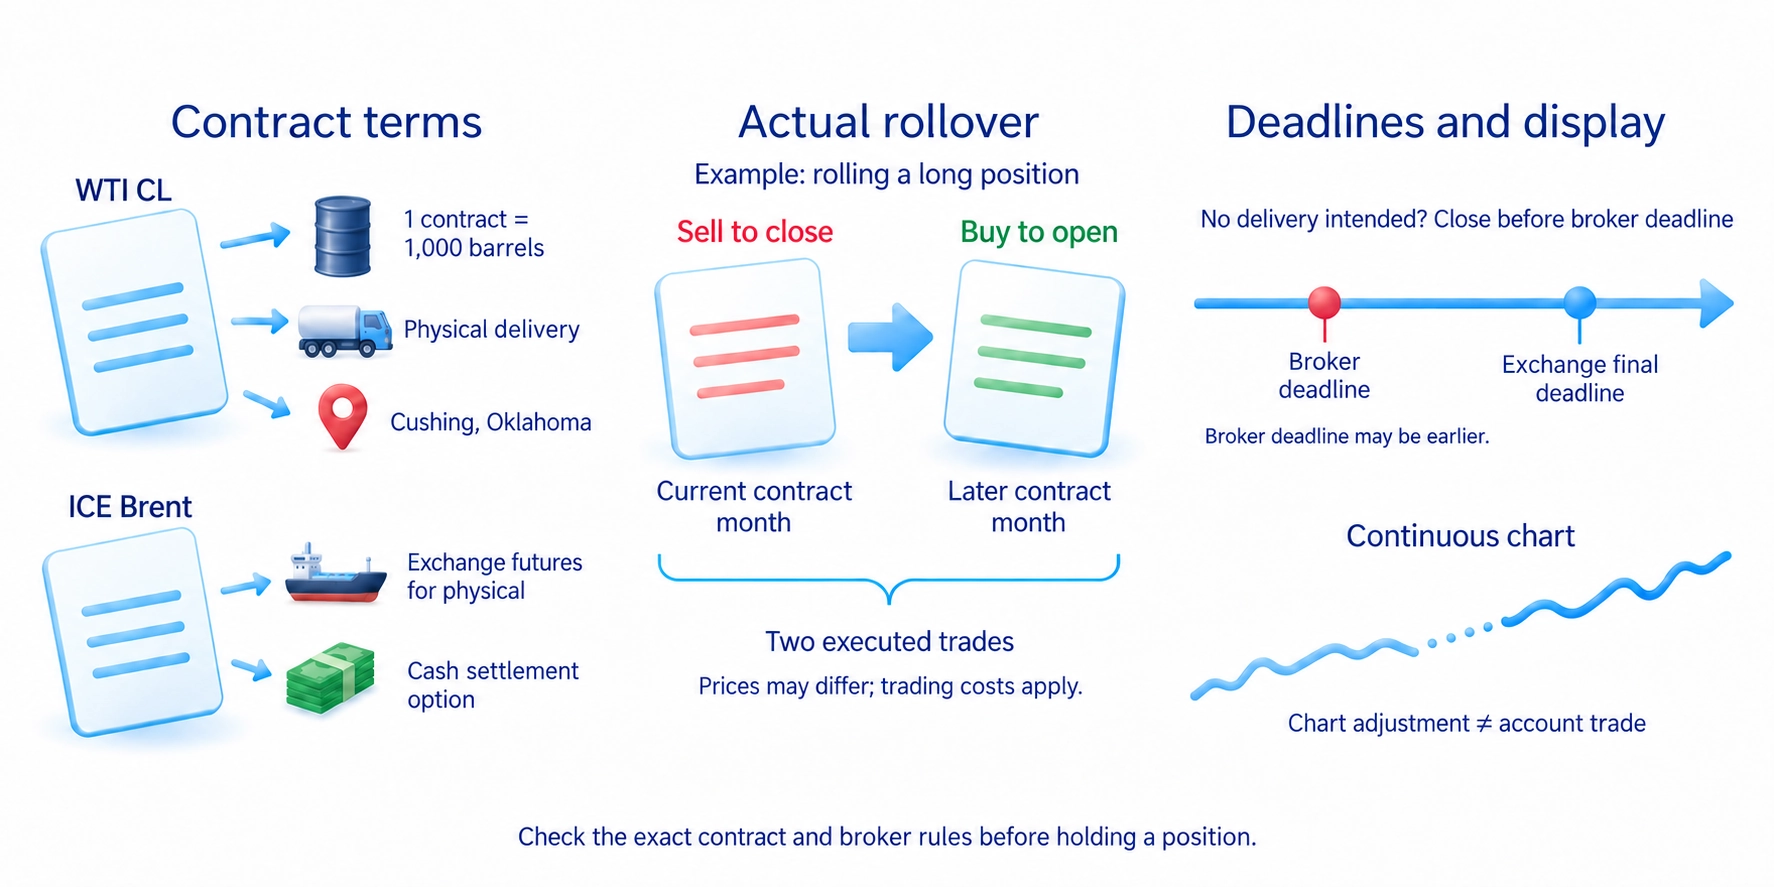
The standard WTI CL future represents 1,000 barrels and provides for physical delivery at Cushing, Oklahoma, under its rules. The ICE Brent future has a delivery arrangement based on exchanging futures for a physical position, with an option to settle in cash. The fact that retail traders usually close early does not make every oil future cash-settled.
If you do not intend to arrange delivery, check the broker's deadline for holding the position. It can come before the exchange's final deadline. Moving into a later contract month means trading another contract, potentially at another price. A continuous chart joins successive contracts for analysis; that chart adjustment is not an executed trade in your account.
What is a stock index, and how can you trade it?
A stock index is a calculated measure of a selected group of shares. Each company's influence depends on the index's rules. An index rising does not mean that every included share rose, and the index number itself is not a security you can buy.
The S&P 500 measures large US companies across different industries. The Nasdaq-100 includes 100 large non-financial companies listed on Nasdaq. It is not limited to technology companies, and it is different from the broader Nasdaq Composite. Check the full index name: a screen labelled Nasdaq does not identify the exact group of shares being measured.
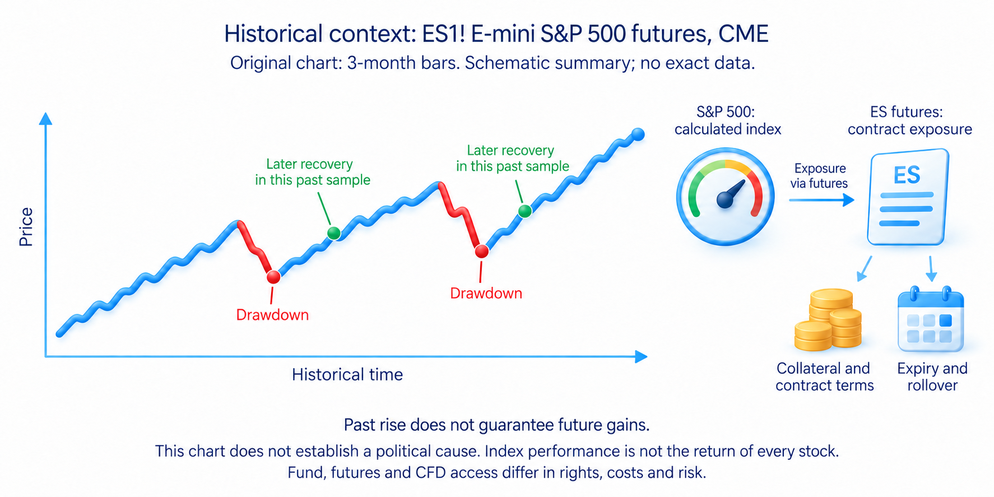
An index fund aims to track a chosen index. Its shares give you an interest in the fund's holdings. A futures contract creates obligations and requires collateral; a CFD follows the provider's contract. The guide to spot trading and derivatives explains the difference between owning an asset and taking a contract position.
A fund's result can differ from its index because of expenses, payments to investors and how it holds or reproduces the holdings. For leveraged funds, read the stated measurement period. Many aim for a multiple of the daily change, which does not promise the same multiple over a month or year. The product's investment objective matters more than a familiar index name.
Holding an index product does not remove market risk. Changes in profit expectations or investors' willingness to take risk can affect many shares at once. Two different indices can also include the same large companies. Buying products tracking both may provide less variety than their different names suggest.
How do you compare the size of a trade?
One contract does not have the same cash value in every market. Check its quantity, quotation currency and cash value per price increment. An index quotation uses points, whose dollar value depends on the product. A gold quotation per ounce or an oil quotation per barrel is not the price of the whole futures contract.
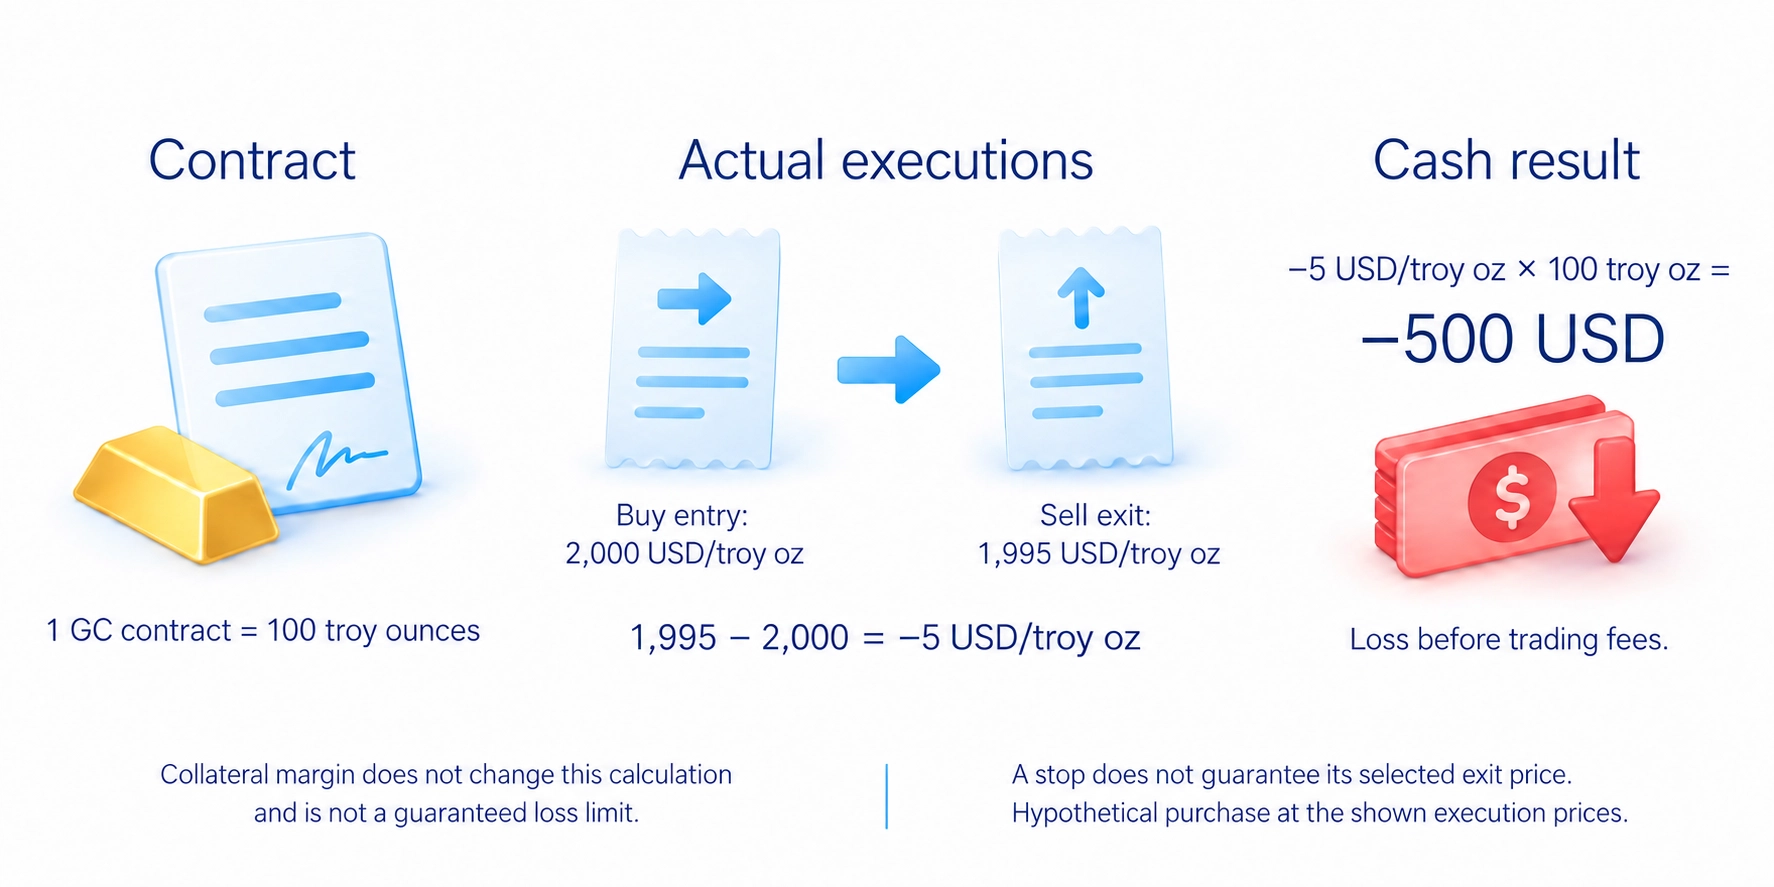
Consider a hypothetical purchase of one GC contract, representing 100 troy ounces. An entry at $2,000 per ounce and an exit at $1,995 per ounce lose $5 per ounce. The result is a $500 loss: $5 × 100 ounces, before trading fees, using those actual execution prices. The margin deposited as collateral does not change this price-movement calculation and is not a guaranteed loss limit.
If that possible loss exceeds your plan, do not solve it by placing an arbitrarily tighter stop. Check whether the exit still fits the trade's conditions. Then choose a suitable smaller product or skip the trade. The guide to risk-based position sizing explains how the exit distance and loss budget determine position size.
Compare trading fees, the difference between buying and selling prices, and any holding charges. A CFD can have overnight financing charges; a future can involve closing and opening costs when changing months. Trading hours, breaks and available quantity also depend on the product. A stop order does not guarantee an exit at its selected price.
How do you apply analysis to another market?
In my course section on working with levels, the euro futures example shows a strong upward move, smaller subsequent rising bars and then a move down through local support. A bar records prices over one chart period. The lesson is to observe the changing price reaction rather than decide from the asset's name. This example does not prove that the same method earns money in every market.
For gold, oil or an index product, first check the data and the chart you are using. Mark the relevant price zones, then examine the reaction. If you add volume, identify which market and contract it represents. Trading hours, data sources and cash position size do not transfer automatically between instruments. The guide to reading a trading chart explains the price display and its scale.
Before practising, record the full product name, quantity, cash value of a price move, holding conditions and data source. Check those details in a demo account using virtual money. If you cannot explain the cash result or the deadline for closing the position, return to the specification. A prediction about gold, oil or an index does not fill those gaps.
The optional video Drawing support and resistance shows how price zones are marked on a chart. The written product comparison above does not require watching it.
Frequently asked questions
It quotes gold in US dollars, usually per troy ounce. The label does not identify the product: check whether you would hold metal, a fund share, a future or a contract for difference (CFD), a contract based on price changes rather than owning the metal.
They are different oil benchmarks linked to different delivery markets and contracts. Compare suitable contract months and data sources; transport, inventories and available supply can affect their price gap.
Inventory figures add information about available supply. The US Energy Information Administration (EIA) report covers the US oil balance, not the entire world market. Compare the figures with expectations and other report data rather than treating one change as a trade signal.
The index itself is a calculated measure, not a security. Funds and contracts offer different ways to follow its movement, with different ownership rights, costs and rules for the funds required to support a contract position.
Not without checking its cash value. Contract size and the value of each price increment vary. The same number of contracts can therefore create very different gains and losses for the same-looking chart move.
About the author
Igor Arapov, a practising trader since 2013 and author of the ArapovTrade library. ORCID: 0009-0003-0430-778X.




