A trading indicator calculates values from market data and displays them on a chart. It can help you see an average price, compare rises and falls or measure price fluctuations. Using it well starts with understanding which data it processes and what its reading means.
An indicator signal and a trading rule are different things. You can observe two lines crossing without knowing where to exit a losing trade or how much to risk. Begin with the question you want the indicator to answer, rather than the number of tools available on the platform.
How Trading Indicators Work
Common inputs are a candle’s opening price, highest price, lowest price and closing price. Some calculations also use volume, the quantity traded in a specified data source. The period tells you how many bars the calculation uses. On a daily chart, one bar represents a day; on an hourly chart, it represents an hour. The guide to reading a price chart explains these inputs.
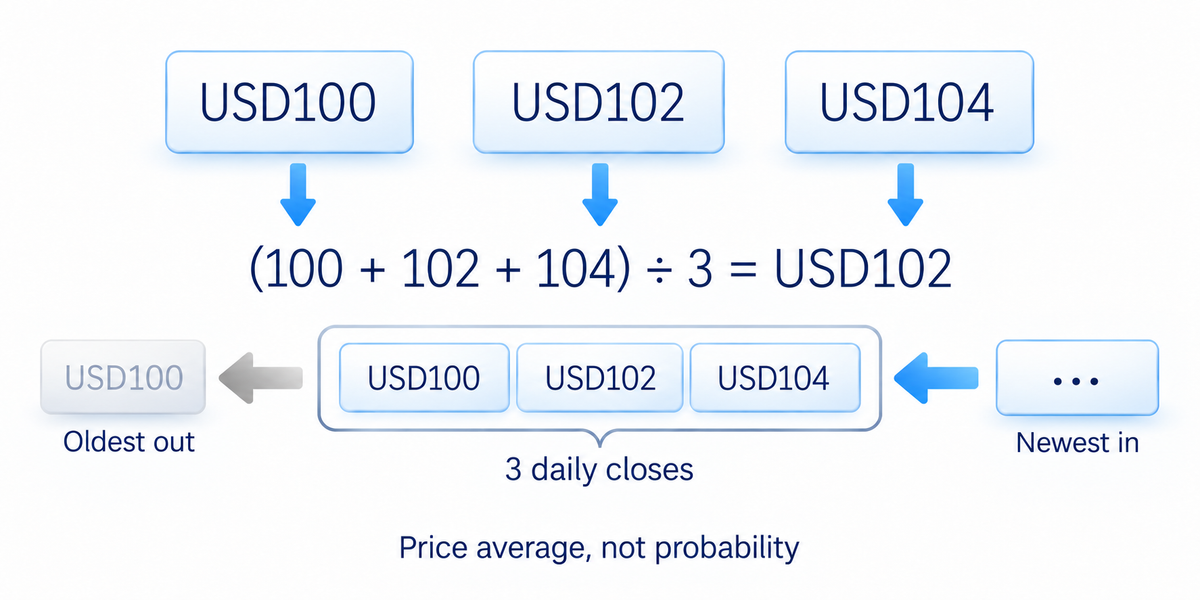
Consider a simple moving average of three daily closing prices. In this hypothetical example, a share closes at USD100, USD102 and USD104. The average is (100 + 102 + 104) ÷ 3 = USD102. It is a price, not a probability that the share will rise. After the next daily close, the oldest closing price leaves this three-day window and the newest enters it.
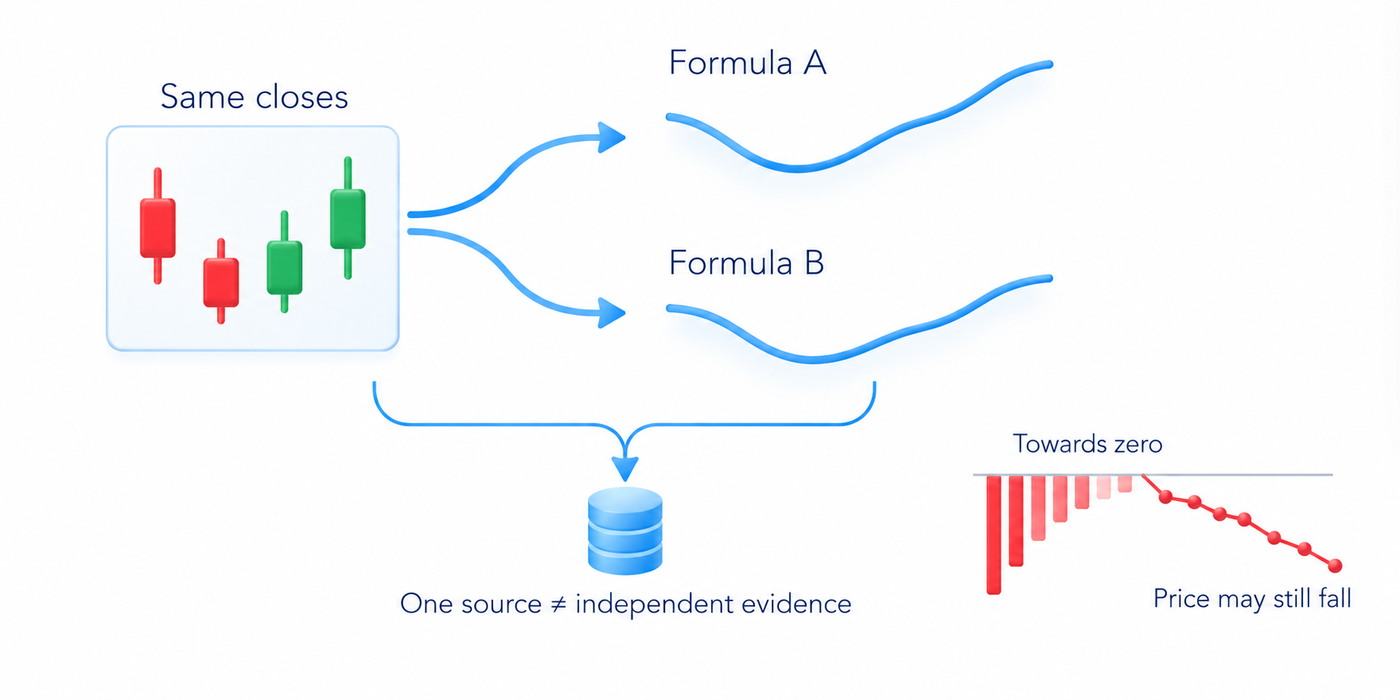
A formula presents another view of its inputs. Several indicators calculated from the same closing prices may respond to the same rise. Their agreement does not automatically give you several independent pieces of evidence. Check whether the second calculation adds information that the first one does not provide.
The term “leading indicator” also needs care. A particular reading may occur before a price reversal in some cases. The calculation still uses available data; it does not know the future orders of buyers and sellers. A change in the reading is not proof that price must change direction.
Types of Trading Indicators
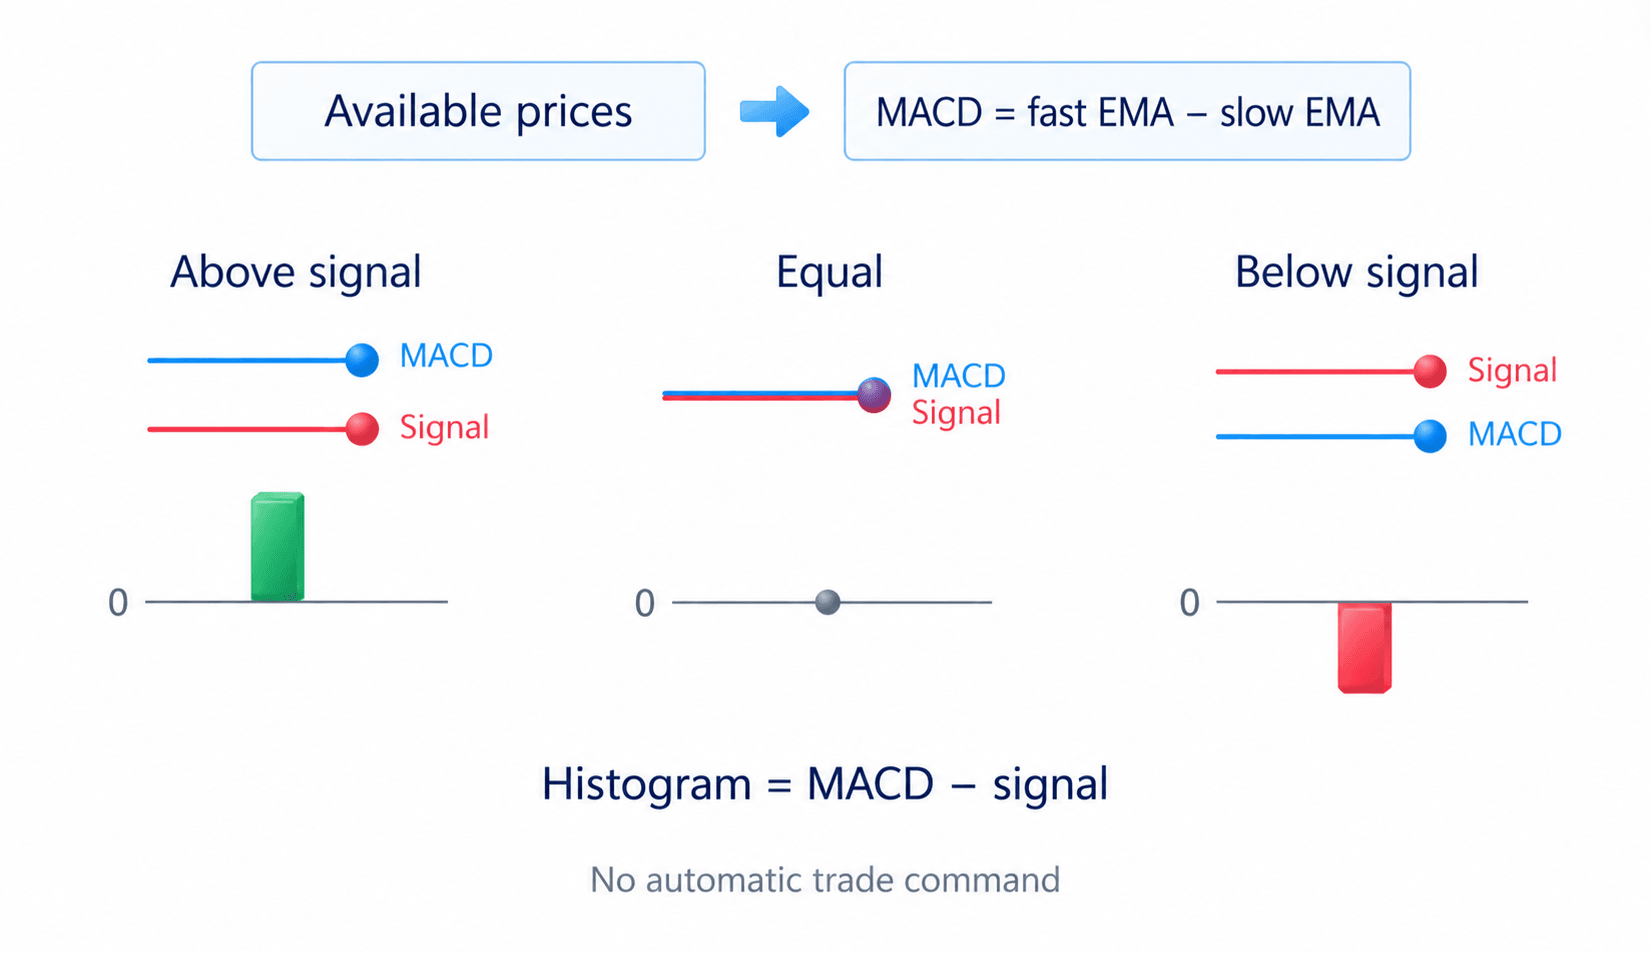
Trend indicators help describe the direction of movement. A moving average smooths selected prices. In its common form, MACD (Moving Average Convergence Divergence) compares two exponential moving averages, which give more weight to recent data. A signal line smooths MACD itself, and the histogram shows the difference between MACD and that signal line.
A rising histogram does not necessarily mean rising price: it can be moving towards zero from below. Check the platform’s averaging settings, because implementations can differ.
ADX, the Average Directional Index, measures trend strength rather than direction. A high value can accompany a sustained decline. Wilder’s directional-movement system uses separate +DI and −DI lines to compare upward and downward movement. A rising ADX is therefore not, by itself, a reason to buy.
An oscillator is an indicator that moves around a central line or within a bounded scale. RSI (Relative Strength Index) compares smoothed increases and decreases in closing price on a scale from 0 to 100. Values above 70 and below 30 are commonly called overbought and oversold. These names describe the calculation’s state; they do not establish whether an asset is fairly priced.
The Stochastic oscillator compares the close with the highest and lowest prices over a selected period. Its lines can be smoothed further. Stochastic and RSI describe different relationships between prices, even though both use a bounded scale. During a strong trend, their readings can remain near one end of that scale. Entering the upper zone does not, on its own, mean that you should sell.
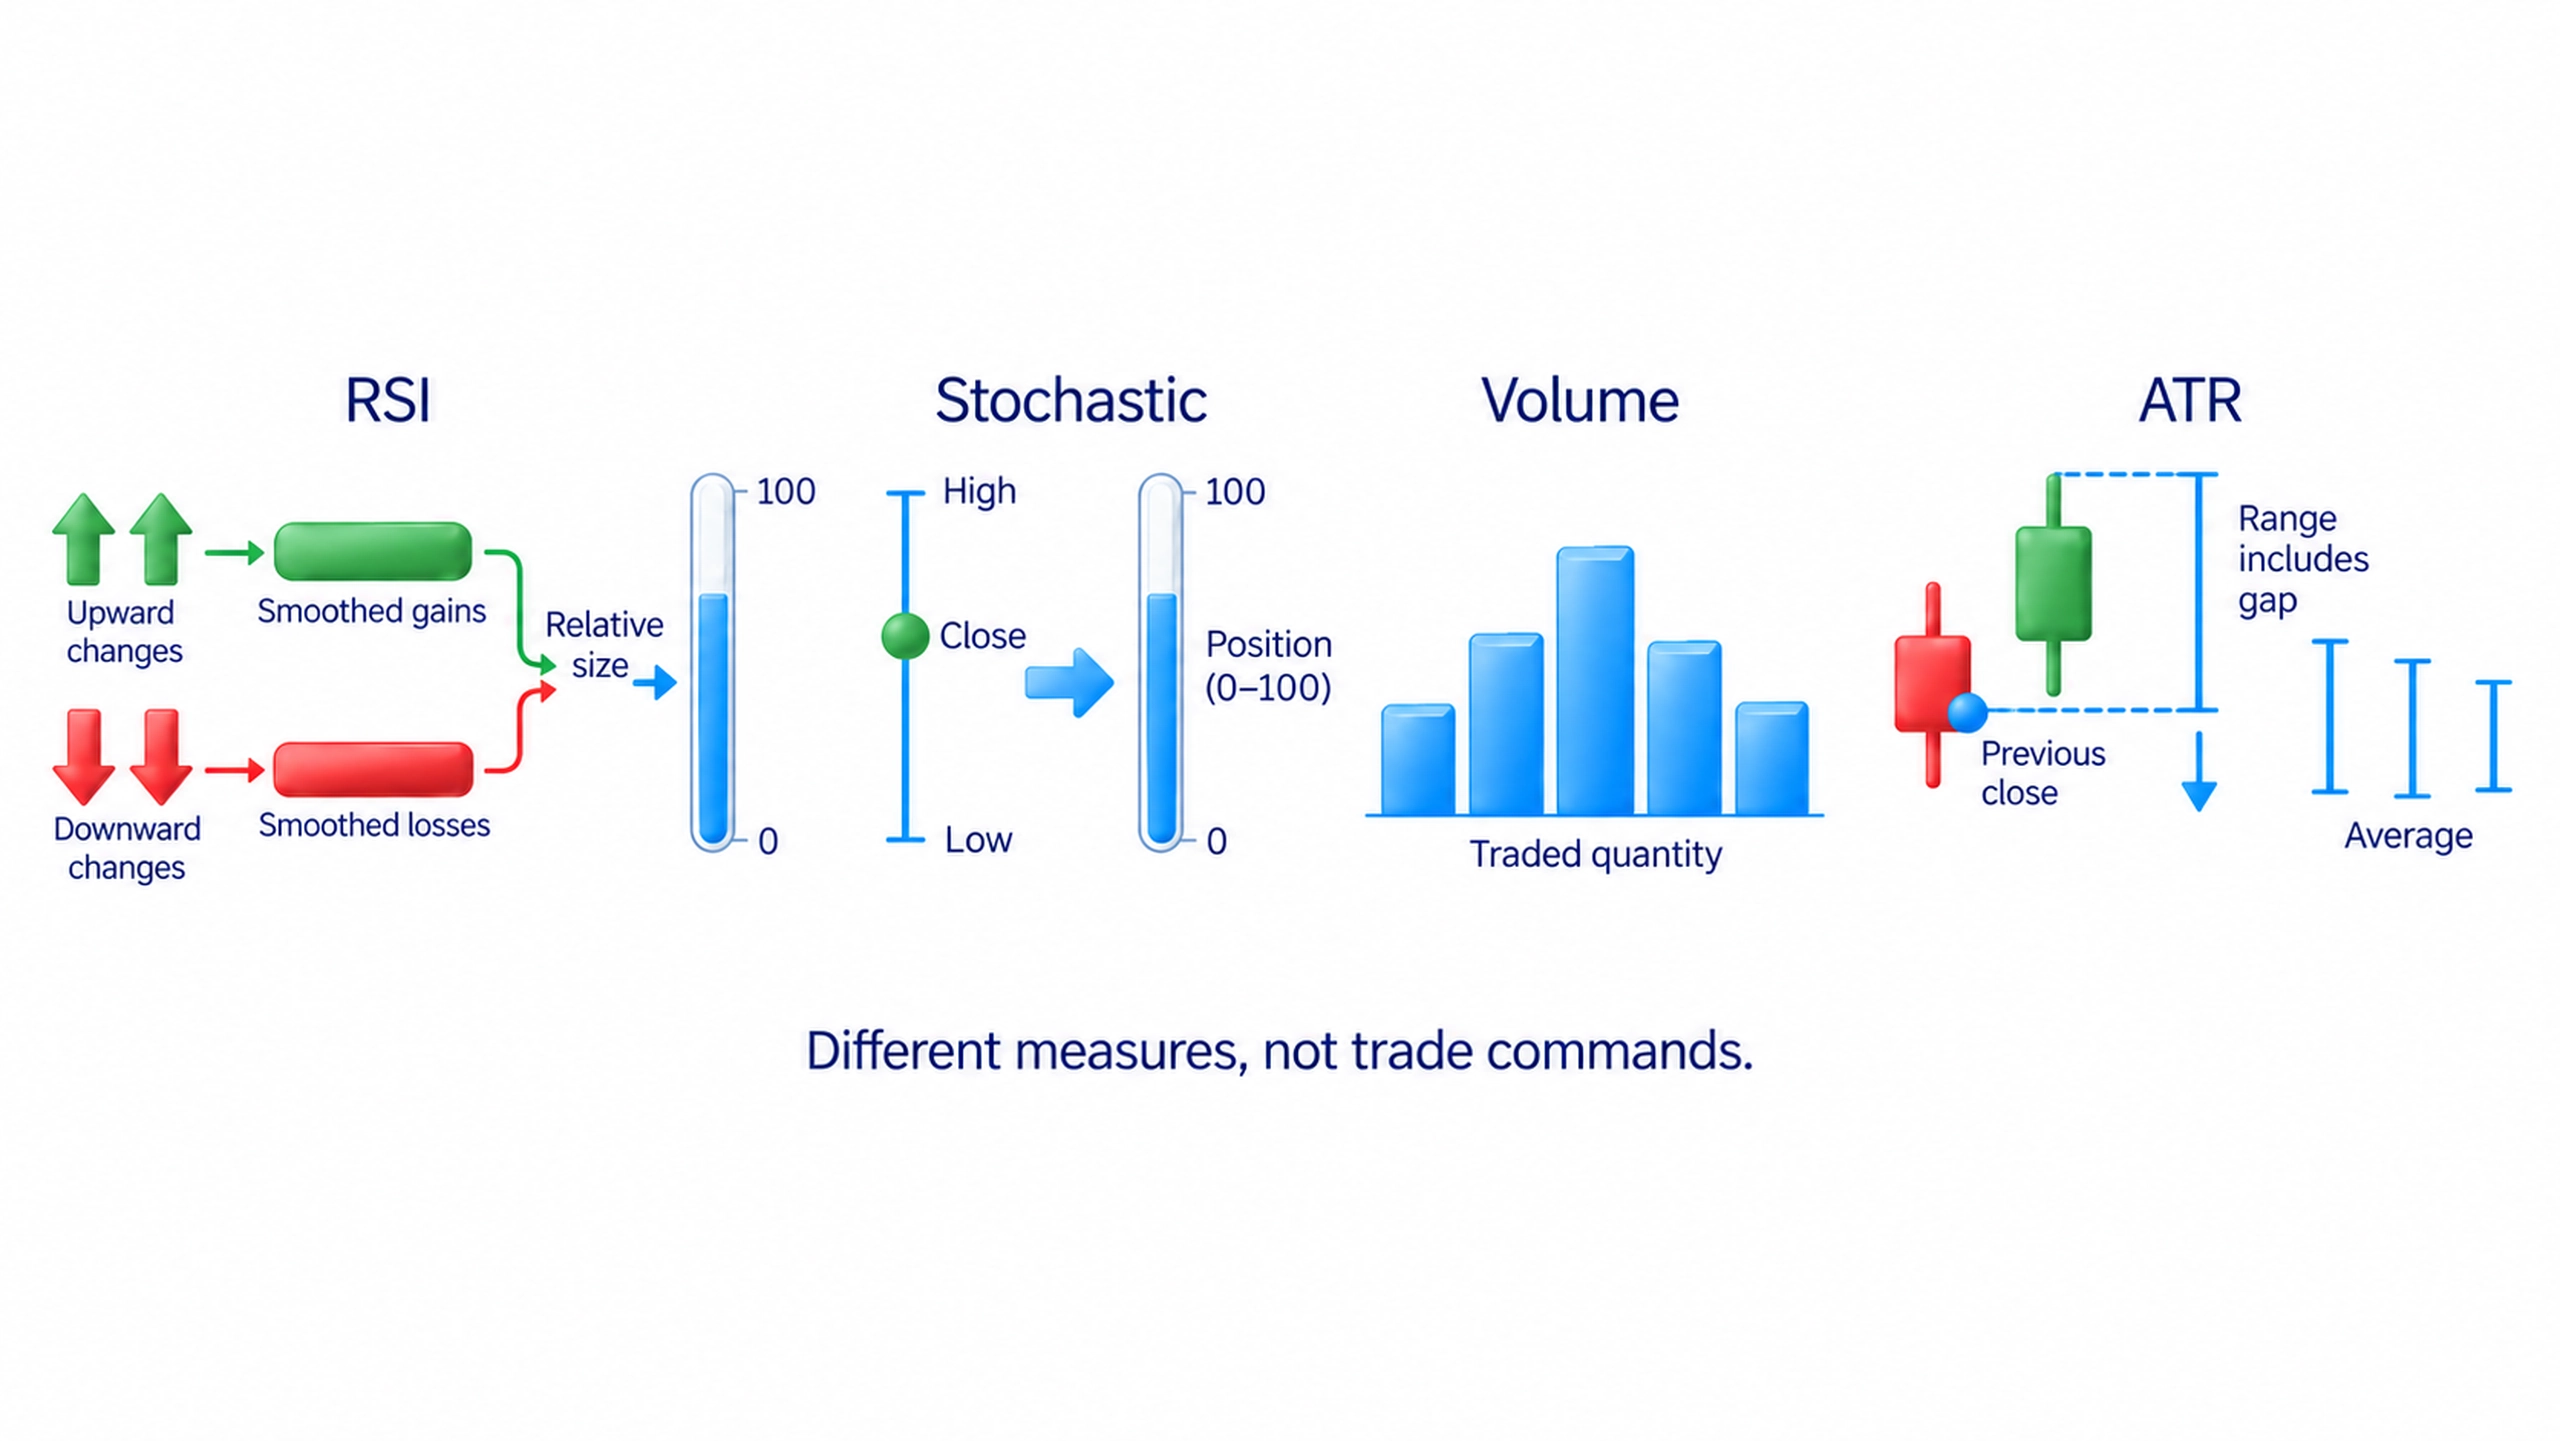
Volatility means the extent of price fluctuations. ATR, Average True Range, averages a range measure that includes gaps between periods and is expressed in price units. It does not show direction. Bollinger Bands are placed around a moving average using the dispersion of selected prices, called standard deviation. Wider bands or a rising ATR describe fluctuations, not a guaranteed continuation of an upward move.
Volume measures the quantity of an instrument traded during a period, such as shares or futures contracts. It does not measure the distance travelled by price. Volume and ATR therefore answer different questions. Total volume also does not identify the participants or prove that a particular institution bought the asset.
Some tools combine several displays. Ichimoku includes lines and a cloud shifted along the chart. Moving a historical calculation forward on the display does not turn it into knowledge of the future. Check which moment the underlying data belongs to before interpreting the line.
Fibonacci levels and Elliott waves require rules for selecting points and labelling price movement. They cannot be assessed solely as ready-made indicator lines. Similarly, an AI model used in trading needs to be checked against its data and conditions of use, rather than accepted because of its technology label.
Why Indicators Lag or Change Their Signals
Price changes before that new observation enters the calculation. Smoothing reduces the effect of individual fluctuations, but also delays the response. A longer period usually produces a smoother line; a shorter period responds more to recent changes. Reacting faster does not automatically make a signal more accurate. It also changes how many fluctuations the tool responds to.
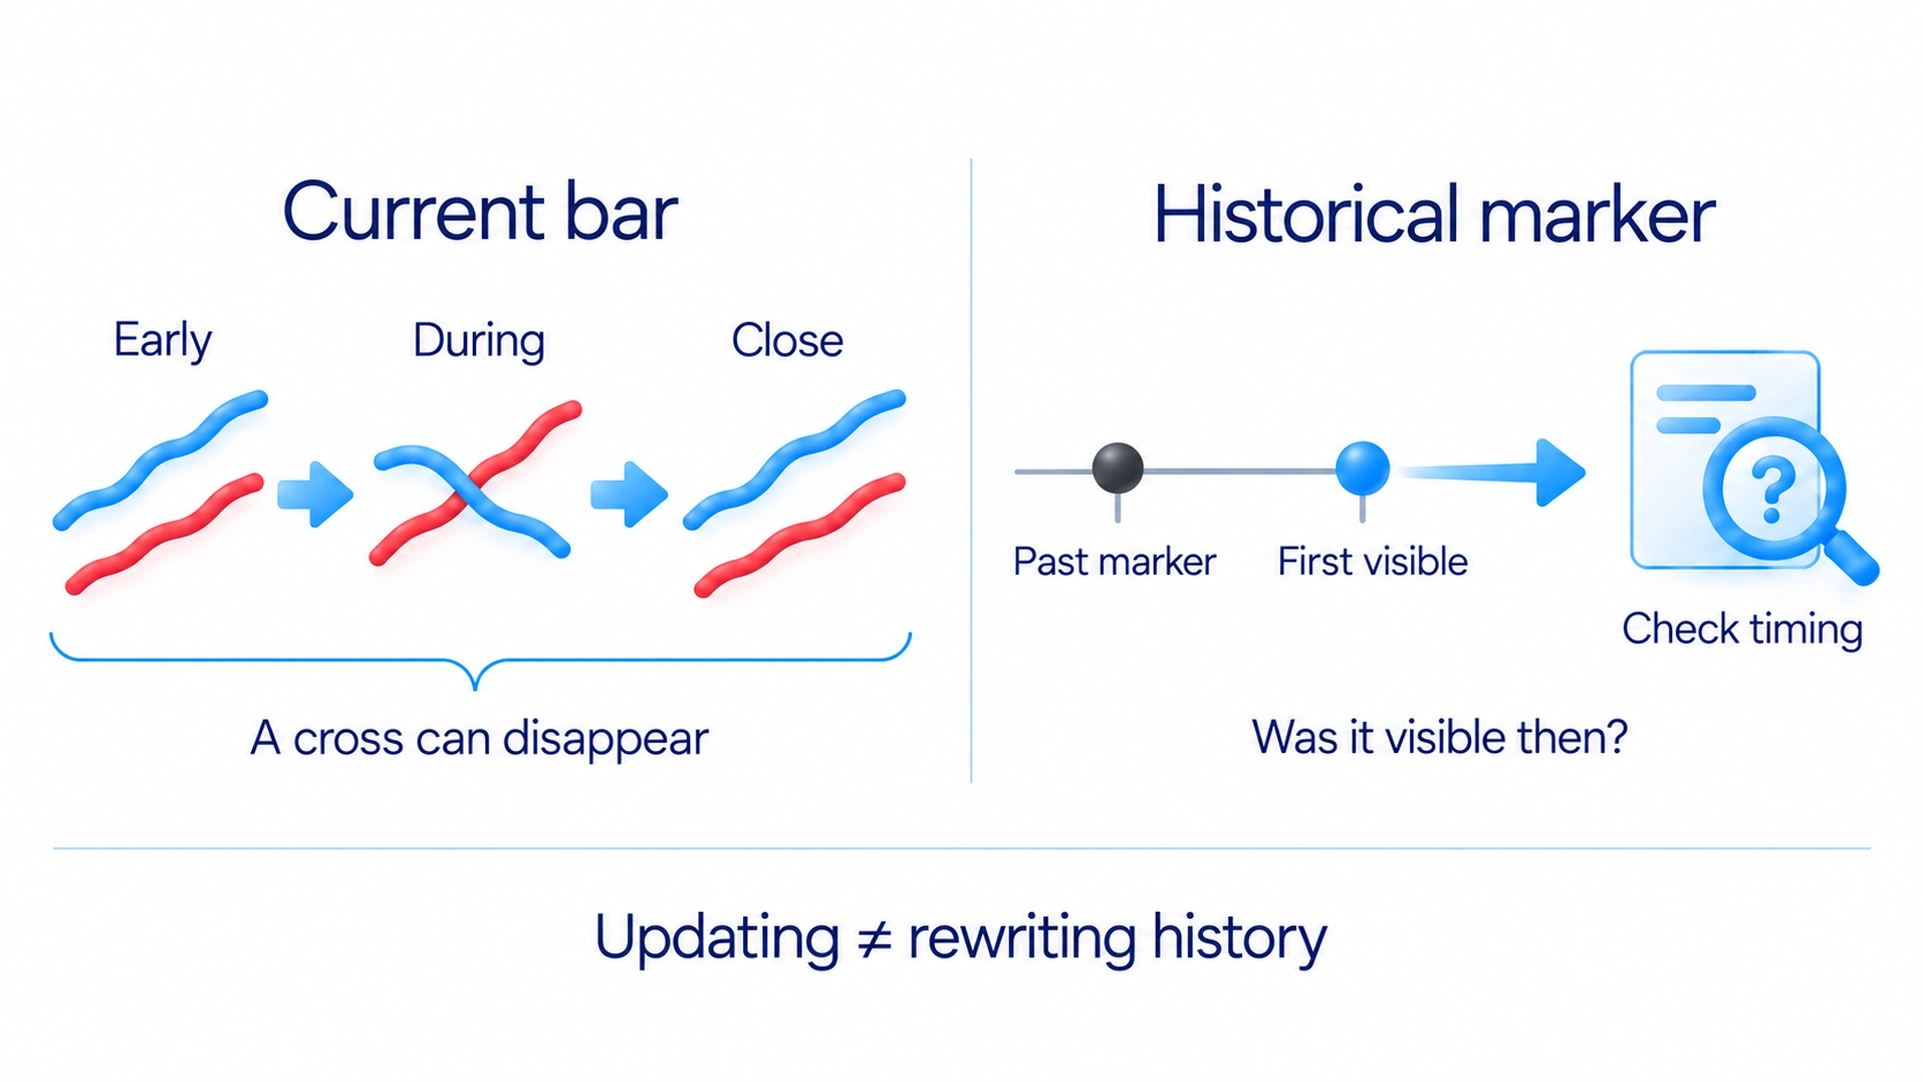
While a candle is still open, its current price, high and low can change. An indicator using those inputs can change too. A crossover visible partway through the bar may disappear before the close. If your rule requires a completed bar, check that completed bar rather than treating its temporary state as confirmation.
This updating differs from moving a previously displayed signal into the past. For a custom script, establish when its marker first became available and whether later data changes historical markers. Well-placed arrows on a finished chart do not prove that you could have seen them when making the decision.
When comparing platforms, check the instrument, price-data source, bar interval, calculation period and smoothing method. Different settings can explain different readings without an error in the formula. Once inputs or settings change, an earlier comparison no longer describes the same conditions.
What Is Divergence?
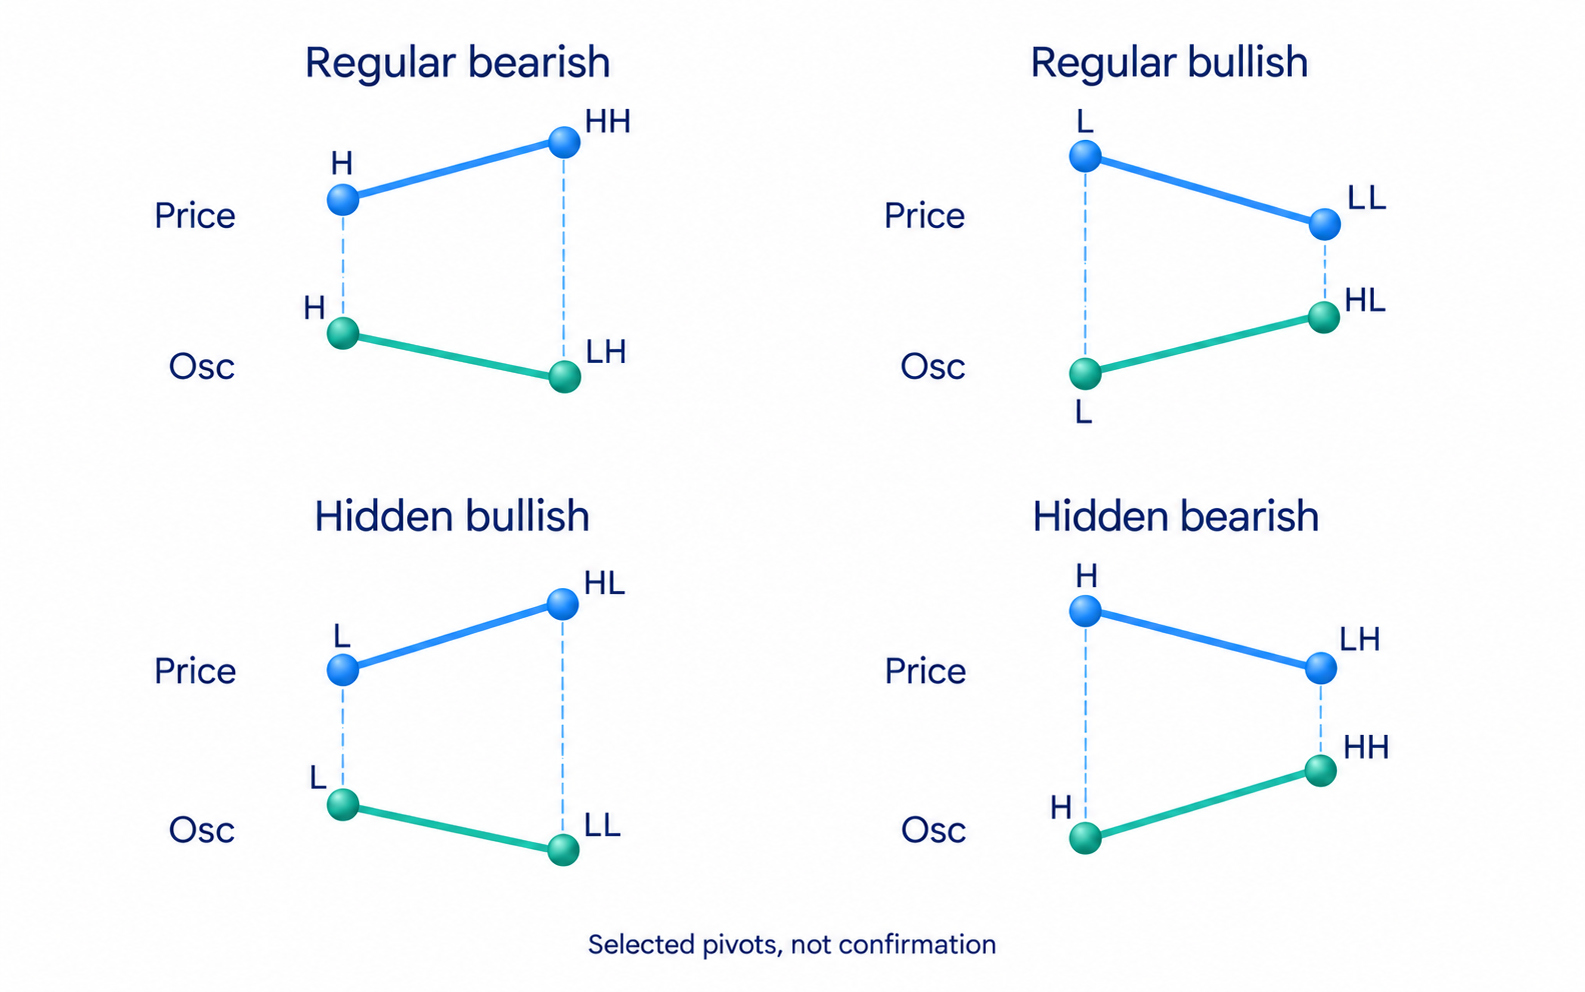
Divergence is a disagreement between corresponding turning points in price and an indicator. In regular bearish divergence, price makes a higher high while the oscillator makes a lower high. In regular bullish divergence, price makes a lower low while the oscillator makes a higher low. Compare readings at the corresponding price peaks or troughs, rather than unrelated points elsewhere on the chart.
Hidden divergence has a different pattern. In its bullish form, price makes a higher low while the oscillator makes a lower low. In its bearish form, price makes a lower high while the oscillator makes a higher high. Traders commonly consider it in the context of continuing movement. “Hidden” does not mean that it reveals secret orders.
The disagreement shows that the selected formula is not confirming the price movement in the same way as before. That gives you a reason to examine the movement more closely. A strong trend can continue through several divergences. Neither regular nor hidden divergence guarantees a reversal or supplies an exact entry price.
For a fair check, mark the points being compared before watching what happens next. Write down what change in price would confirm the idea and what would invalidate it. If that price response does not occur, do not call the signal confirmed simply because the lines disagree. Moving the chosen points after seeing the result prevents an honest comparison.
How to Choose an Indicator
Start with one clear question. Do you want to smooth price, measure its fluctuations or compare the strength of closing-price increases and decreases? Choose a tool for that question, read its definition and inspect several completed bars to see which changes in data affect its reading. Several similarly constructed lines do not necessarily improve the answer.
In my course’s chapter on indicators, I explain why I use this order. I spent several years looking for an indicator to help me forecast the market, then gave indicators a supporting role. My analysis starts with price behaviour, the structure of the movement and volume. In the course’s practical discussion of levels, a strong move is followed by narrower bars and a check of the response at a local level. An indicator does not replace that sequence.
Within this approach, a crossover or divergence is considered alongside price and its response at a level. Volume helps compare trading activity, and the permitted loss is decided before entering. This is the general sequence explained in the course, not a separate RSI or MACD strategy. Why indicators lag provides an optional practical explanation of calculation delay.
Before practising, record the signal’s exact conditions: settings, a completed or current bar, price confirmation and the condition that cancels the idea. Check all cases using the same rules, including unsuccessful ones. A change of settings that improves only already-known examples does not demonstrate usefulness on new data. This lets you test a specific role for an indicator instead of repeatedly searching for the “most profitable” line.
Frequently asked questions
They calculate from available market observations. Smoothing reduces individual fluctuations but delays the response. That is a property of processing the data, not a promise of accurate prediction. Readings using an unfinished bar can still change before it closes.
A crossover describes an indicator condition, not a complete trade plan. In Arapov’s approach, the decision also considers price, its response at a level, volume and the loss permitted before entry. The indicator alone does not specify all those conditions.
It is a disagreement between corresponding turning points in price and an indicator. For example, price makes a higher high while the indicator makes a lower high. The disagreement does not guarantee a reversal.
A weaker indicator reading does not necessarily end a strong trend. Define the required confirmation in price and the condition that cancels the idea before acting. A disagreement alone is not confirmation that the market has turned.
Volume measures the quantity traded in the selected instrument and data source. ATR (Average True Range) averages a price-range measure that includes gaps between periods. Volume describes trading activity, while ATR describes price fluctuations; neither identifies the participants.
About the author
Igor Arapov, practising trader since 2013 and author of the ArapovTrade library. ORCID: 0009-0003-0430-778X.




