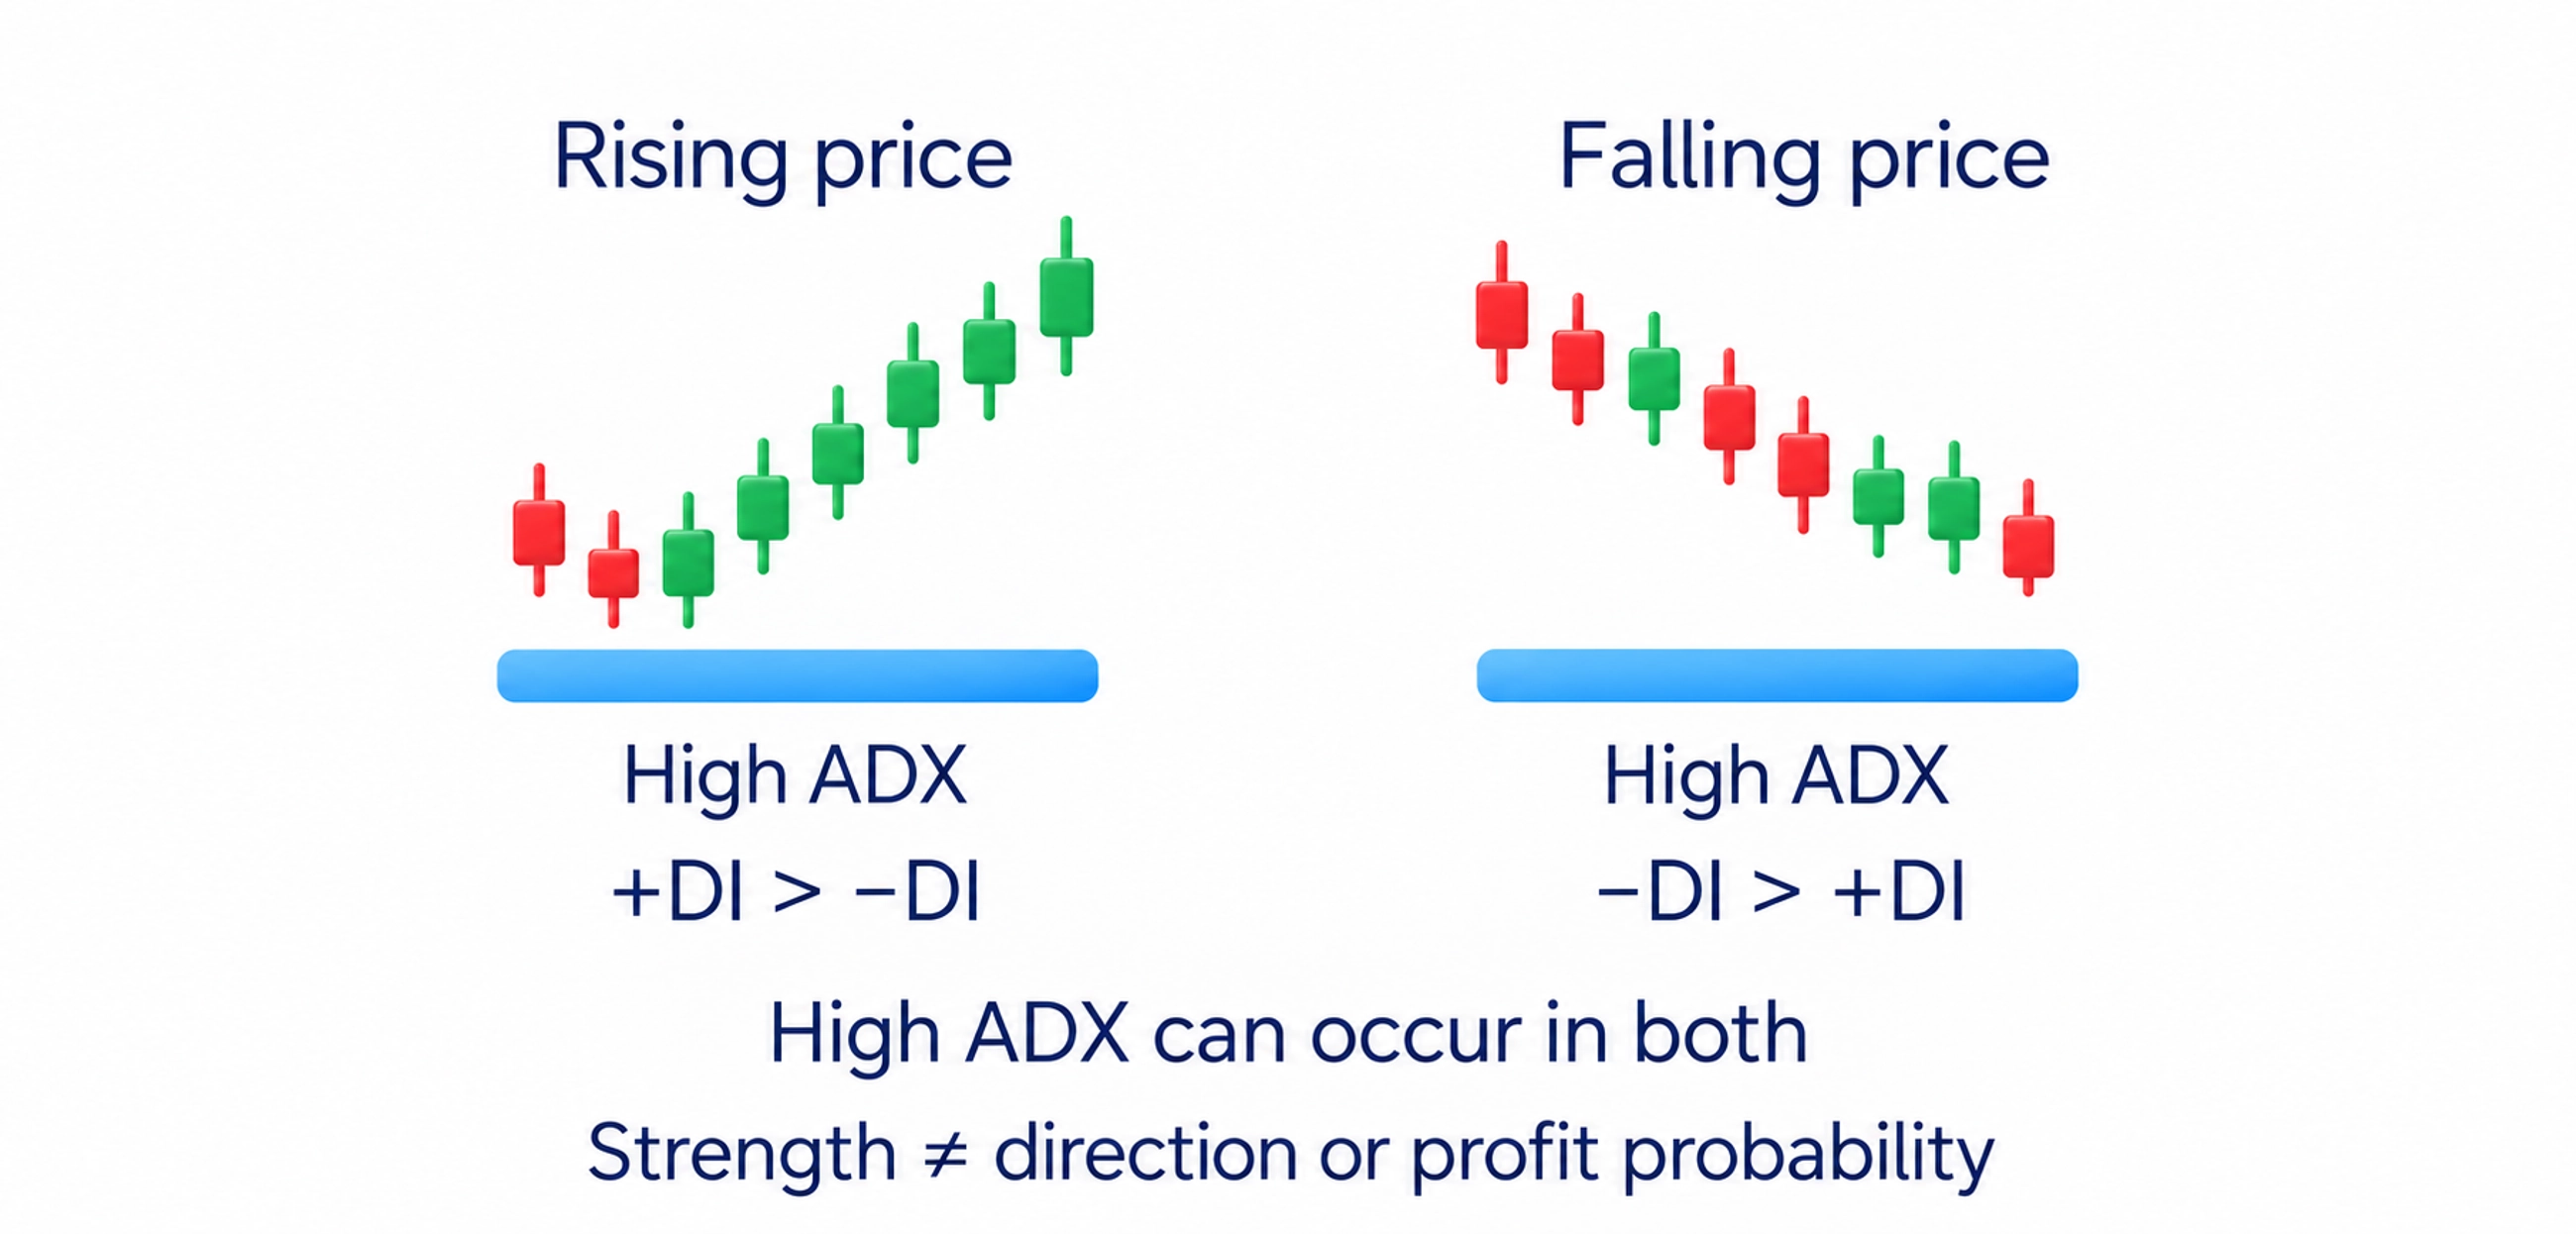
The Average Directional Index (ADX) measures how strongly price has moved in one direction over the selected data. It does not choose that direction. ADX can be high during a rise or a fall, and its reading does not give the probability that the next trade will succeed.
What ADX shows and how it differs from DI
Welles Wilder introduced ADX as part of his directional movement system. Charts often show three lines together: ADX, the positive directional indicator +DI and the negative directional indicator −DI. The collection is commonly called DMI. ADX uses a scale from 0 to 100; a reading of 30 is neither a 30% price gain nor a 30% chance of profit.
The DI lines come from changes in neighbouring bars’ highs and lows. A bar represents one chart period. When +DI is above −DI, upward movement dominates that calculation; when −DI is above +DI, downward movement dominates. These lines do not measure the money held by buyers and sellers or reveal their intentions.
ADX smooths the relative difference between those lines without keeping its directional sign. It can therefore rise while price falls. Check direction separately, using the DI lines and the sequence of price highs and lows explained in the chart-reading guide.
How ADX is calculated
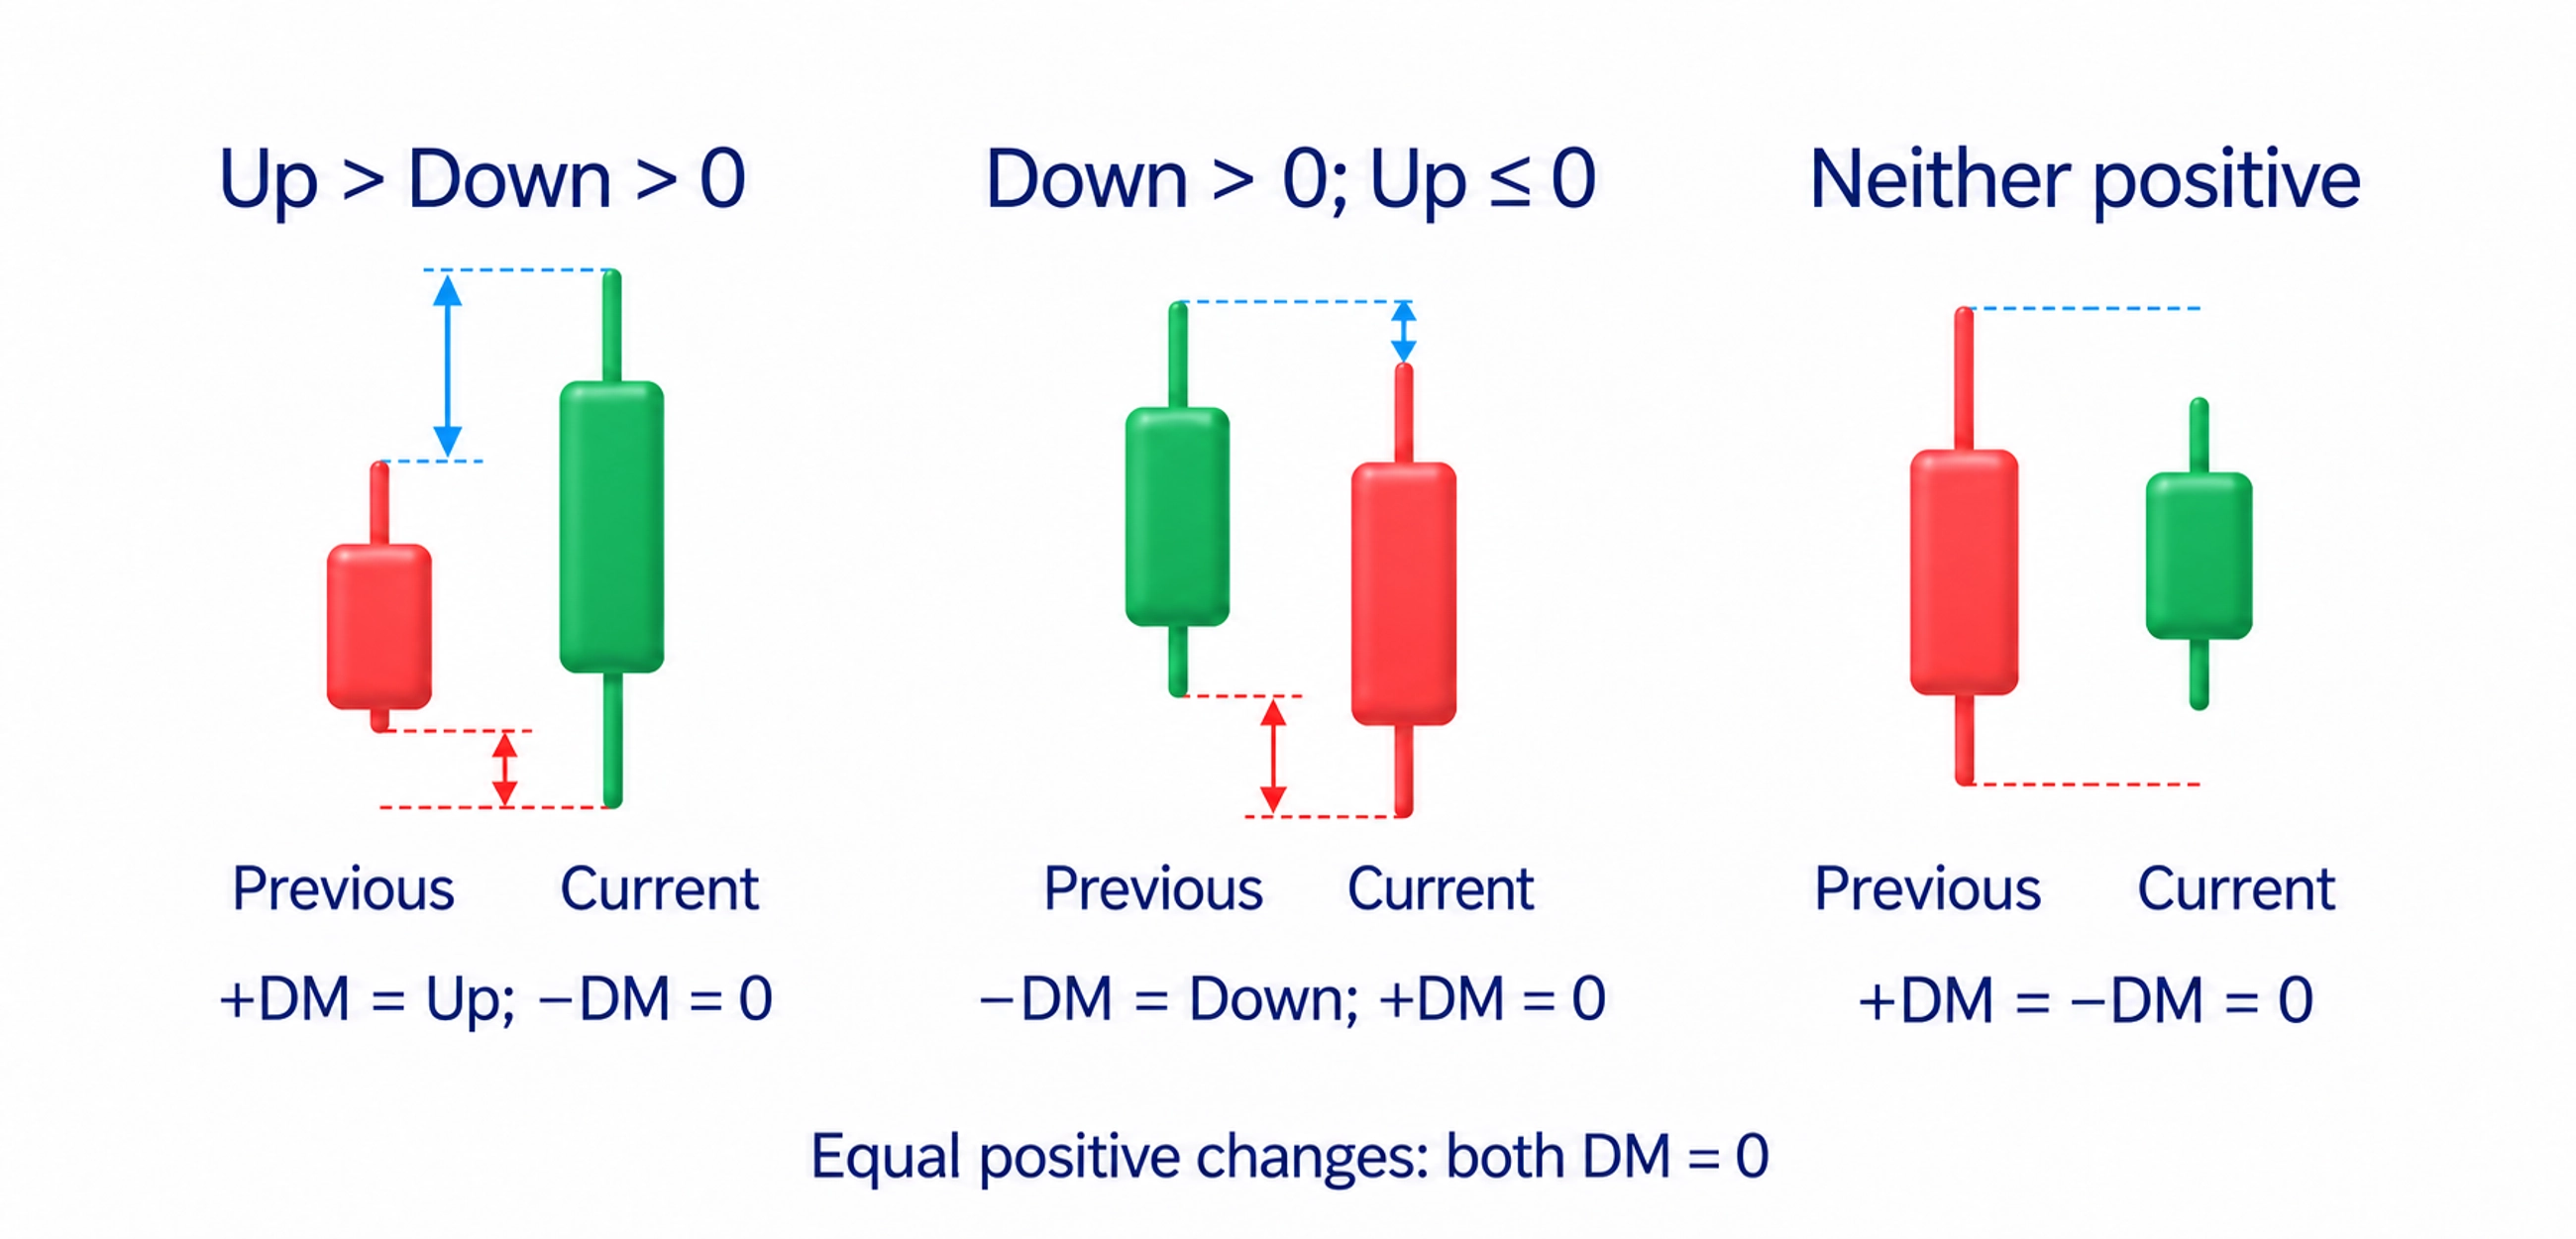
First compare two changes: how far the current high exceeds the previous high, and how far the current low falls below the previous low. Keep the larger positive change. If the rising high wins, it supplies positive directional movement, +DM; if the falling low wins, it supplies negative directional movement, −DM. Set the other value to zero. If the changes are equal, or neither is positive, both values are zero.
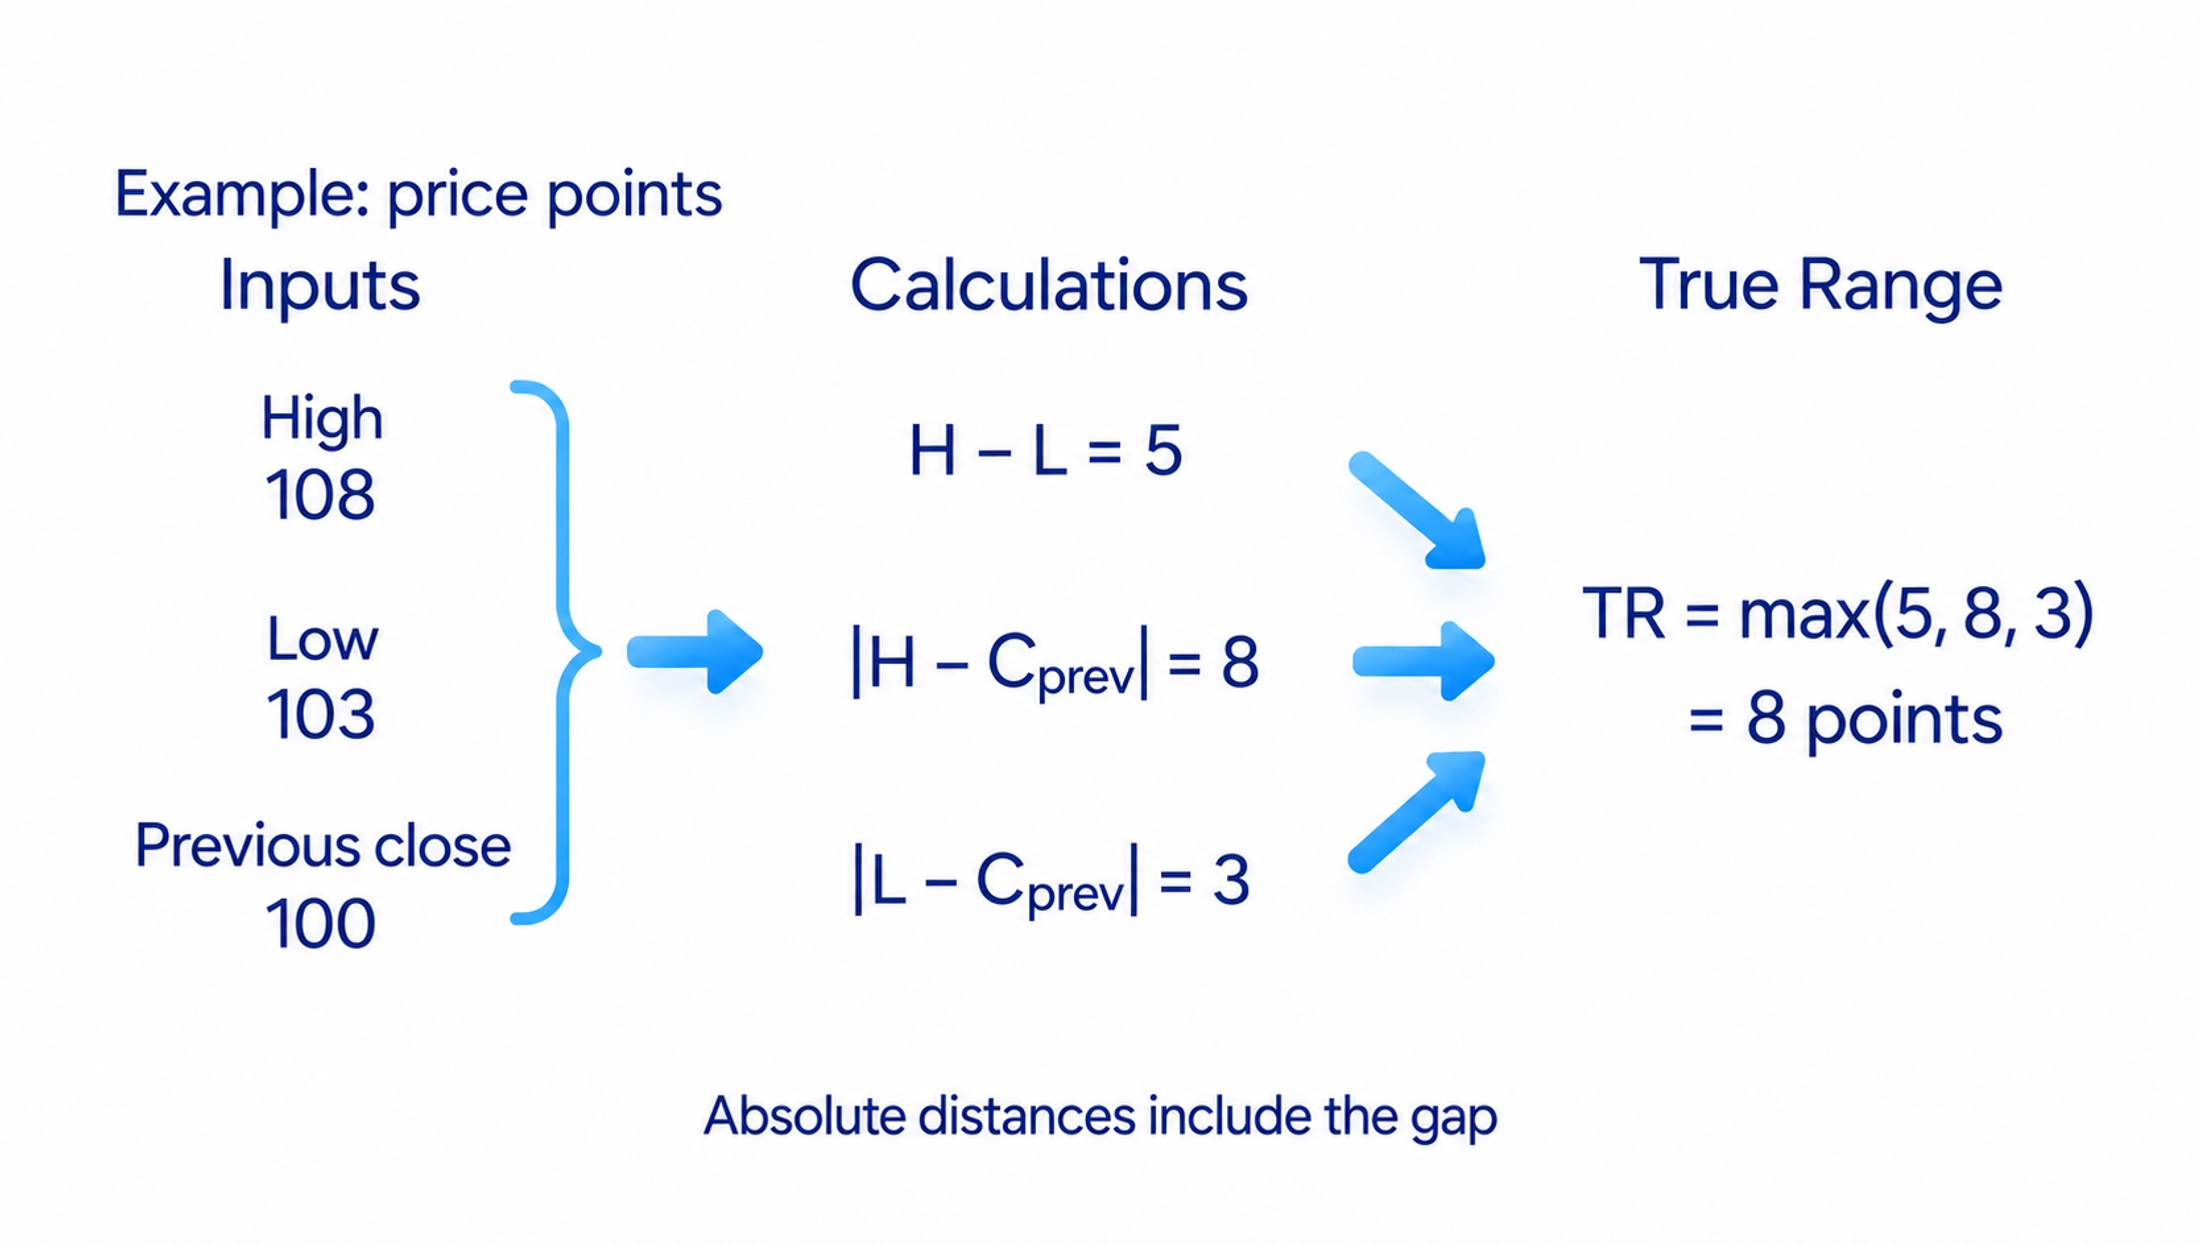
Next calculate true range, or TR. Take the largest of the current high minus the current low, the absolute distance between the current high and the previous close, and the absolute distance between the current low and the previous close. Absolute distance means ignoring the sign. This includes a price gap from the preceding close rather than considering only the new bar’s high-to-low range.
Smooth +DM, −DM and TR to reduce the influence of a single bar. Divide smoothed +DM by smoothed TR and multiply by 100 to obtain +DI; do the same with smoothed −DM to obtain −DI. True range also underlies Average True Range (ATR), but ATR describes the size of price fluctuations, whereas ADX describes directional movement.
The intermediate directional index, DX, measures the DI difference relative to their sum: DX = 100 × |+DI − (−DI)| / (+DI + (−DI)). The vertical lines mean absolute value. Although −DI has a minus sign in its name, its value is nonnegative. If both DI values are zero, the denominator is zero; check how your platform handles that undefined calculation.
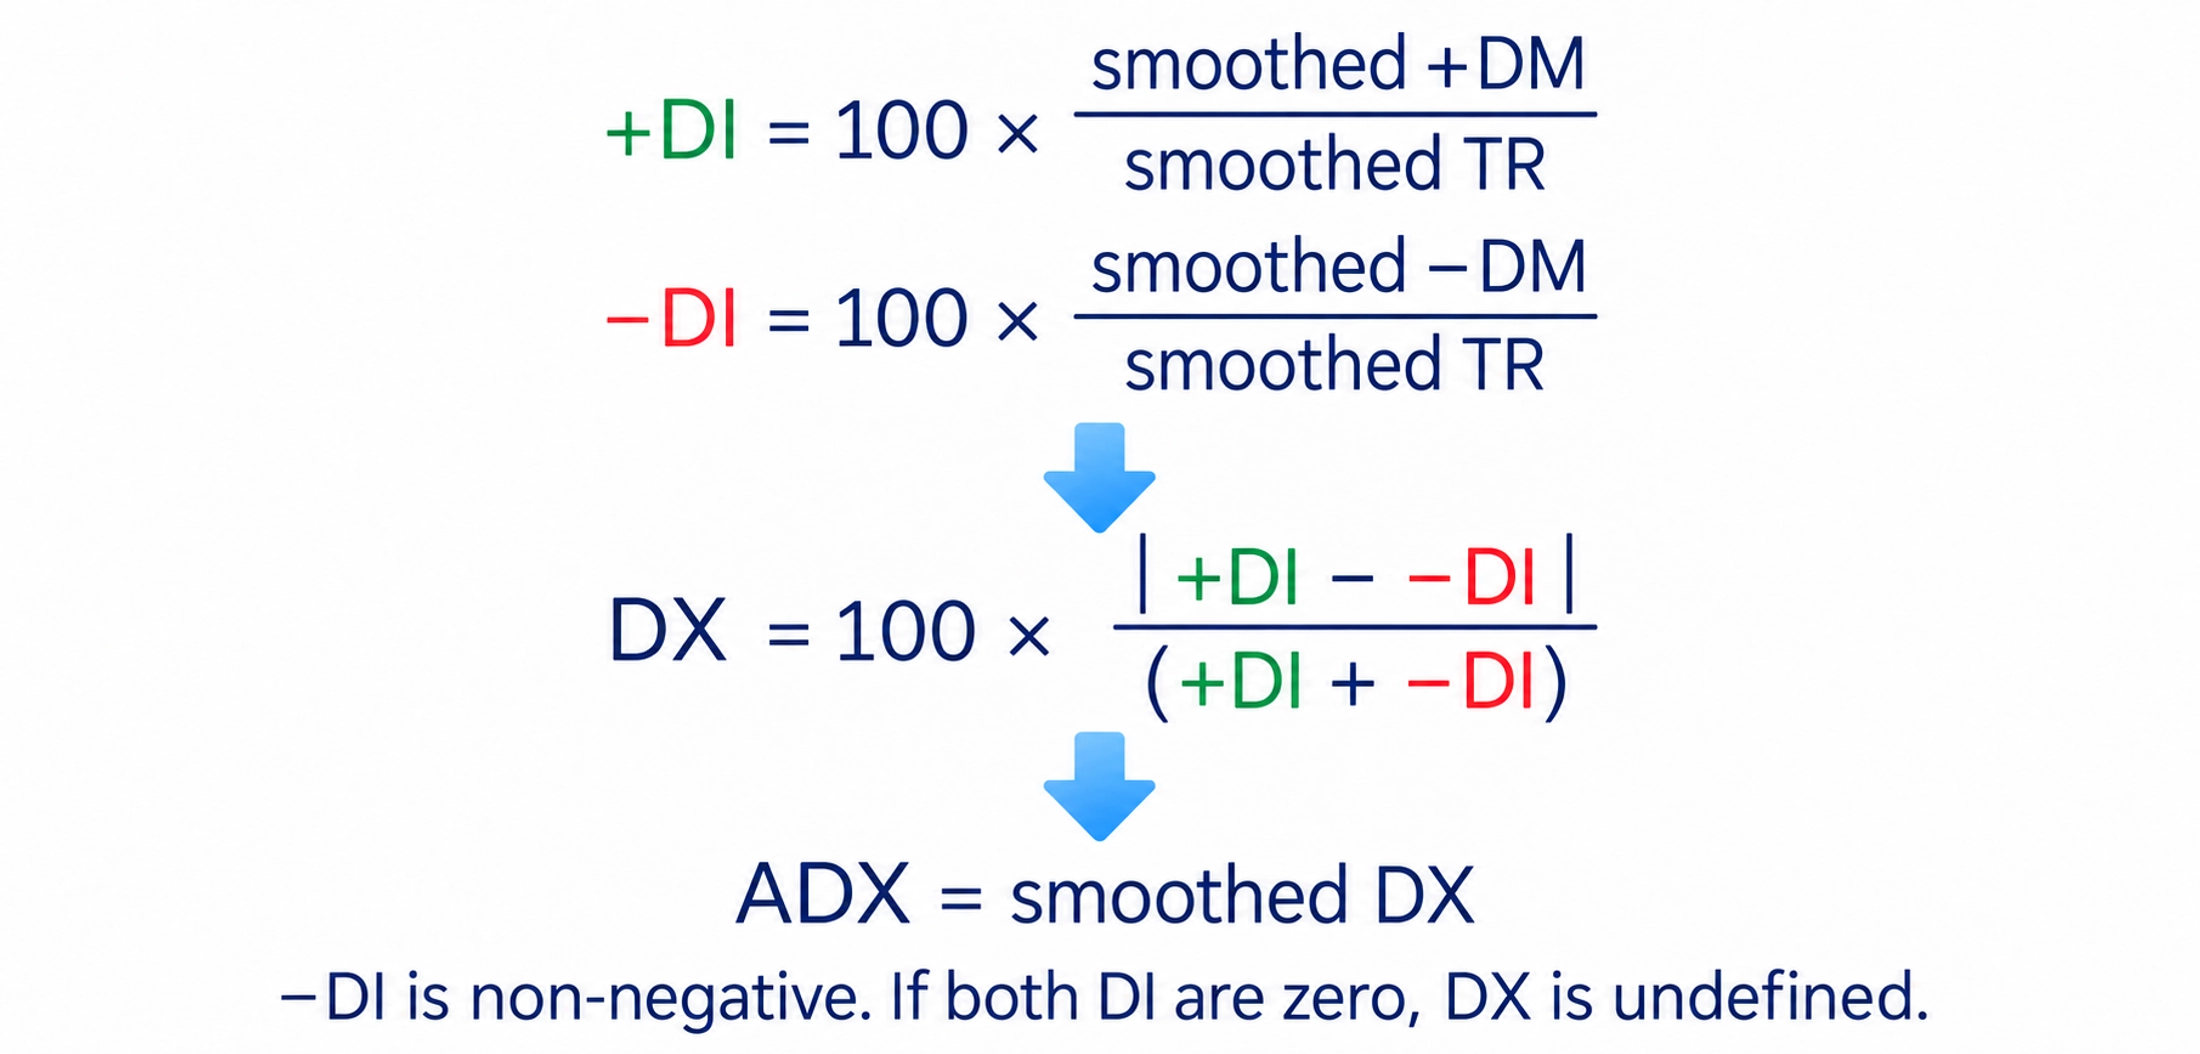
ADX smooths a series of DX readings. In Wilder’s calculation, the initial ADX is the mean of the first available DX readings for the selected length. With a length of 14, each subsequent reading is (previous ADX × 13 + new DX) / 14. One new reading therefore replaces only part of the earlier information.
Example: why DX and ADX differ
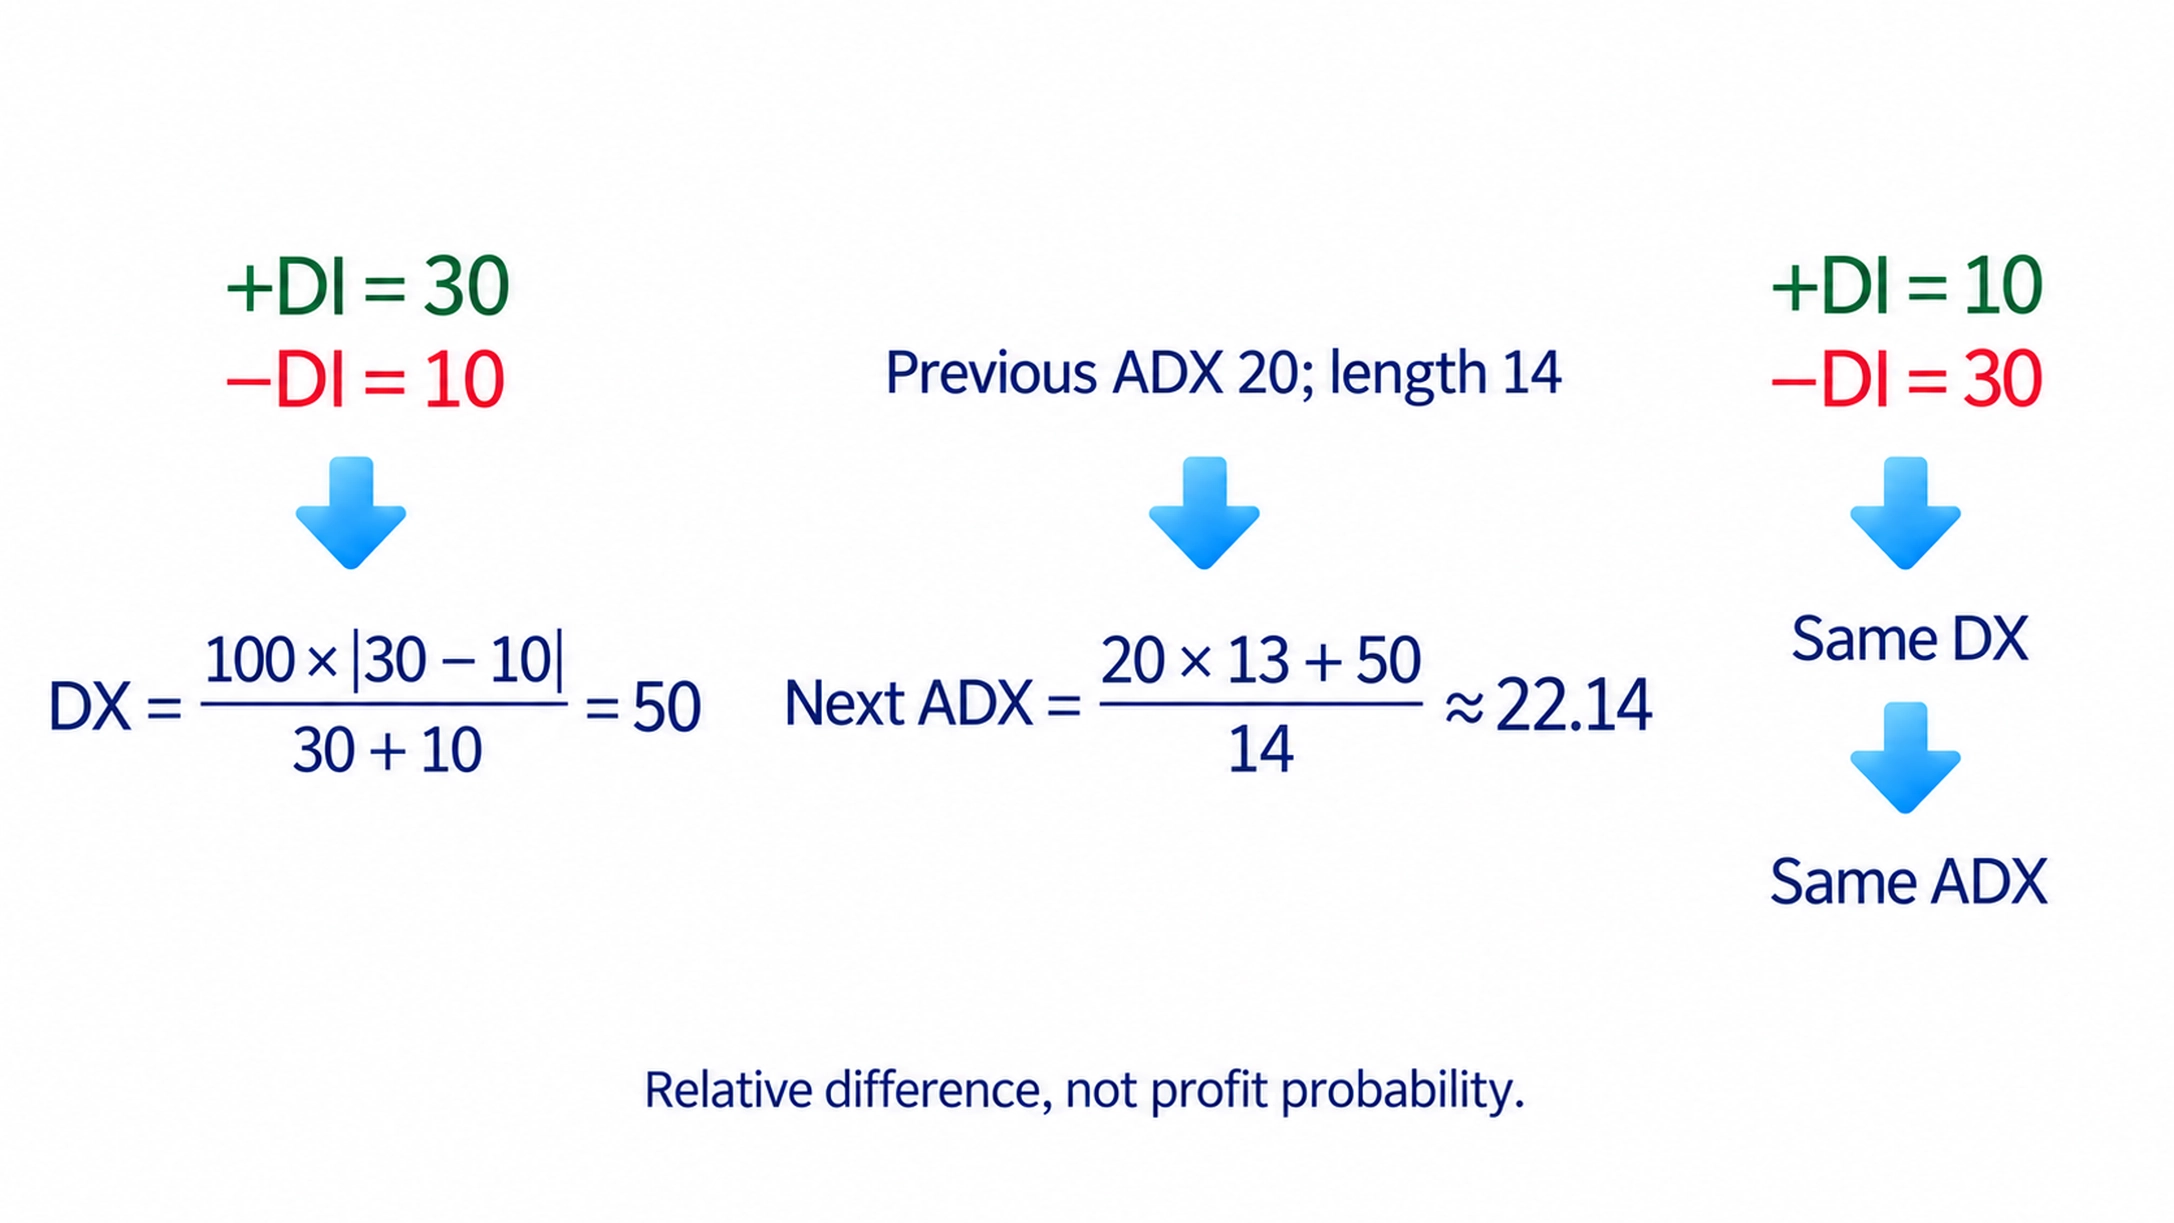
Suppose the illustrative DI readings are +DI = 30 and −DI = 10. Their difference is 20 and their sum is 40, so DX = 100 × 20 / 40 = 50. This number describes the relative gap between the two indicators, not a price return or a trading probability.
If the preceding 14-period ADX was 20, its next value is (20 × 13 + 50) / 14, approximately 22.14. The current DX is 50, but the smoothed ADX remains much lower. Swapping the two DI readings leaves DX and ADX unchanged while reversing which direction dominates. This is why ADX strength and price direction must be read separately.
What ADX levels 20, 25 and 40 mean
Readings below 20 are commonly used as a guide to weak directional movement; readings above 25 as a guide to a pronounced trend. The area between them is often left undecided. These are conventional interpretation levels, not boundaries at which the market suddenly changes its behaviour. Their usefulness depends on the instrument, chart period and settings.
A reading above 40 describes strong directional movement in the calculation. It does not prove that the move is exhausted, and it does not justify entering at any price. A high ADX can persist while a trend continues. After a rapid change in price direction, the smoothing can still contain part of the earlier movement.
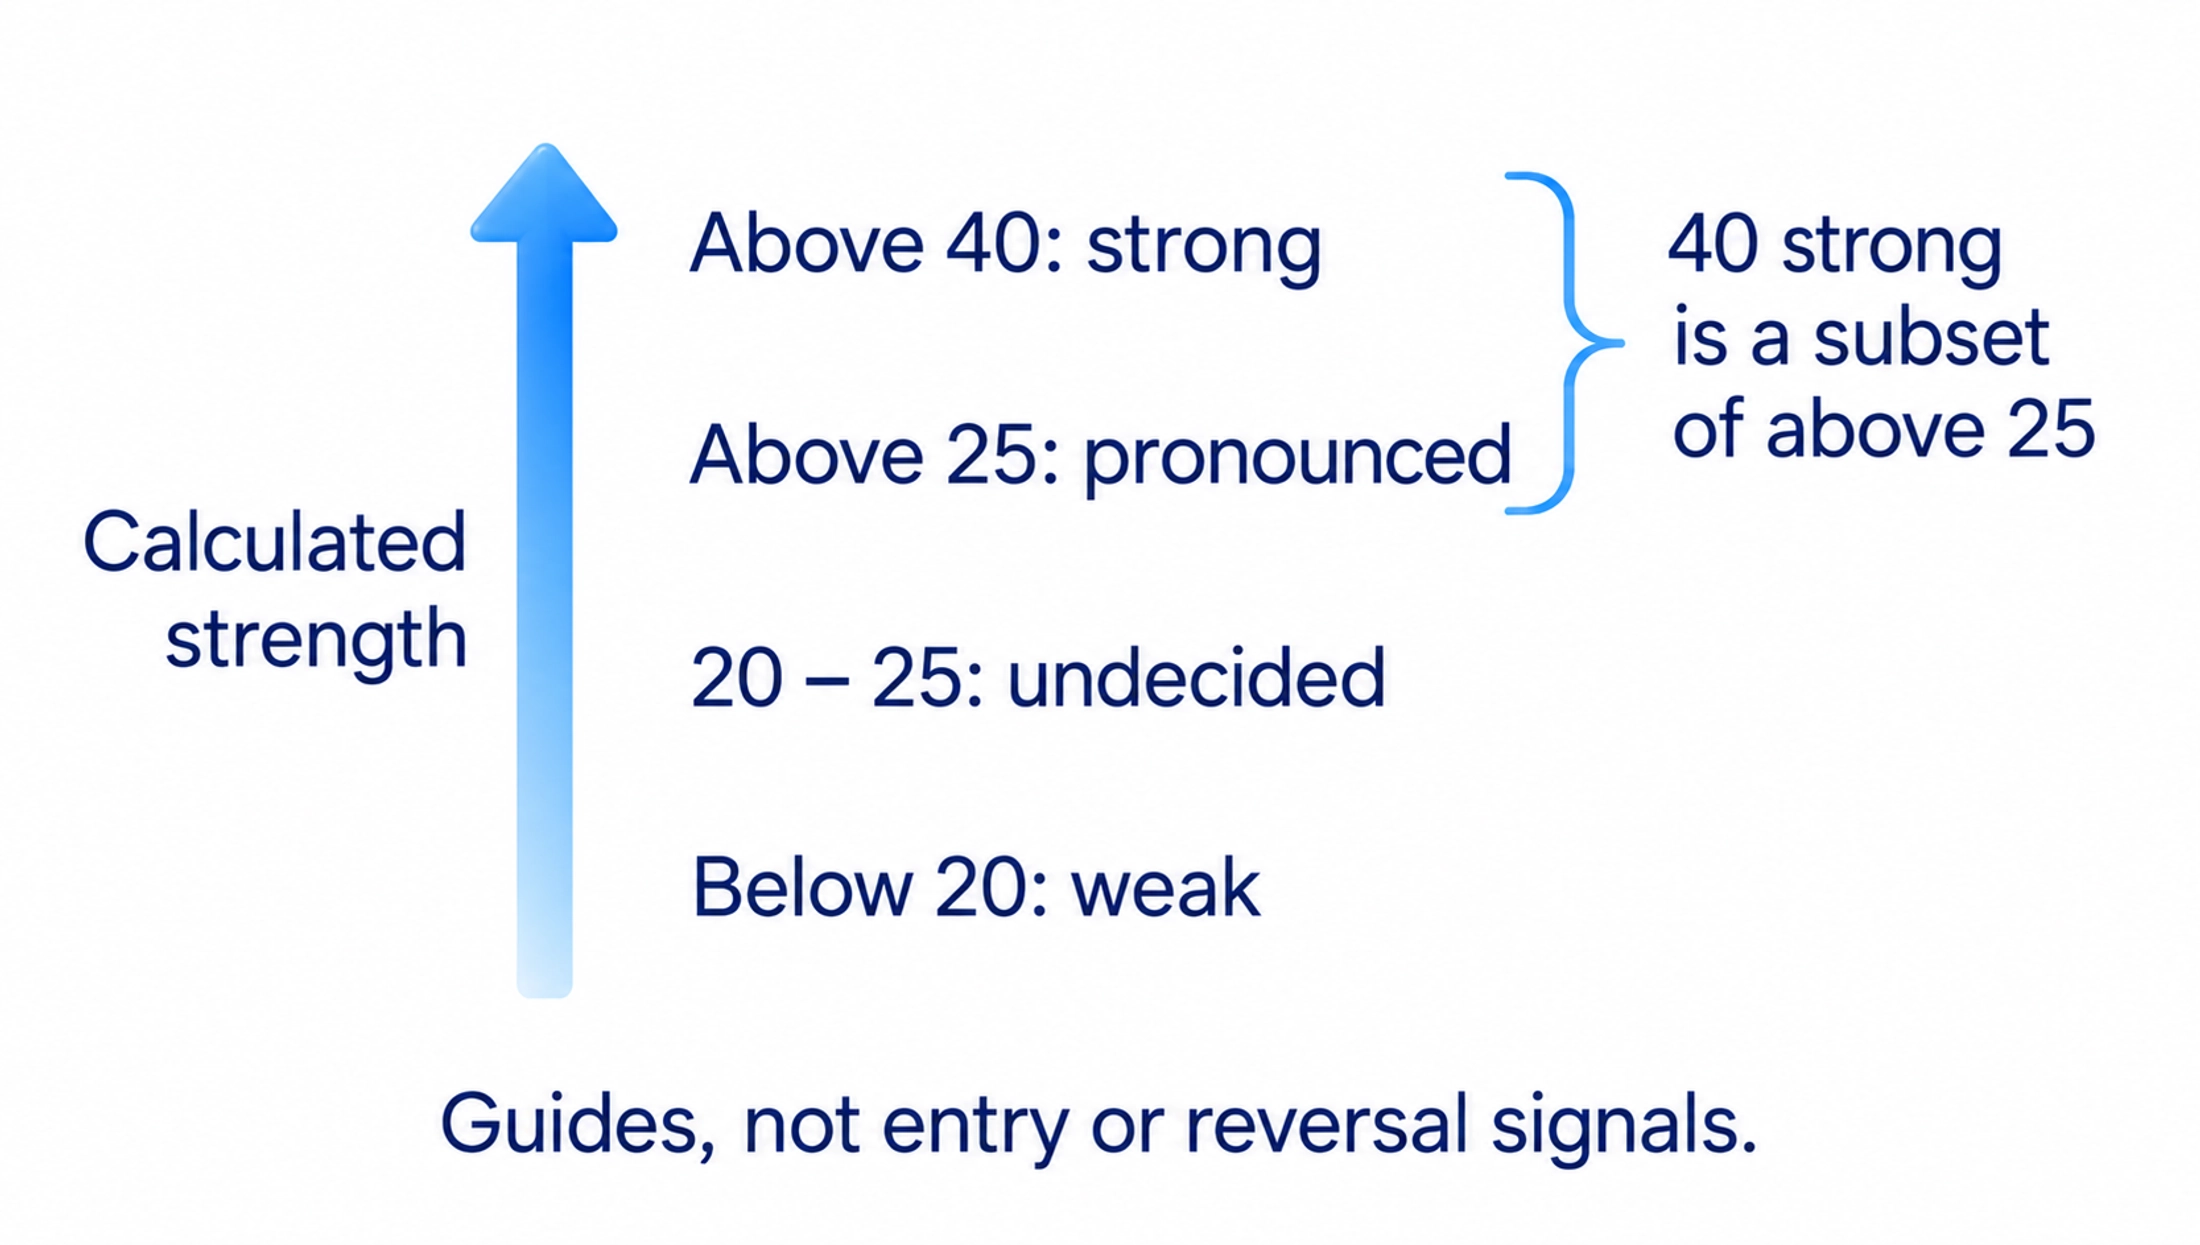
Read the level and the slope separately. ADX can fall from a high value while price continues in the same direction: the smoothed difference between DI values has decreased. That is not a reversal signal by itself. Low ADX also does not mean motionless price; substantial swings in both directions can produce little directional dominance.
ADX length and settings on different charts
A common starting length is 14. This means 14 bars on the selected chart, not necessarily 14 days. Hourly and daily charts contain different price sequences, so their readings can disagree without either being wrong. An hourly pullback can occur within an ongoing daily trend.
A shorter length usually makes the line react more quickly; a longer one increases smoothing. Faster does not automatically mean more accurate, and a smoother line is not automatically more reliable. There is no best length for every market. The moving-averages guide explains how smoothing balances recent changes against earlier data.
Check the actual indicator implementation. TradingView offers standalone ADX and a DMI display with all three lines; DMI has separate lengths for DI calculation and ADX smoothing. MetaTrader also distinguishes its ordinary ADX from ADX Wilder. To compare readings, match the price source, chart period, parameters and enough preceding history for the calculation to settle.
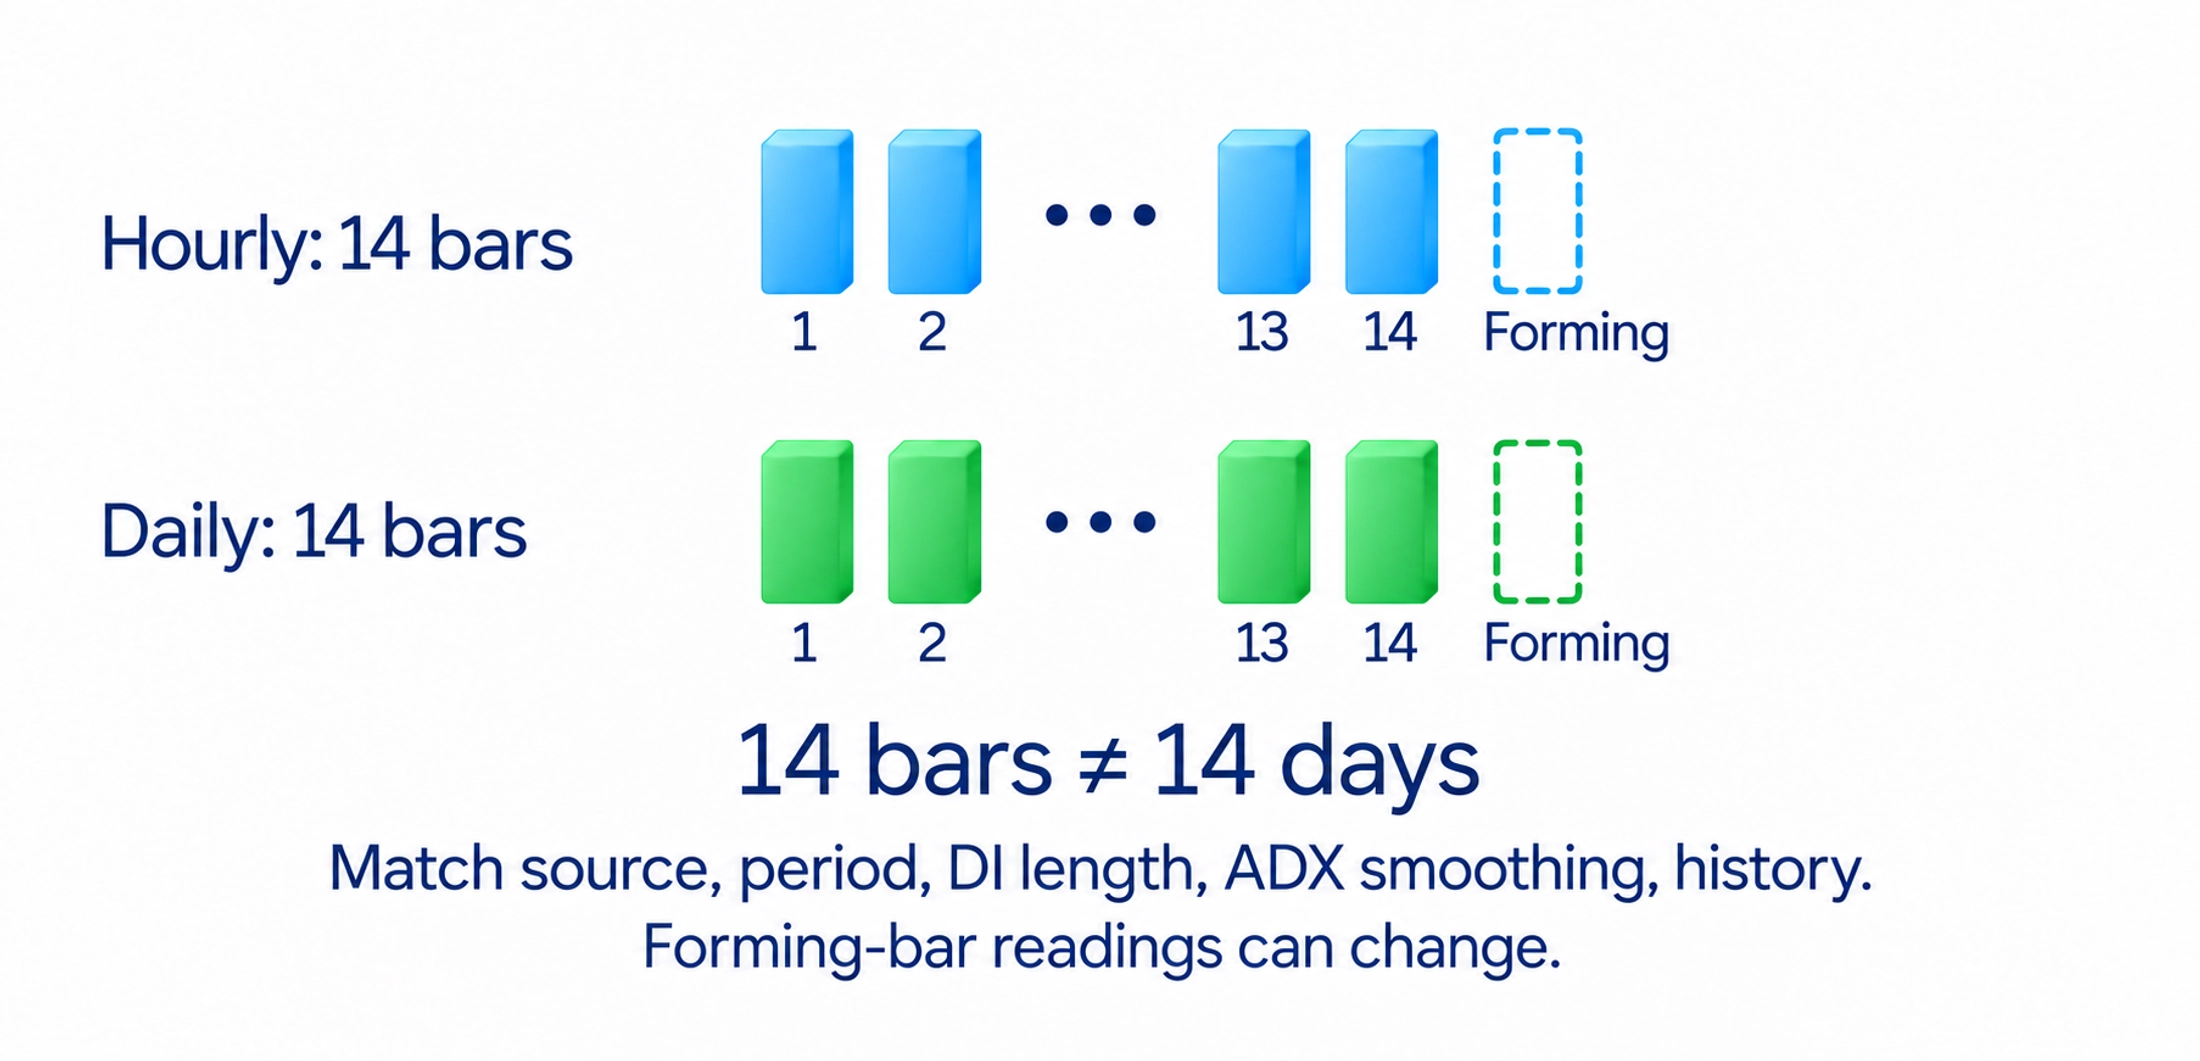
The reading on an unfinished bar can change as its high and low develop. If your rule is evaluated at the close, use completed bars. A historical chart otherwise shows a final reading that was not yet available at the assumed decision time.
Using ADX as a trend filter
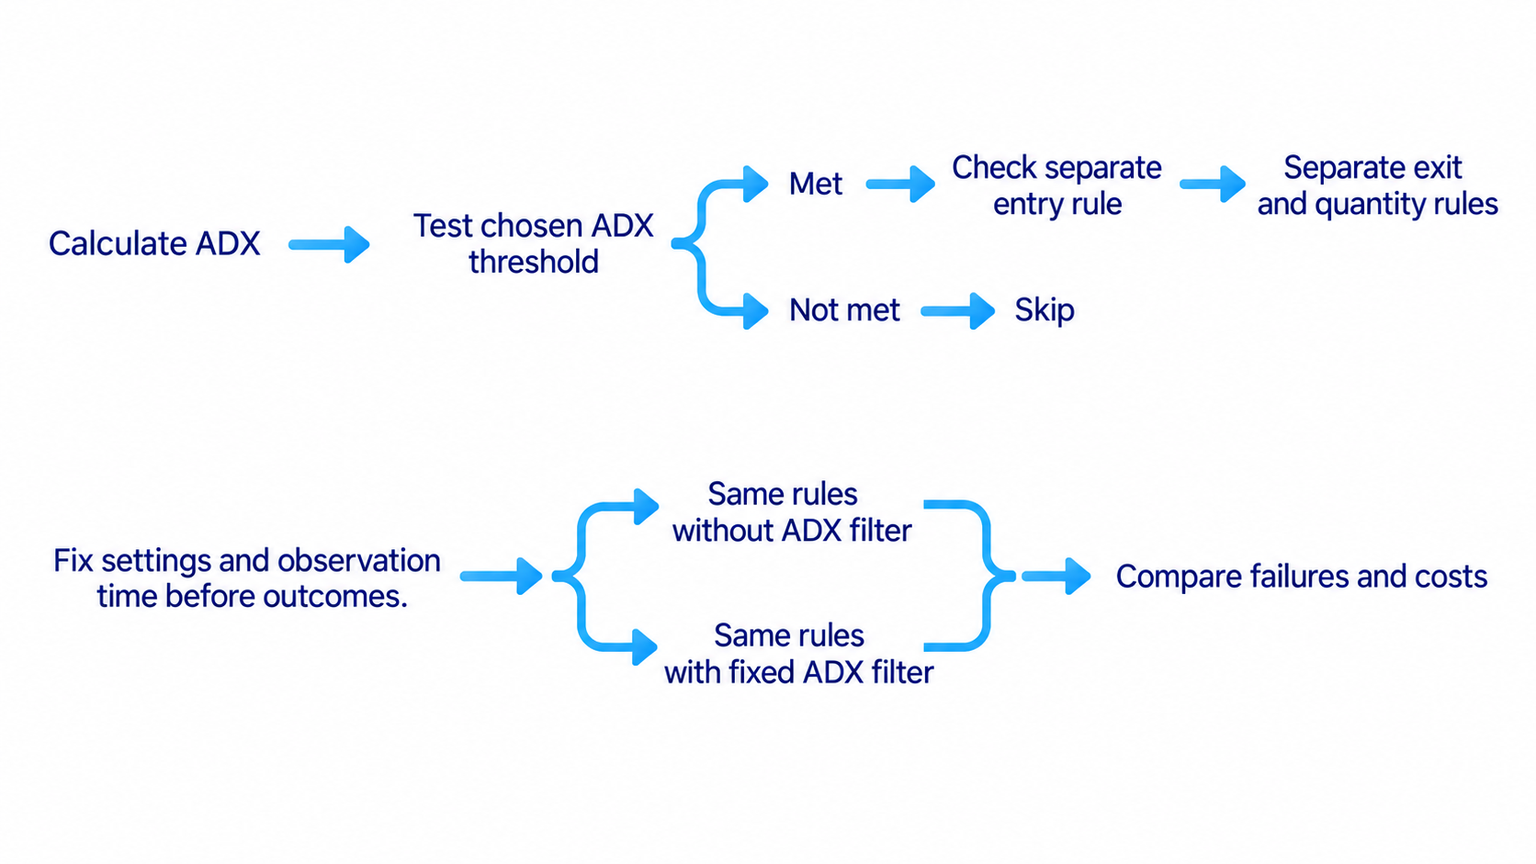
A filter determines when you consider an entry rule. For example, requiring ADX above a chosen threshold restricts that search to periods of stronger calculated direction. The entry condition remains separate. ADX does not show the distance to a nearby price level or set the money you may lose; the risk-management guide explains that calculation.
A +DI and −DI crossing changes which line is higher. Crossings can repeat during sideways swings. An ADX threshold may exclude some of those cases, but its delay can also exclude the start of a useful move. Adding the filter cannot be assumed to improve every strategy. The breakout guide explains the price conditions when a move passes a range boundary.
In the course’s section on indicators, I explain why I do not begin with a search for the perfect line. My approach starts with price structure, levels and trading volume, the quantity traded in the selected data source. An indicator can support that reading. This is the course’s general role for indicators, not a separate personal ADX trading system.
The optional video on indicator lag adds a practical explanation of why a calculated signal follows received prices. For this written lesson, the first action is to describe the price movement and then compare it with ADX. A number does not replace observing a new price high or low.
To test a filter, record its threshold, settings and observation time before reviewing the outcome. Compare the same entry and exit rules with and without it, including failures and trading costs. Keep the threshold fixed instead of changing it after each result. That tests a specific condition without treating ADX as a forecast.
Frequently asked questions
ADX describes how strong directional price movement has been in the selected data. It does not choose the side of a trade or measure the probability of profit. High readings can occur during both rising and falling prices.
No. Compare +DI and −DI and read the price chart for direction. A rising ADX can accompany a strengthening fall in price.
One reading is not a complete entry rule. ADX can restrict the conditions in which you consider a trade, but entry, exit and the quantity to trade still require separate rules.
Compare it with price direction and levels, using the chart itself or a moving average if that is part of the rule. Test the combination: adding ADX does not guarantee that false signals will disappear.
They compare smoothed changes in highs and lows with a range measure that includes gaps from the previous close. +DI above −DI means upward movement dominates the calculation; the opposite relationship means downward movement dominates. Neither line measures participants’ money.
About the author
Igor Arapov, practising trader since 2013 and author of the ArapovTrade library. ORCID: 0009-0003-0430-778X.




