A moving average, or MA, smooths a series of prices into a line. It makes individual jumps less prominent so that you can compare the broader movement with the current price. The line uses data already received; it does not tell you where the next turning point will be.
Two common versions are the simple moving average, SMA, and the exponential moving average, EMA. SMA gives equal weight to prices inside its current window. EMA gives the newest price more influence while retaining a diminishing effect from earlier values. Their different responses do not by themselves make a trading decision profitable.
How moving averages are calculated
For an SMA, add the prices from the selected number of bars, the periods on your chart, and divide by that number. If the source setting is close, use closing prices. Each new completed bar adds its close and removes the oldest one from the window. This keeps the number of prices in the average unchanged.
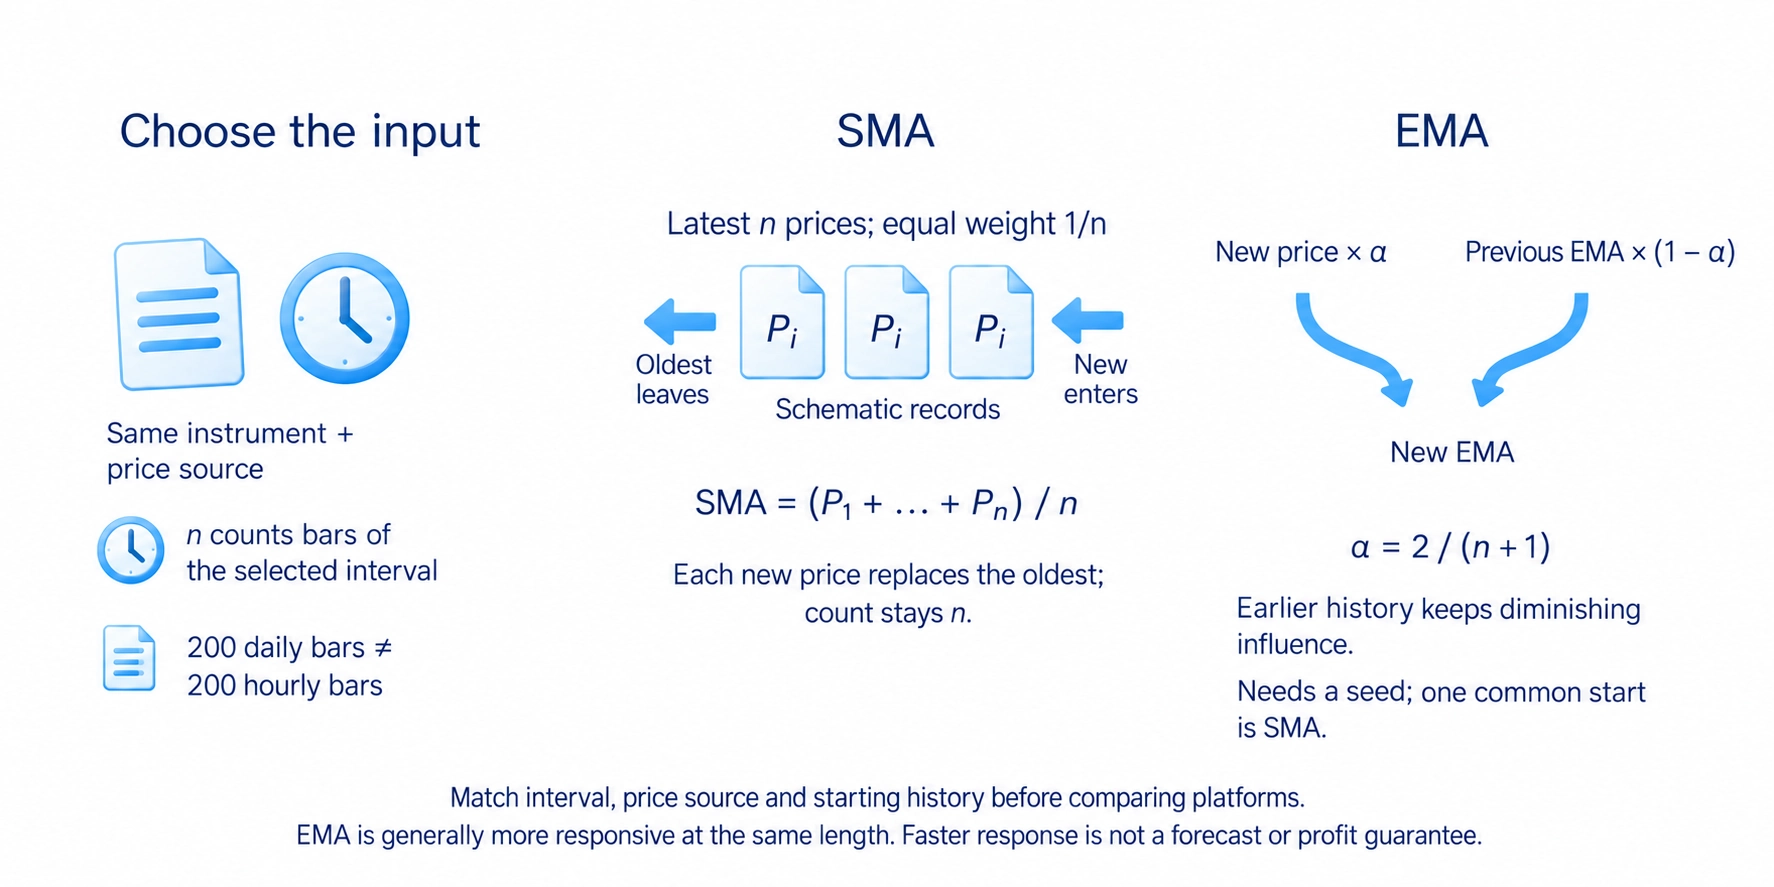
The length counts bars, not necessarily days. A 200-period SMA on a daily chart averages 200 daily closes. On an hourly chart, it averages 200 hourly closes. Call it a 200-day average only when the selected interval is daily.
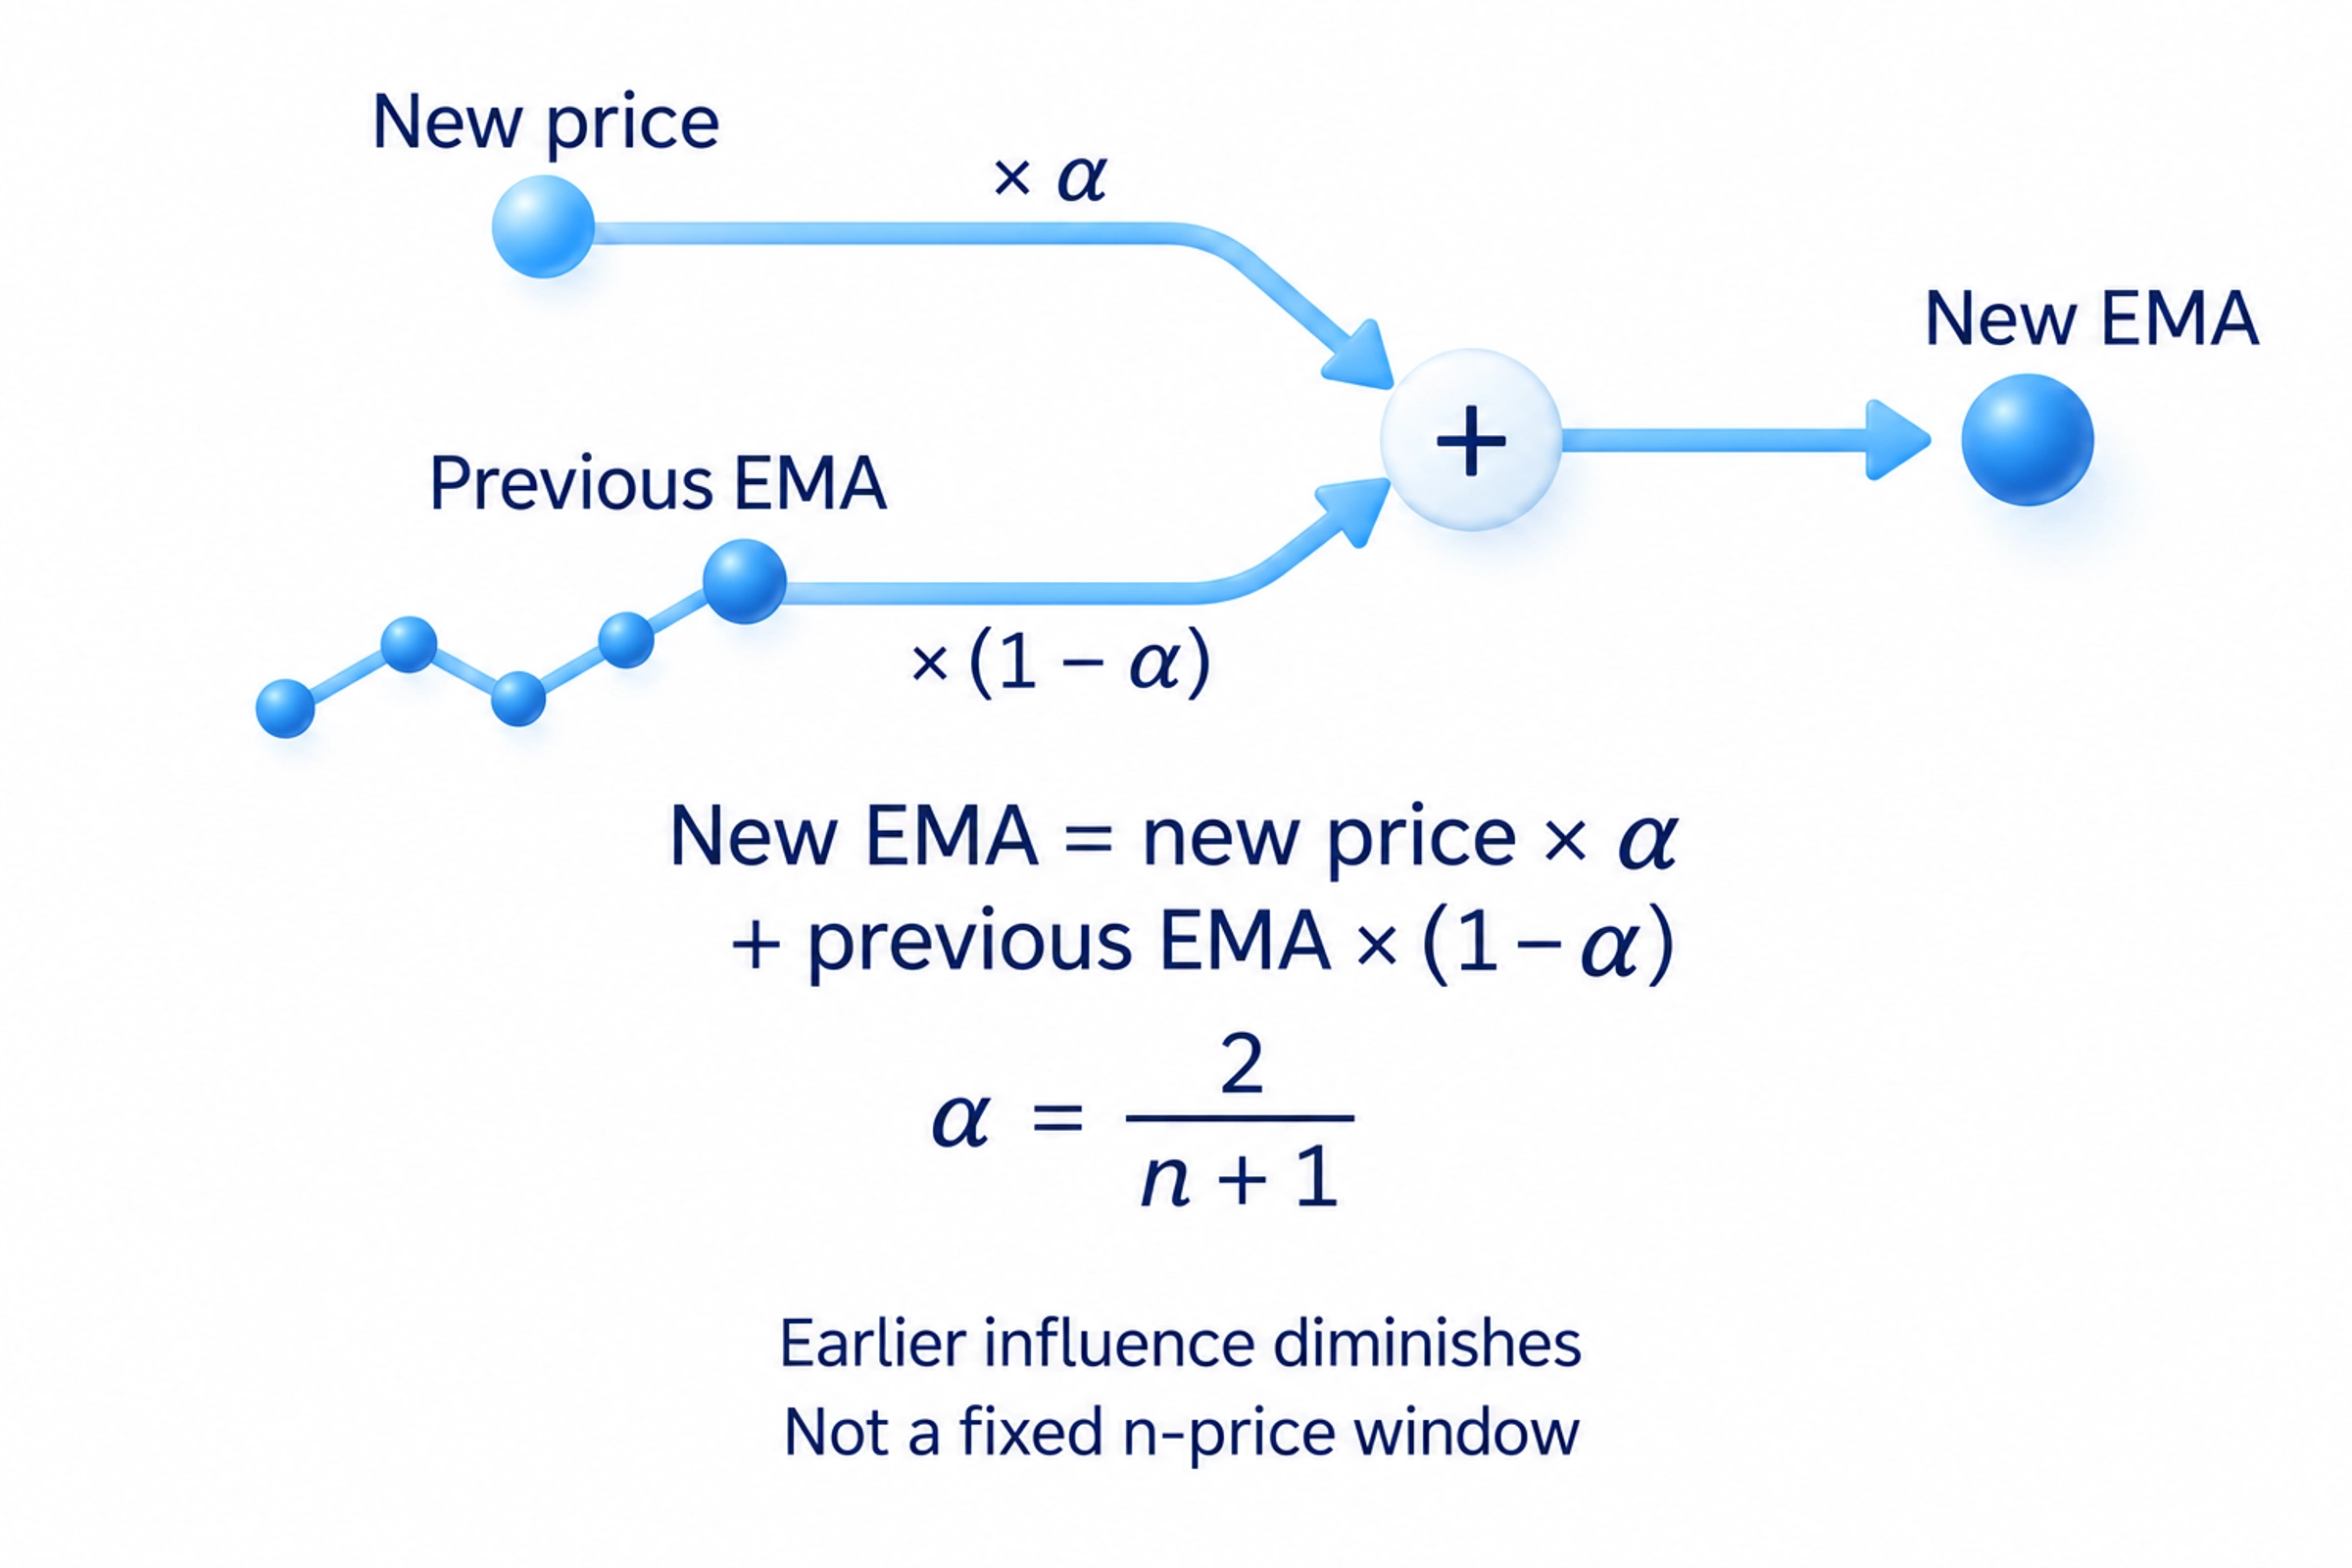
EMA combines the newest price with the previous EMA value. The usual formula is new EMA = new price × α + previous EMA × (1 − α), where α is the weight applied to the new price. A common choice is α = 2 / (n + 1), with n the selected length. The remaining weight applies to the previous calculation.
The program needs an initial EMA value before it can continue that update. One common method starts with an SMA. Afterward, earlier data keep a diminishing influence through the previous EMA. EMA is therefore not an equal average of only the latest n prices, and differences in starting history can slightly change its displayed value across platforms.
SMA and EMA calculation example
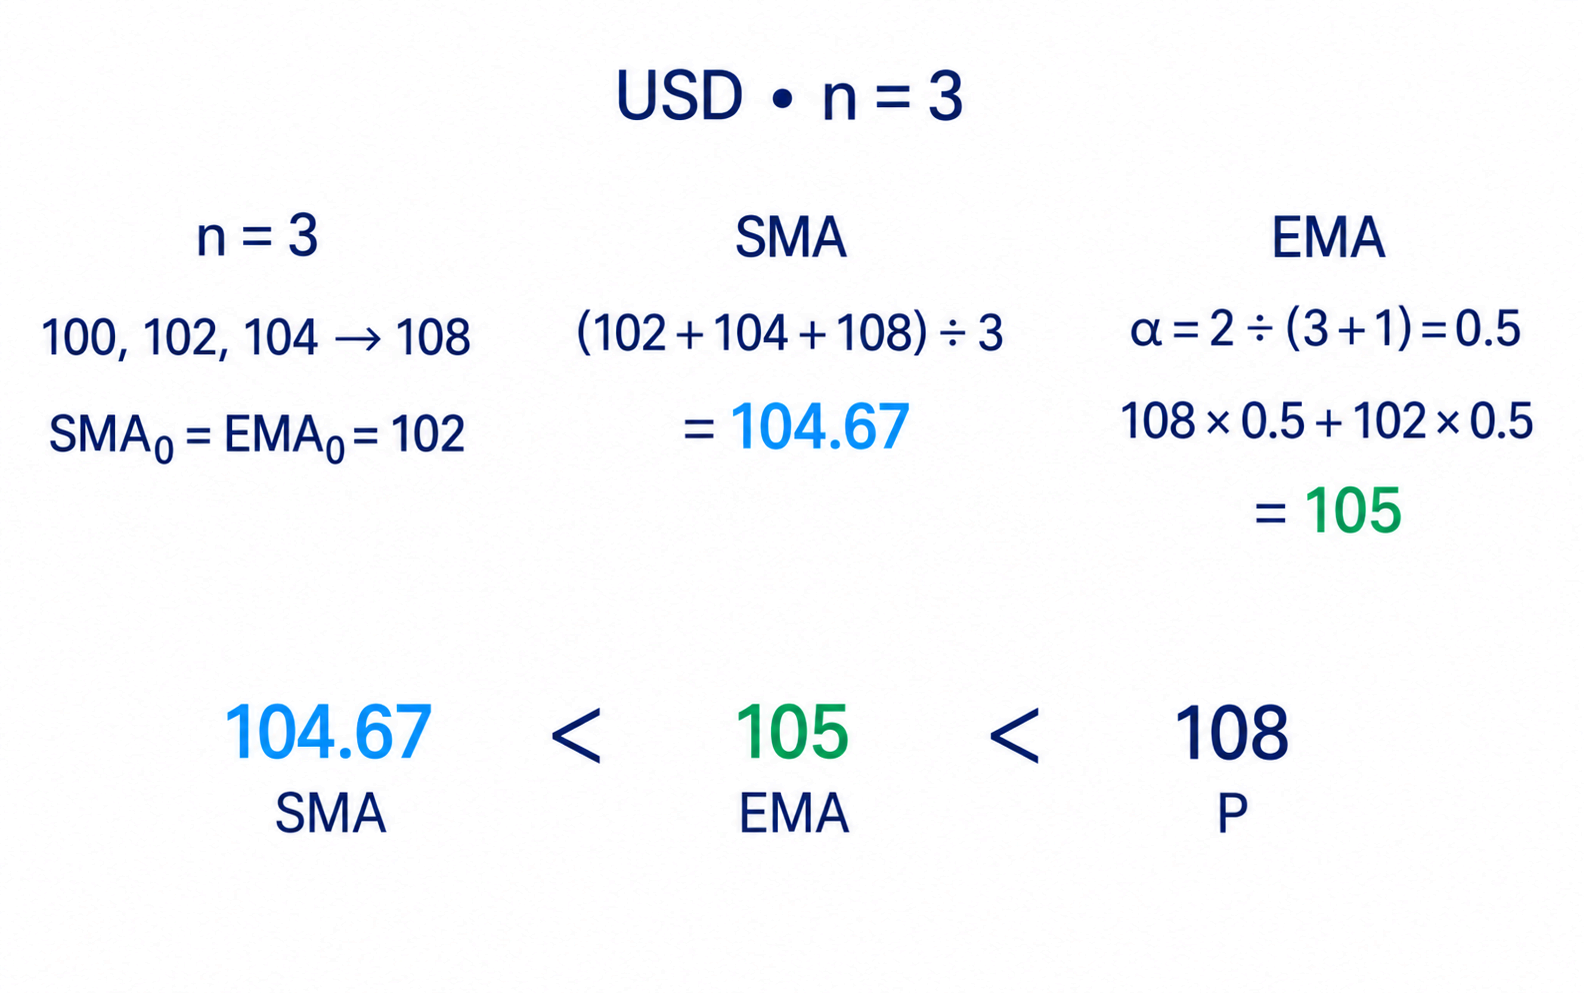
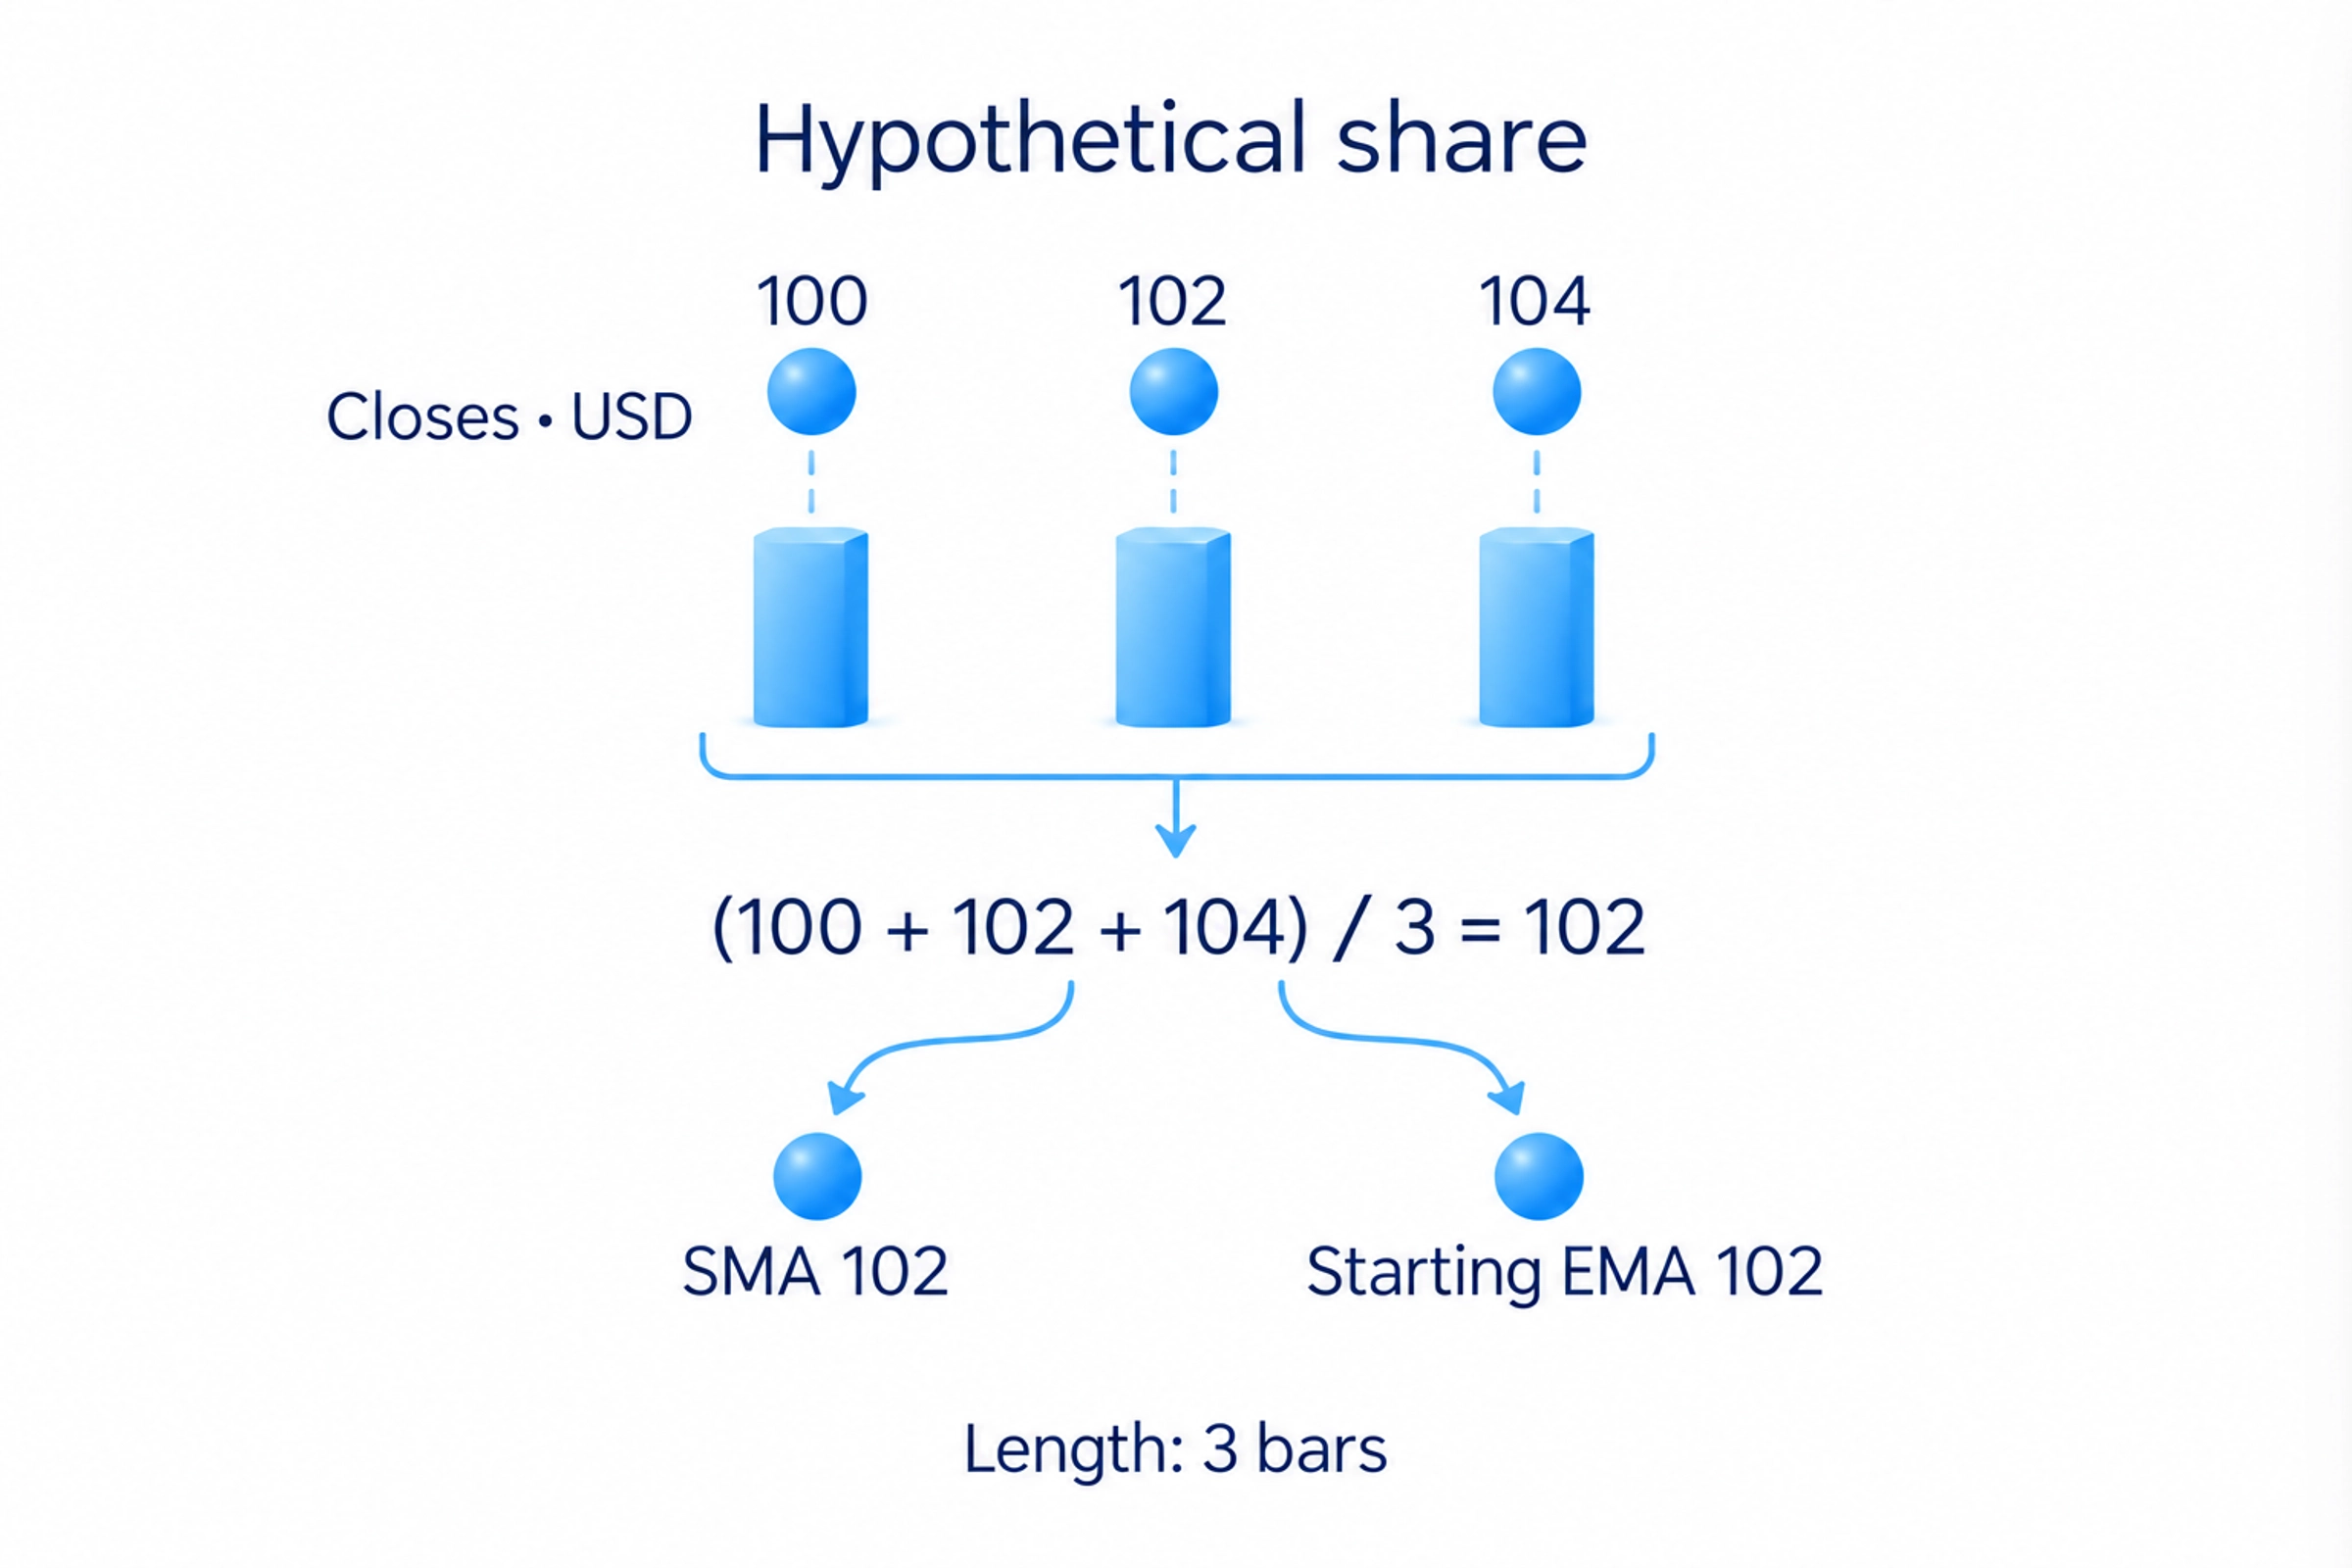
Consider a hypothetical share chart priced in US dollars. Three consecutive closes are 100, 102 and 104. With a length of three, the initial SMA is (100 + 102 + 104) / 3 = 102 dollars. For this comparison, use the same number as the starting EMA.
The next close is 108. The new SMA is (102 + 104 + 108) / 3, or about 104.67 dollars; the oldest close, 100, has left its window. For the EMA, α = 2 / (3 + 1) = 0.5. Its update is 108 × 0.5 + 102 × 0.5 = 105 dollars.
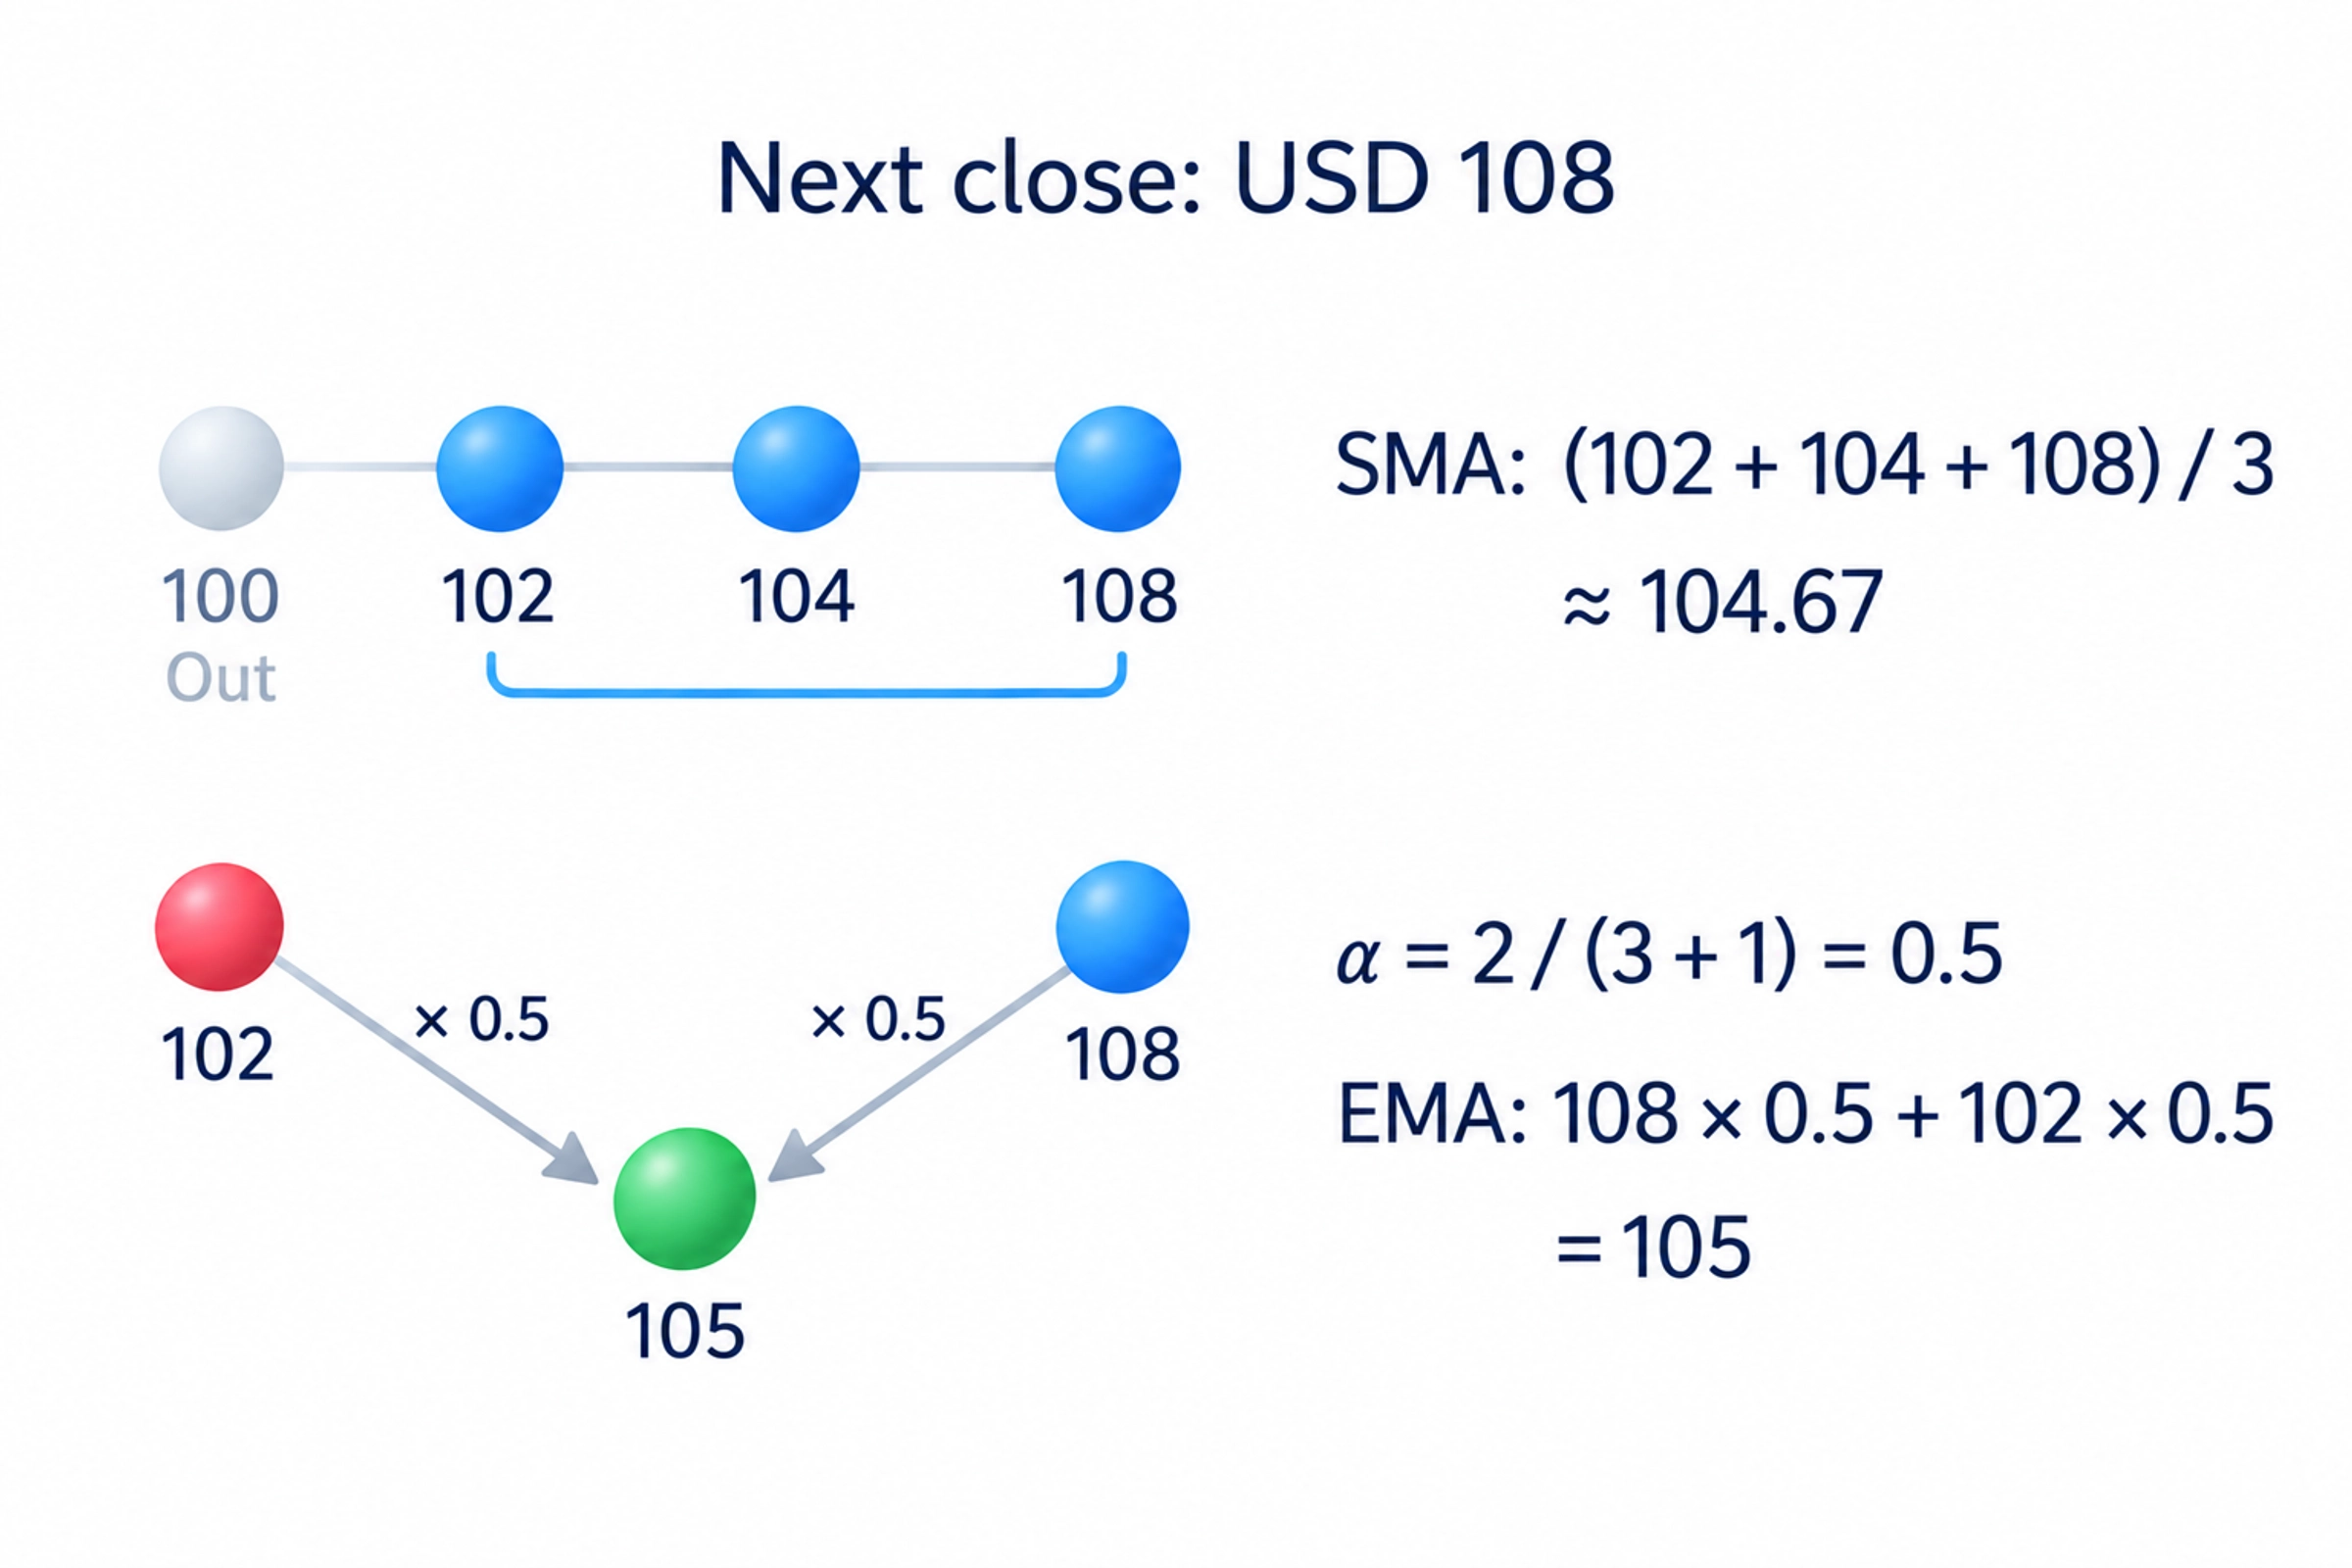
Here EMA has moved closer to the newest price than SMA. At the same length, it generally responds more quickly to recent changes, but a faster response is not a promise of a better entry. A more responsive line can also change direction more often during small back-and-forth moves.
Choosing the length and MA settings
Decide what the line is meant to do before selecting its length. Comparing broad direction and monitoring a brief pullback, a temporary move against the latest advance or decline, are different tasks. A shorter length responds faster; a longer one smooths more of the variation and retains the influence of older prices for longer.
There is no best length for every market and trade. A setting that appears useful in several clear trends may produce inconvenient crossings in sideways movement. Fix the setting before testing examples. Otherwise, choosing the most attractive line after seeing the outcome can hide how it would have behaved when the next price was unknown.
When comparing two averages, keep the instrument, chart interval and price source consistent. An average of opens differs from an average of closes or of several price fields combined. The chart-reading guide explains those fields and the period represented by each bar.
Check the offset setting as well. It moves the displayed line forward or backward relative to the bars without supplying future data. An additional smoothing setting can draw another average of the indicator's output. Distinguish that extra line from the original SMA or EMA before interpreting a crossing.
For an initial test, use ordinary candles containing the instrument's price data. Heikin Ashi candles use calculated values, so an average of their closes can differ from an average of ordinary closes. The displayed line is not a price at which an order is certain to execute.
Reading direction and crossings
Price position and line direction answer different questions. Price above an MA means it is above that calculated average. A rising MA means the average itself is increasing. Price can be above a line that is still declining, so do not treat these conditions as interchangeable.
A longer average can serve as a filter, a condition that restricts which situations you consider. For example, a rule might examine buying opportunities only while price is above its chosen average. The 200-day SMA is a common long-horizon reference. A filter does not choose the entry or establish that an asset will keep rising.
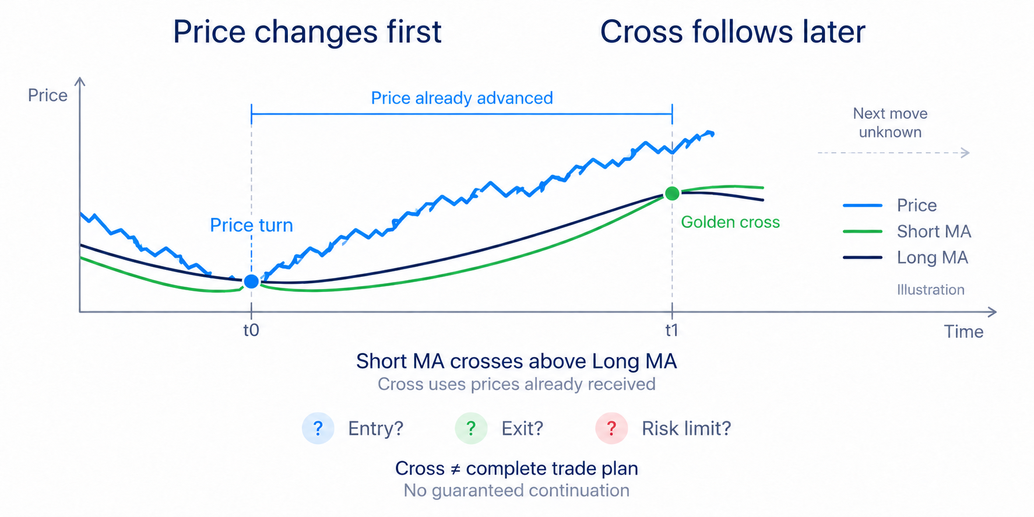
A price crossing changes the relative position of price and the line; it does not say how long the new movement will last. On an unfinished bar, the price and current average can still change, so a crossing can disappear before the close. If your rule requires a completed bar, evaluate it after that period ends.
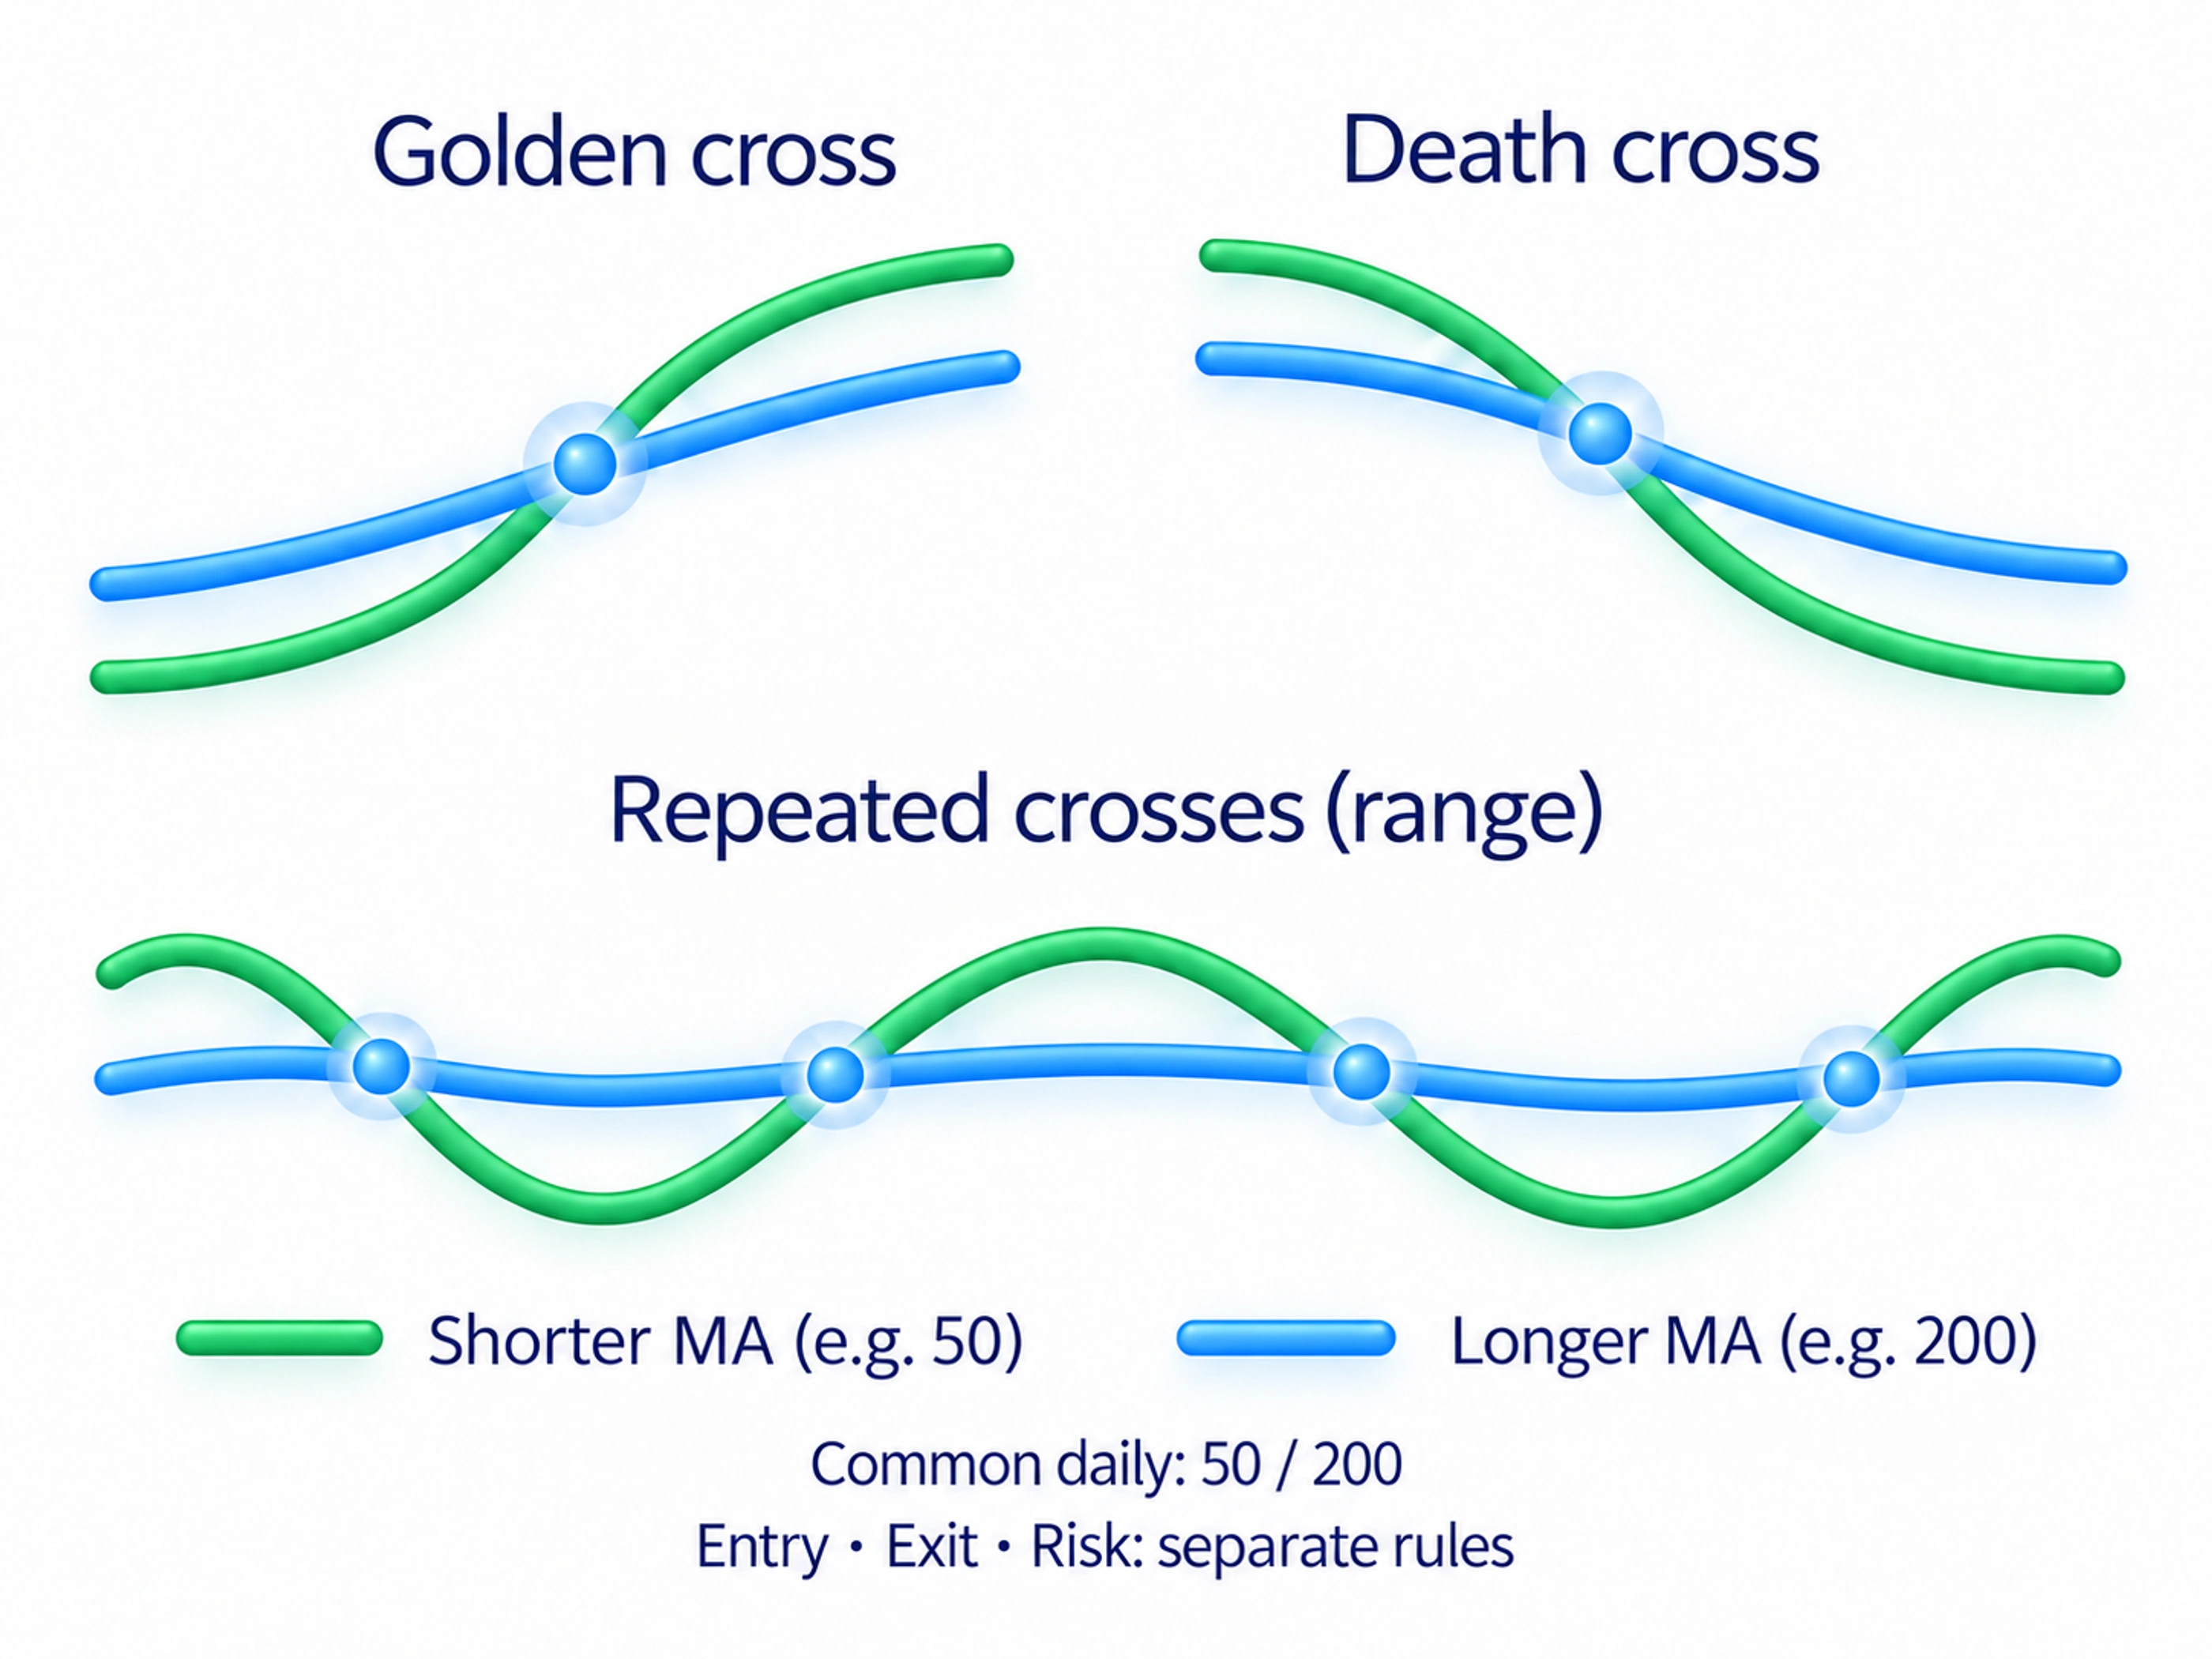
With two averages, compare the shorter-length line with the longer one. A shorter average crossing above the longer is called a golden cross; crossing below is called a death cross. A common daily version compares 50-day and 200-day averages. Other intervals and lengths describe different horizons, so record the actual settings rather than relying on the name alone.
The crossing follows price changes that have already altered the calculation. Even a conspicuous cross does not establish future profit or the duration of a trend. Before using it in a trade, define the entry, exit and risk conditions separately. The signal name is not a complete trading system.
Why a range produces repeated crossings
In a sideways range, price moves back and forth without a persistent direction. An average runs through that area, and price may repeatedly cross above and below it. A shorter length makes the line more responsive but does not remove these returns. If each cross triggers a trade, repeated reversals and transaction costs can undermine the rule.
Lengthening the average removes some small changes at the cost of a slower response. The choice is between responsiveness and smoothing, not between a universally bad and good indicator. Check the character of the price movement, then decide whether the MA still serves the function you assigned to it.
Support near an MA and moving-average ribbons
During a trend, price sometimes returns near an MA and then resumes its direction. Traders describe this as dynamic support during a rise or dynamic resistance during a decline. Dynamic means that the calculated line moves as new data arrive. The observation concerns price behaviour near a changing reference.
The MA does not show the orders waiting around it. You can observe a reaction, but the line alone does not reveal the quantity of pending orders or who placed them. Define the conditions for judging a return before testing it. A coinciding turn is not proof that the line itself caused the market to hold.
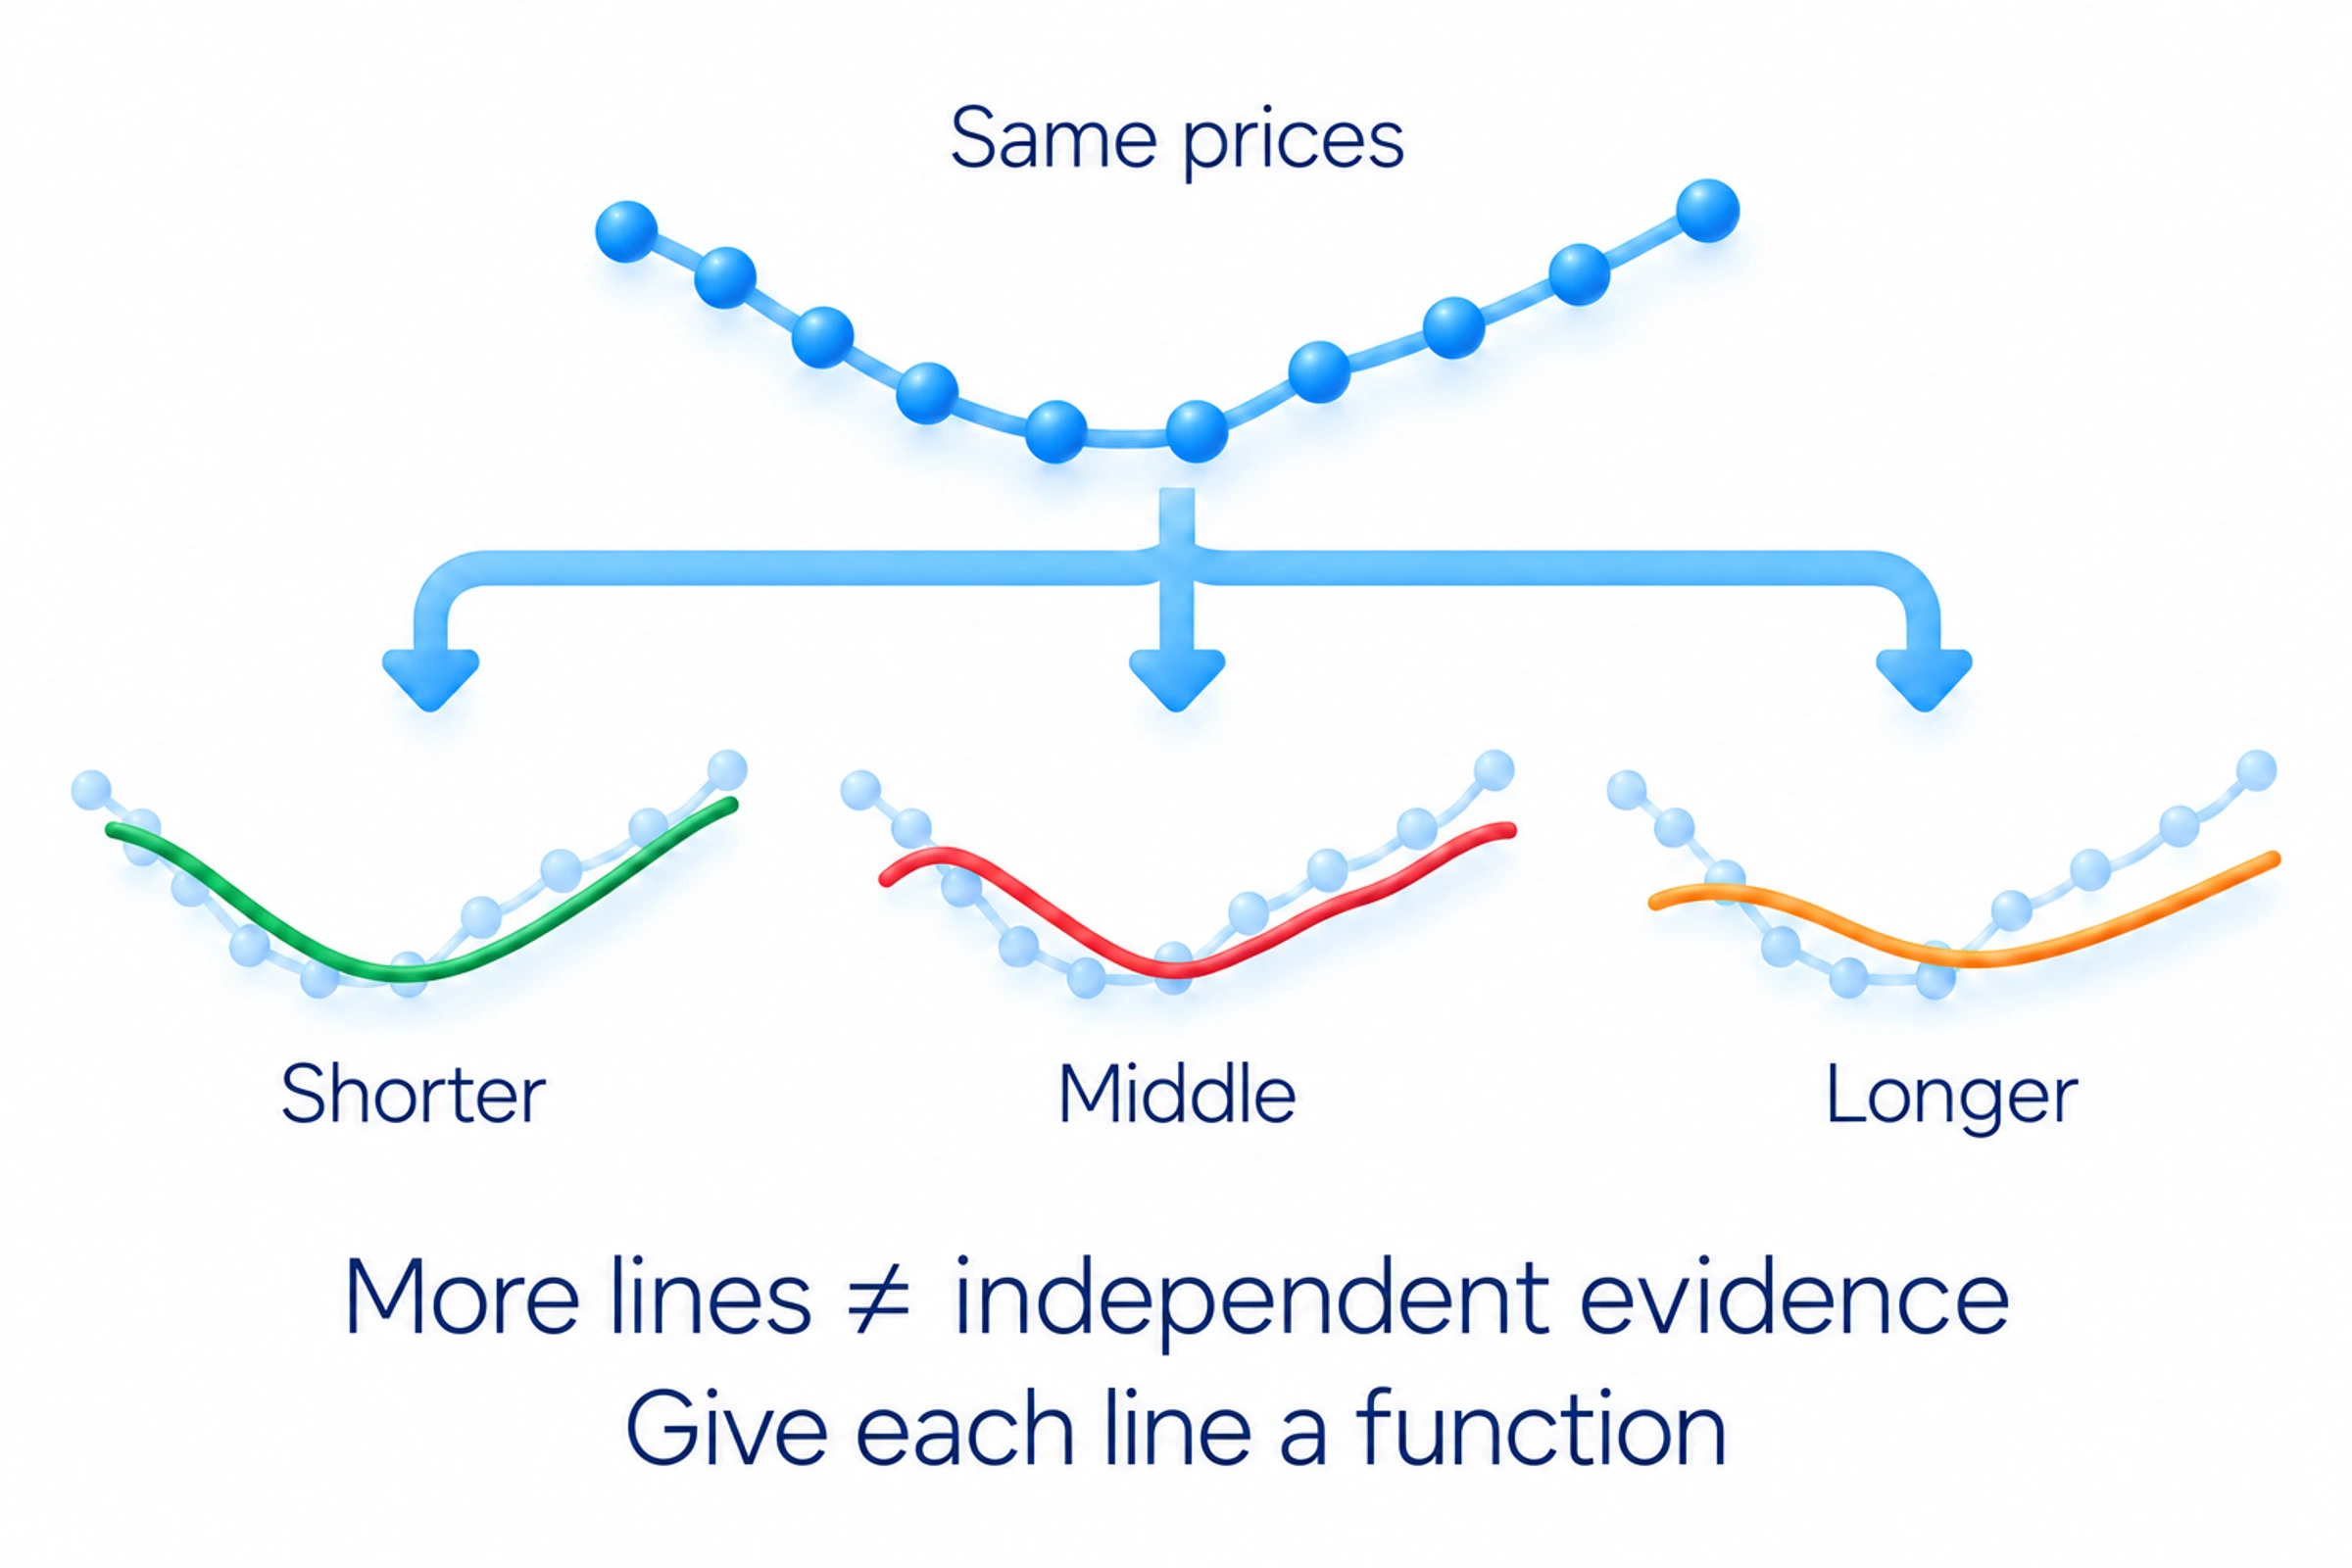
A moving-average ribbon contains several averages with different lengths on the same chart. It lets you compare shorter and longer smoothed movements. The spacing and order of the lines describe the current calculations. Several averages of the same prices are not several independent sources of confirmation.
Add a line only if you can name its function. If several lines lead to the same decision, removing some may make the actual price and trade conditions easier to see. A more complicated chart does not automatically provide more reliable evidence.
How to practise with a moving average
In my approach, I first study price structure, levels and how price movement relates to trading volume, the quantity traded in the selected data source. Then I assess whether an indicator helps with a particular task or distracts from it. The course's section on indicators explains this order of learning. It does not teach a compulsory moving-average touch entry or a private 200-day portfolio rule.
Before treating a crossing as an extra condition, describe what price did around the selected level. MA processes the price series, while trading volume adds information about activity. These are different data, although volume alone does not identify the buyers or sellers. The volume-analysis guide explains that distinction.
My video on indicator lag explains that a price-based indicator updates after new price information arrives. The chapter discusses this general limitation, not a separate SMA or EMA trading system. The video is an optional practical addition; the calculation and interpretation here are complete without watching it.
For your own test, choose one MA function and record the type, length and source. Reveal new bars in sequence without looking at the future. Keep late crossings, repeated returns and missed moves in the record as well as useful cases. If you cannot express the line's role as a simple rule, clarify the rule before adding another average.
Frequently asked questions
SMA gives equal weight to prices inside its current window. EMA gives more weight to the newest price while retaining a diminishing influence from earlier calculations. At the same length, EMA generally responds more quickly to recent changes.
The average uses price data already received. A turn or crossing follows a change in those data rather than announcing a future move. A shorter length can increase responsiveness, but it does not turn the calculation into a forecast.
Price can react near an average during a trend, but the line does not display pending orders. Check the actual reaction rather than assume the MA caused it. Arapov's course treats indicators as supplementary to price structure, levels and volume.
A ribbon compares smoothed prices over several lengths. Its line order and spacing describe the calculations, but the lines still use the same source: price. More lines do not mean more independent confirmations.
On a daily chart, it provides a reference for longer-term price movement. Price relative to the line can be a filter condition, but that position alone neither chooses an entry nor guarantees trend continuation.
A golden cross is a shorter average crossing above a longer one. A death cross is the reverse. A common daily version uses 50 and 200 days; both crossings follow changes in price data that have already occurred.
About the author
Igor Arapov, a practising trader since 2013 and author of the ArapovTrade library. ORCID: 0009-0003-0430-778X.




