Volume analysis compares how much was traded with what price did during that trading. It can help you assess whether activity accompanied a move, whether progress slowed and where trading was concentrated. A large volume bar does not identify a trader or tell you to buy.
Start with the data, then examine price and its next reaction. Similar-looking chart columns can measure different things. Check the data source and units before comparing them.
What does trading volume measure?
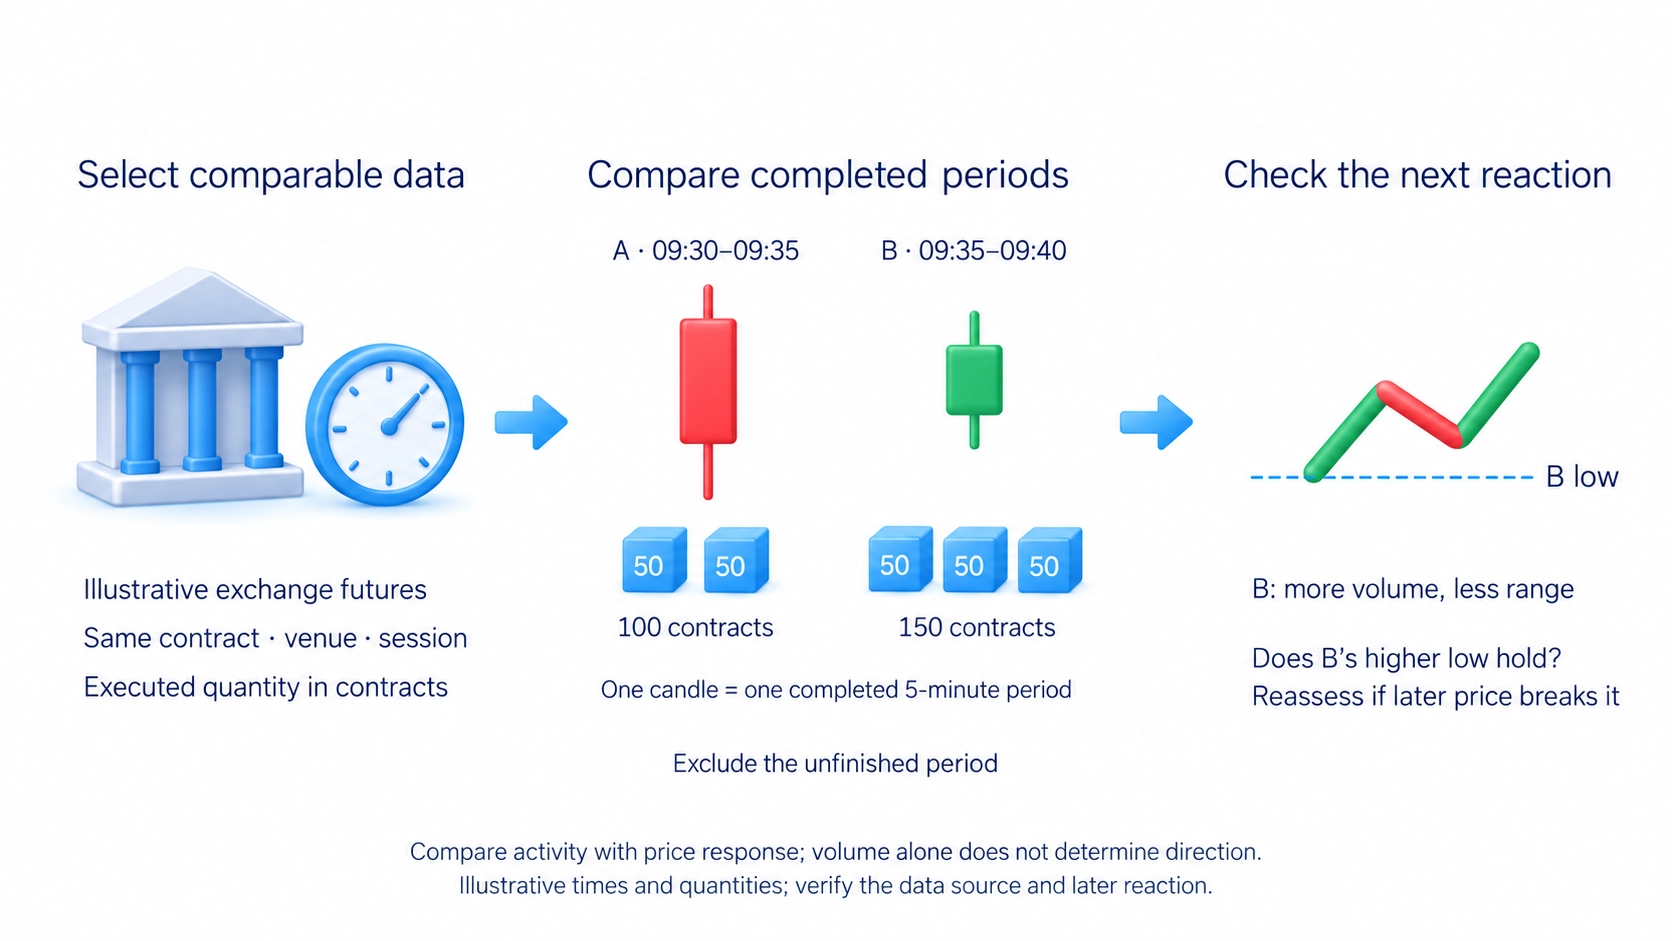
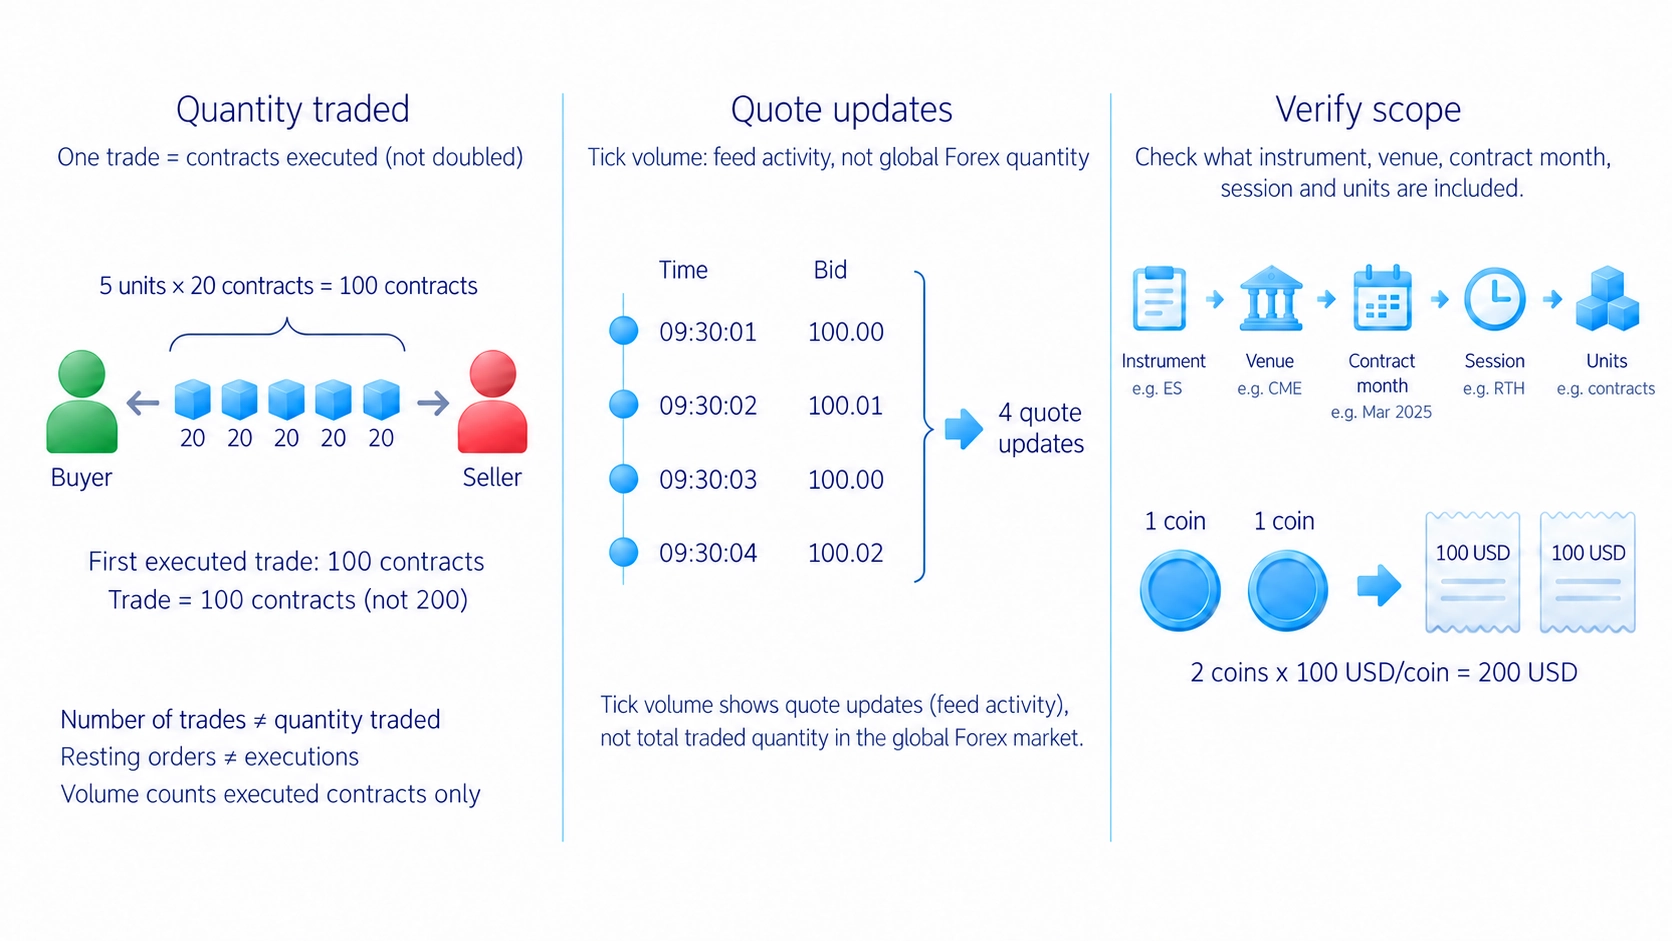
Exchange trading volume is the quantity traded during a chosen period, such as shares or futures contracts. If a transaction exchanges 100 contracts, it contributes 100 contracts to volume. The buyer and seller are the two sides of that transaction, not two separate sets of 100 contracts to add together.
Quantity is different from the number of transactions or traders. Several small trades and one large trade can produce the same total volume. Open interest counts contracts that remain open, rather than contracts traded during the period. Volume alone does not provide that count: traders may be entering, closing or transferring positions. A rising column is not a count of newly committed investors.
Orders waiting in the order book are offers to trade, not completed volume. A cancelled order can disappear without a trade taking place. The market-microstructure guide explains the distinction between displayed orders and executed transactions.
Exchange volume and tick volume
Before reading the indicator, check its data source and units. Identify the instrument, venue, contract month, session hours and any delay. Around a futures contract's expiry, activity can move to the next contract. Falling volume in the old month does not, on its own, mean interest in the underlying market has disappeared.
Tick volume counts incoming quote updates rather than the number of shares or contracts exchanged. On a retail Forex chart, it can describe activity in the available feed. It is not the combined trading volume of the global currency market. Check the platform's definition instead of assuming that every column labelled Volume measures the same quantity.
Exchange data also has a scope. Volume for one CME futures contract concerns that contract and its reported trading venues, not every transaction in the underlying asset. Bitcoin volume on one exchange is not a total for all exchanges. A figure expressed in currency value is also different from one expressed in coins or contracts.
I use exchange futures data to compare traded contracts with price movement. That is a choice of data for my analysis, not a claim that all other volume is fictitious. Before drawing a conclusion, check what the selected symbol and indicator actually provide.
How to compare volume bars
A column beneath a candle normally represents activity during that candle's period. A five-minute column covers five minutes; a daily column covers the selected trading day. The current period is still accumulating volume. Compare completed periods, or account for the time elapsed, rather than comparing an unfinished candle with a full one as if they had equal observation time.
High volume is relative to the instrument and comparison period. Activity around the market open may regularly exceed activity in a quieter part of the session. Compare neighbouring completed candles and similar times of day. A recurring opening surge is not automatically an exceptional event.
Check what the colour means. Some indicators colour volume according to the candle's direction; others compare its quantity with the preceding column. Neither convention means that one colour contains only buyers and the other only sellers. Every completed transaction has both sides.
Wyckoff: effort versus result
In Richard Wyckoff's effort-versus-result approach, volume is the effort and price progress is the result. Compare activity with the distance travelled, the candle's closing position and what happens afterwards. Heavy trading with little progress is a different observation from heavy trading followed by sustained movement.
Here, a candle's range means its high minus its low. Its body is the distance between the open and close. A narrow body can still sit inside a wide range. Keep those measures distinct when describing whether the move became smaller.
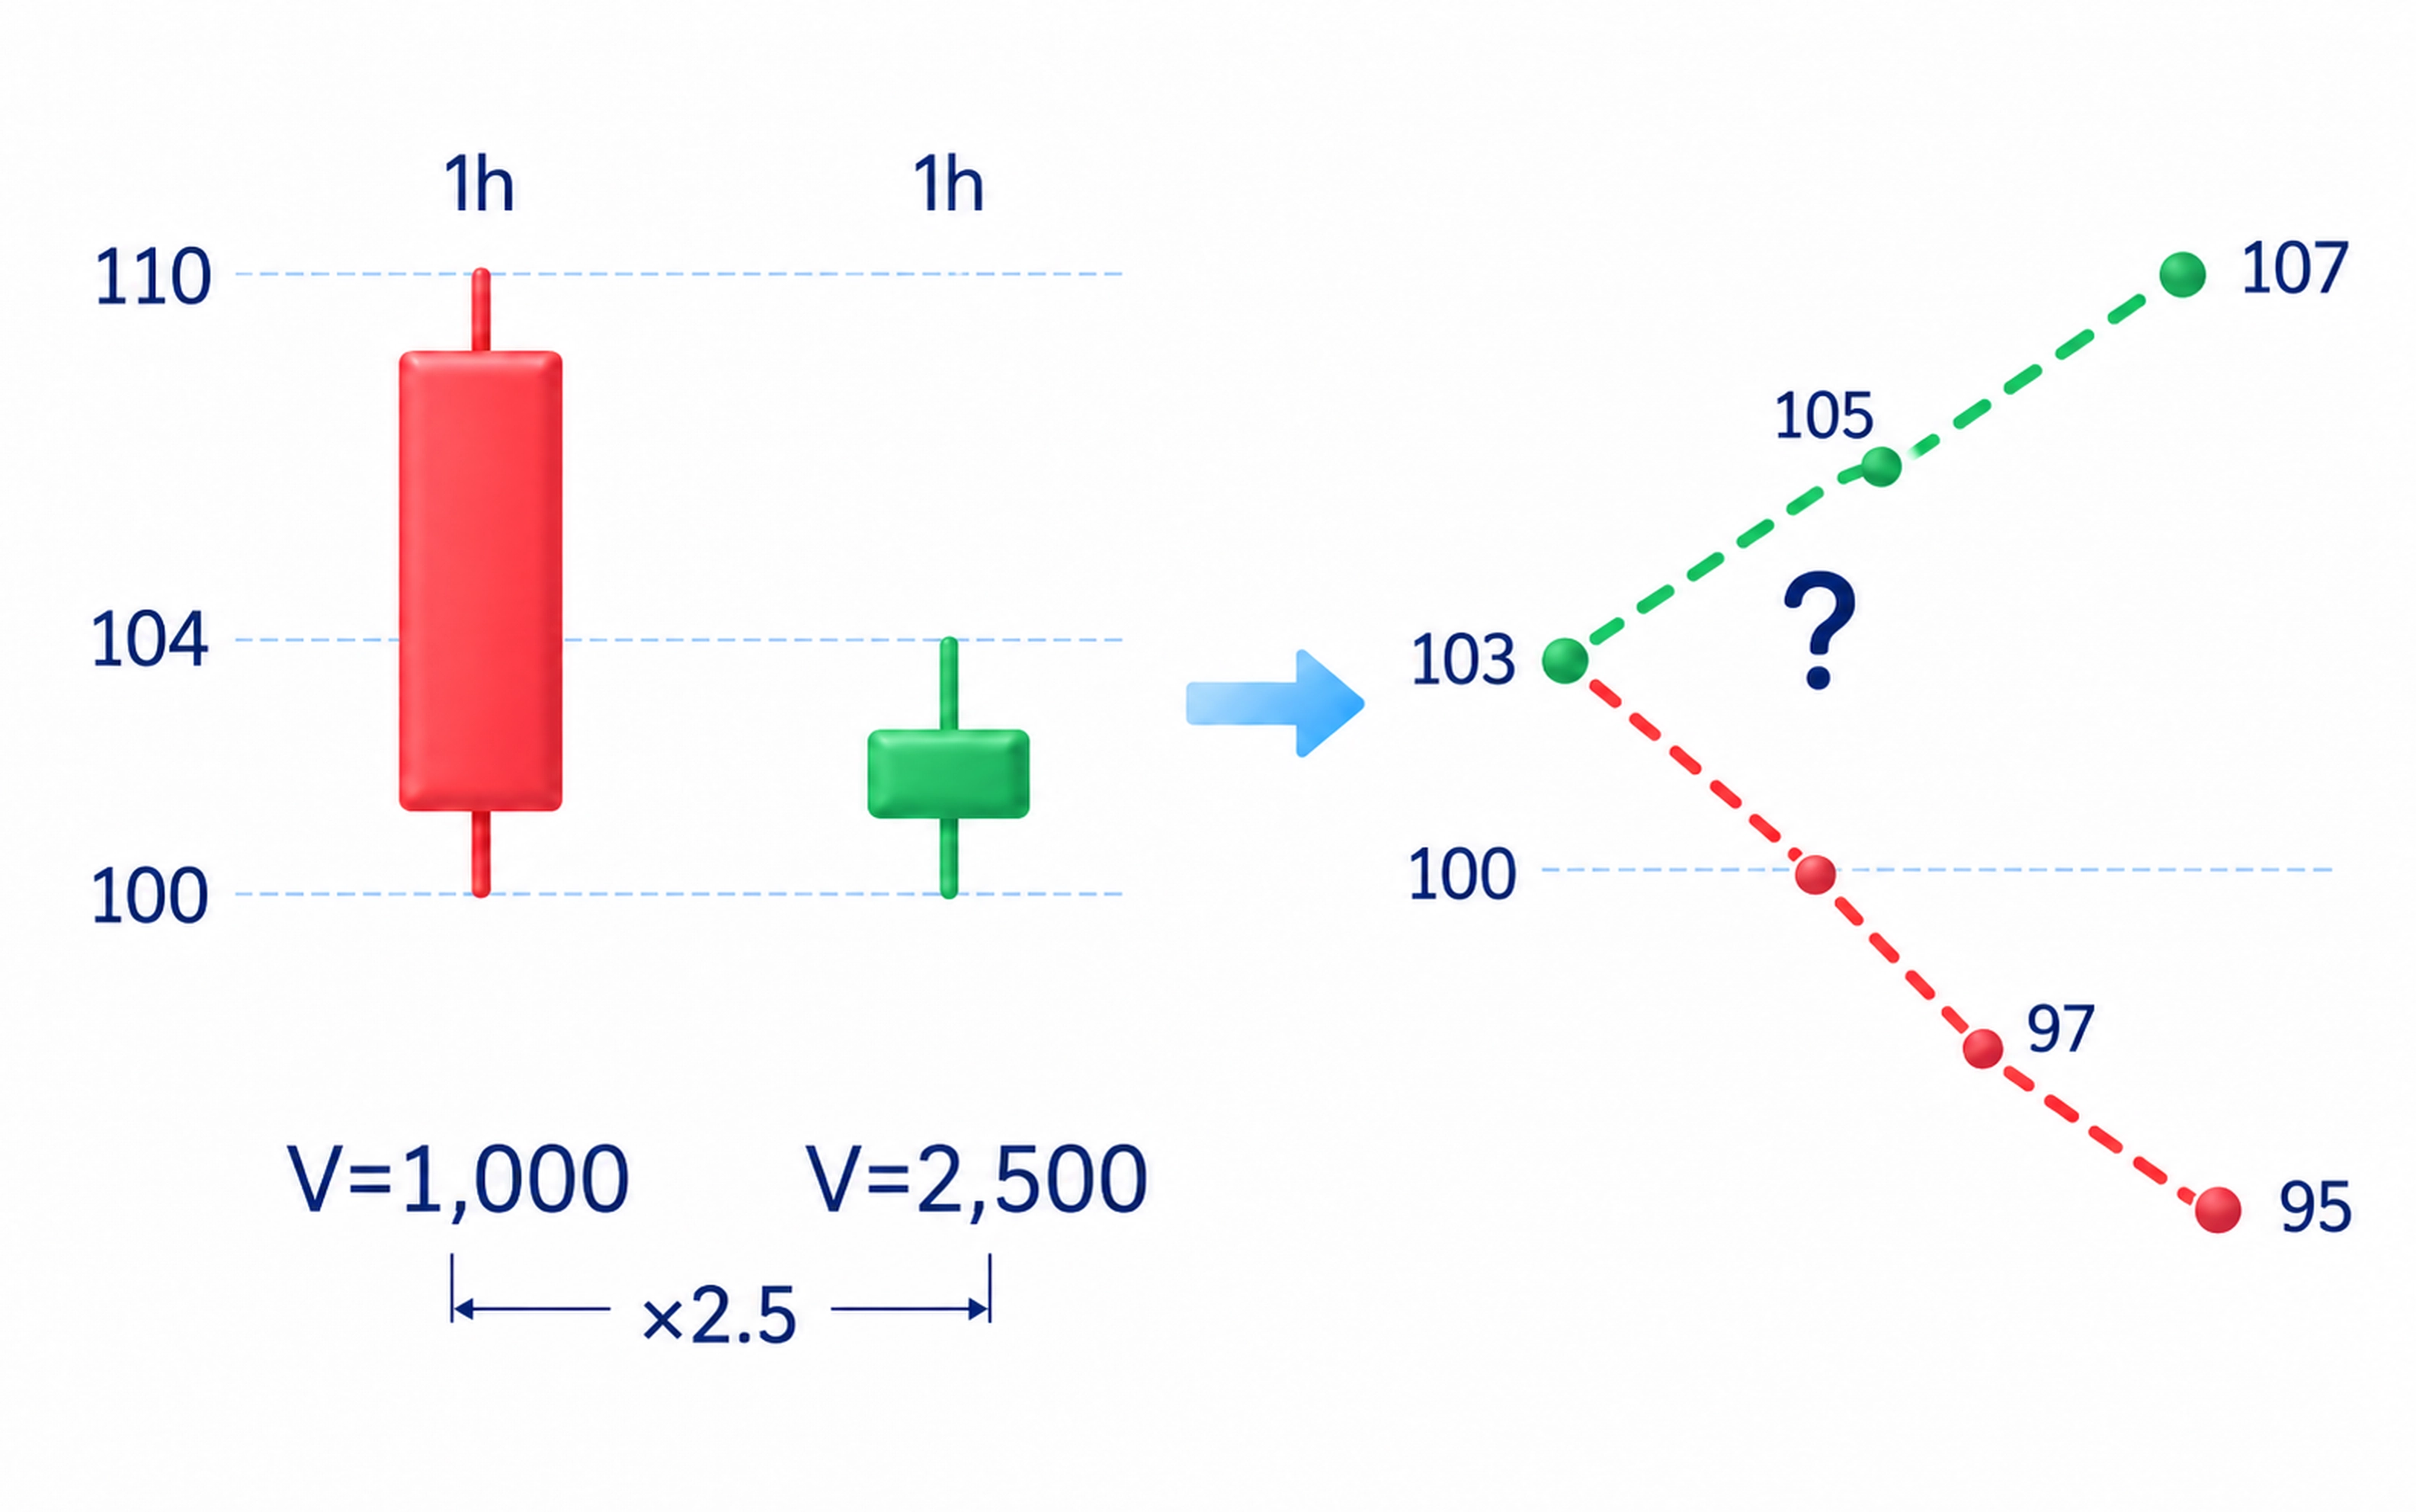
Consider two consecutive completed hourly candles in the same futures contract. The first trades 1,000 contracts, has a range of 10 price points and closes near its low during a decline. The second trades 2,500 contracts, has a range of 4 points and closes near its high. Volume is 2.5 times greater, while the range is smaller and the closing position has changed. This is a reason to check whether downward progress is weakening, not proof that the next candle will rise.
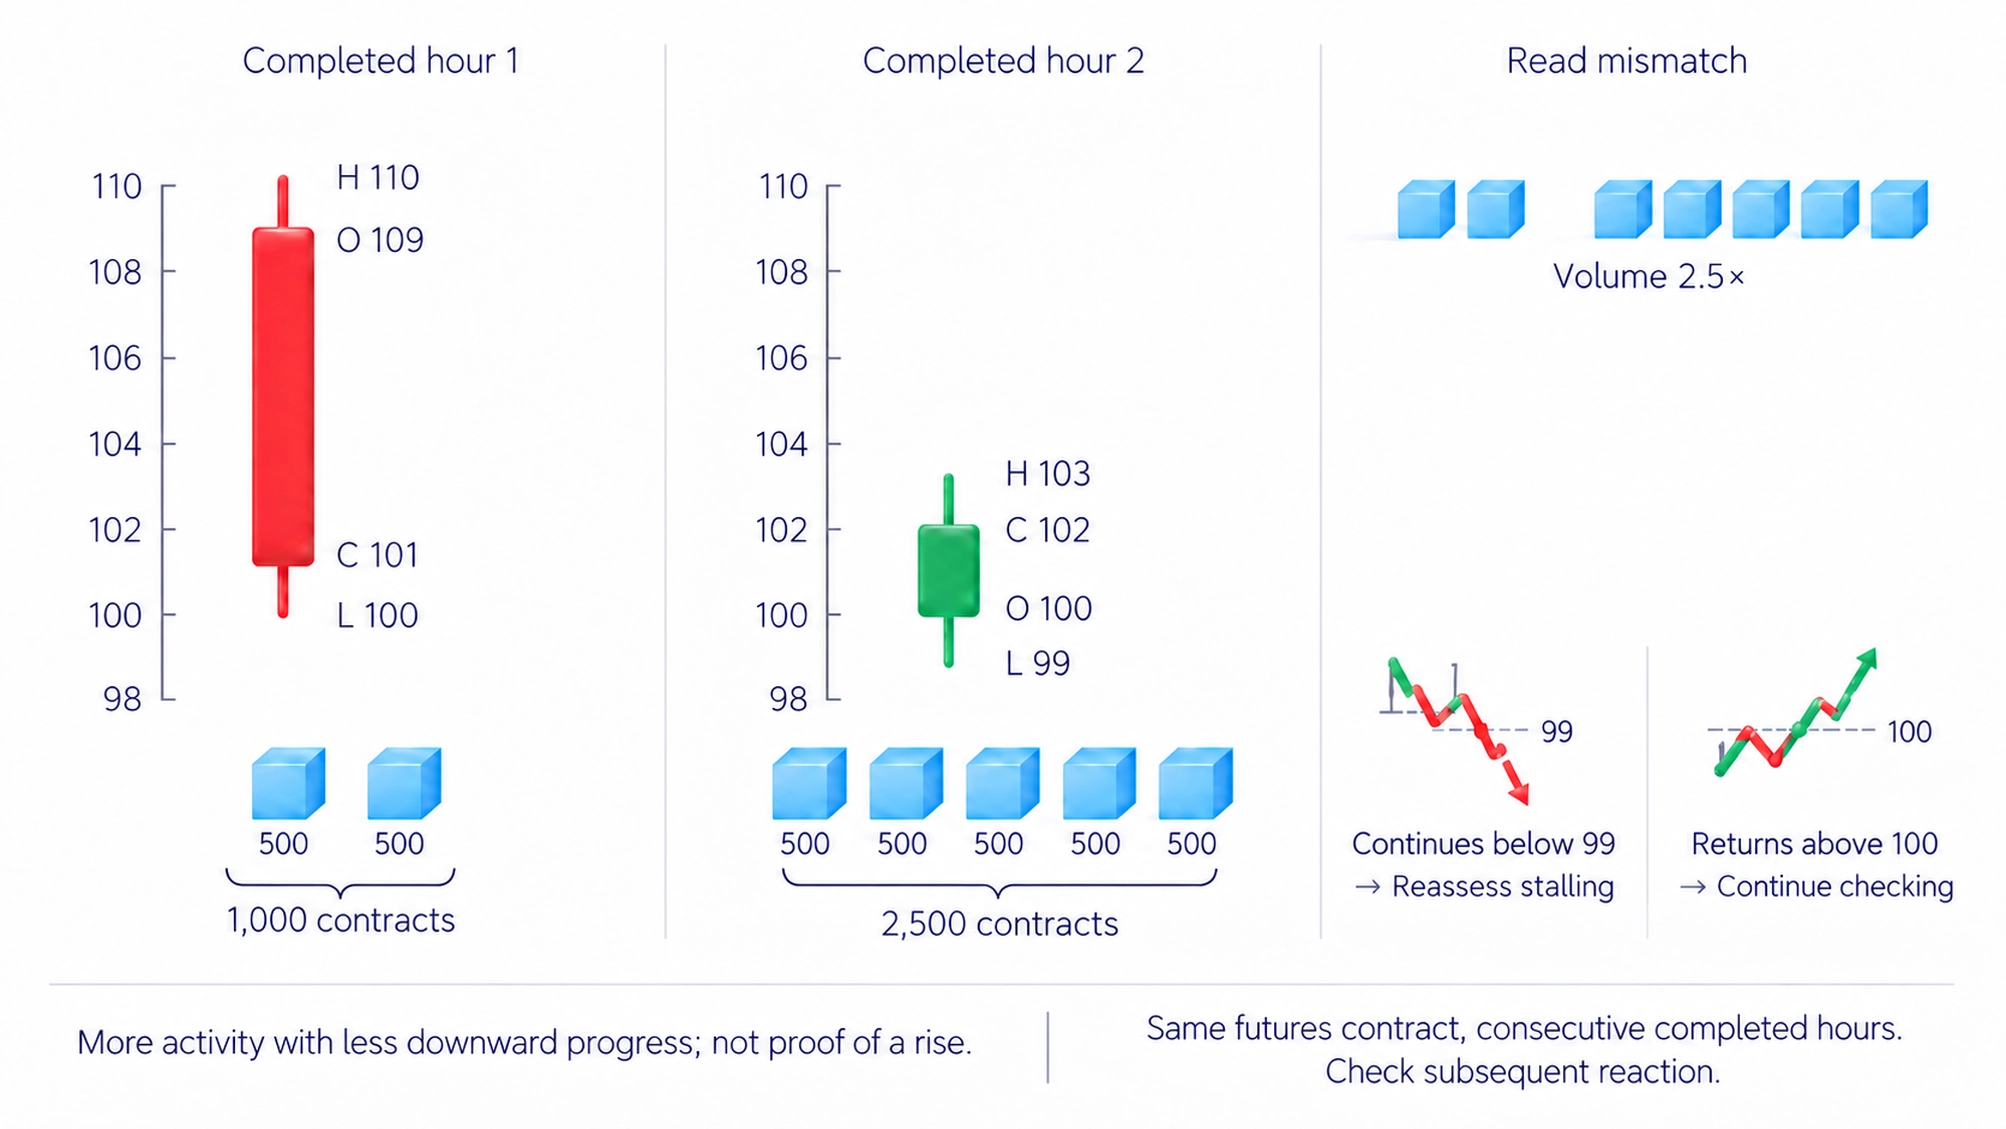
Opposing buying can absorb selling without allowing much further decline; opposing selling can limit a rise. This is the idea behind absorption. Total volume alone does not reveal who supplied those orders, whether they opened or closed positions, or whether the same interaction will continue.
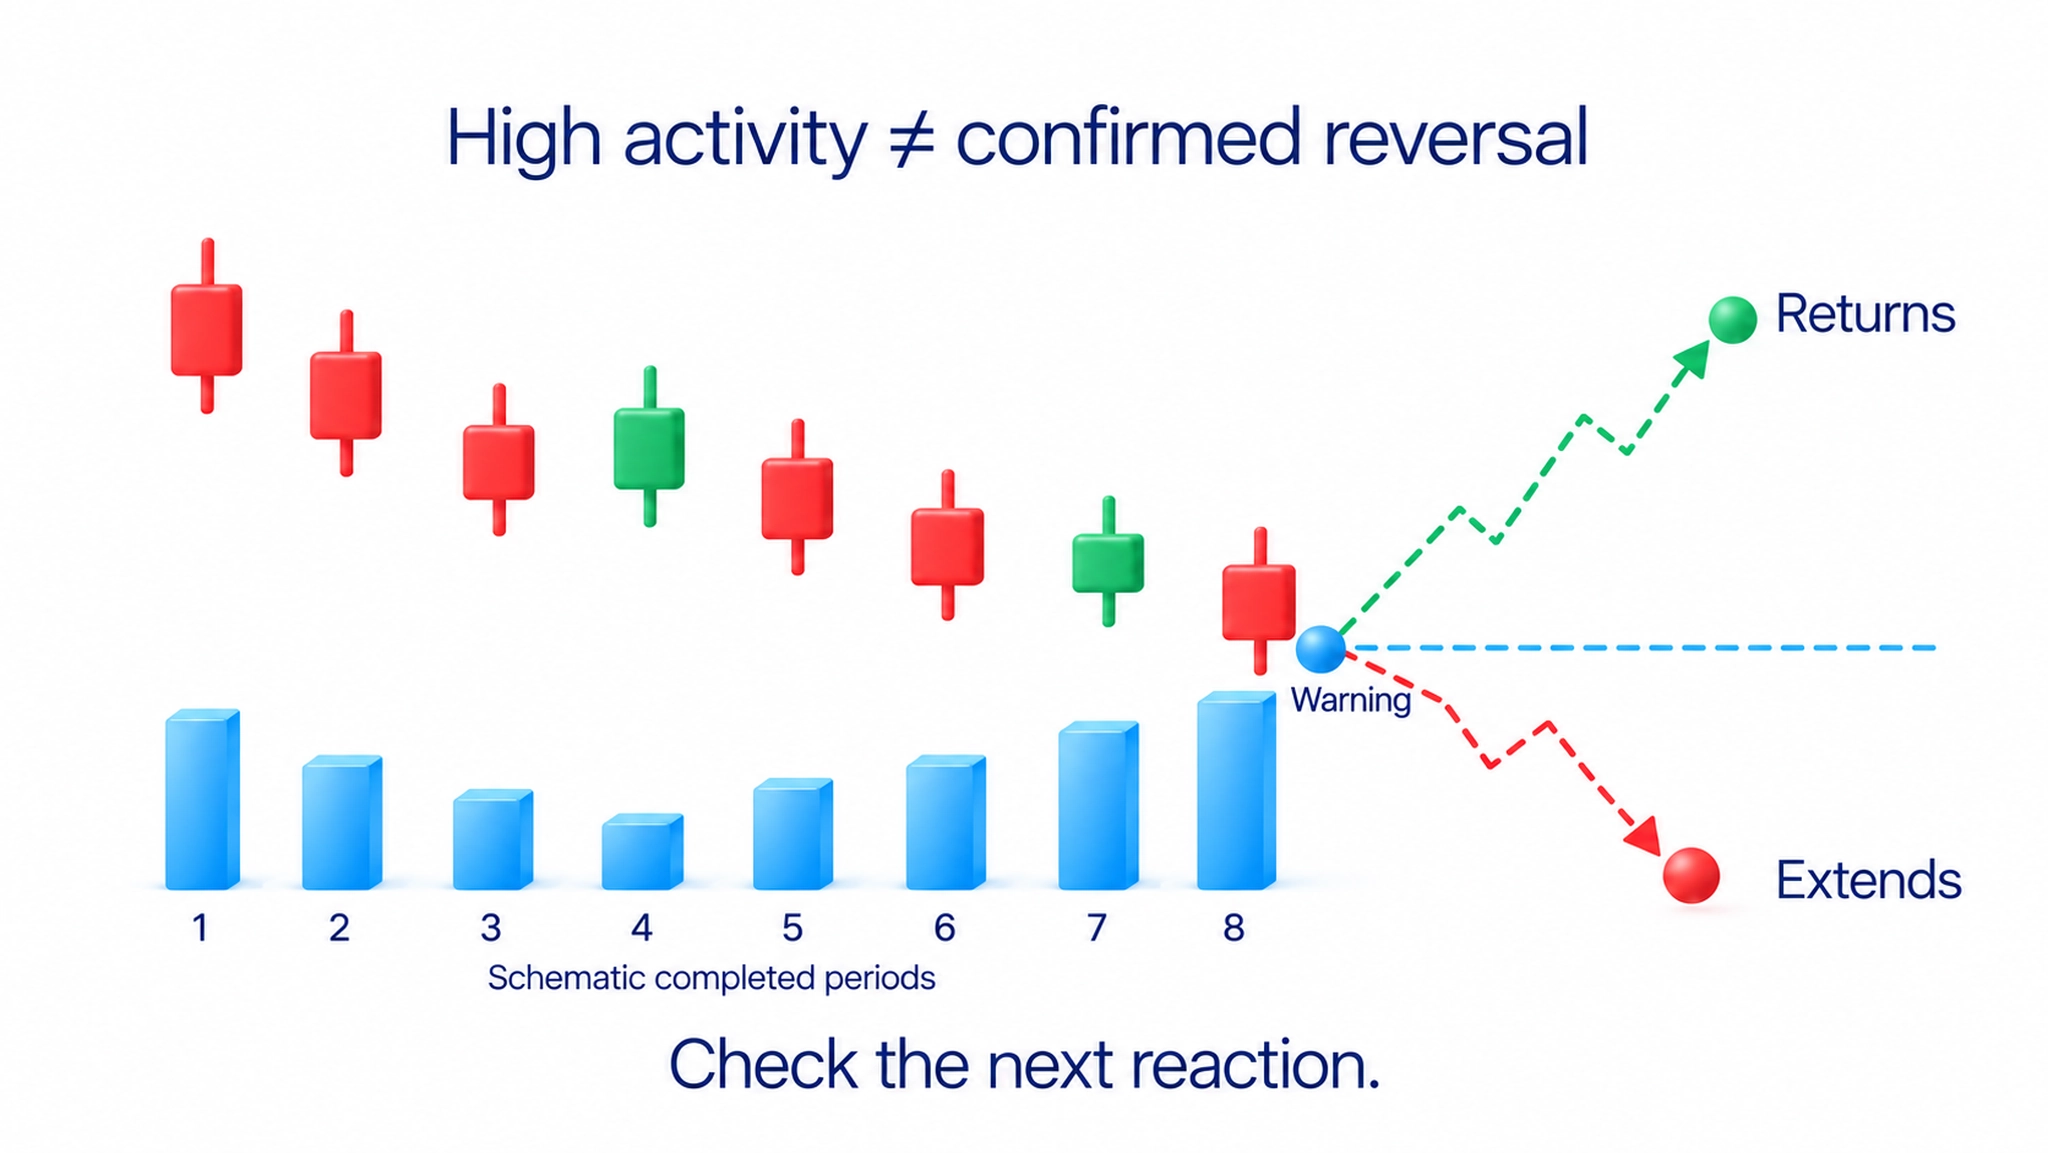
I look for that mismatch near a meaningful price area and then check the reaction. If price keeps making lower lows and stays below them, the idea that the decline is stalling needs reassessment. If it fails to extend the decline and returns above the area, I continue checking that sequence. The first volume surge is not the whole decision.
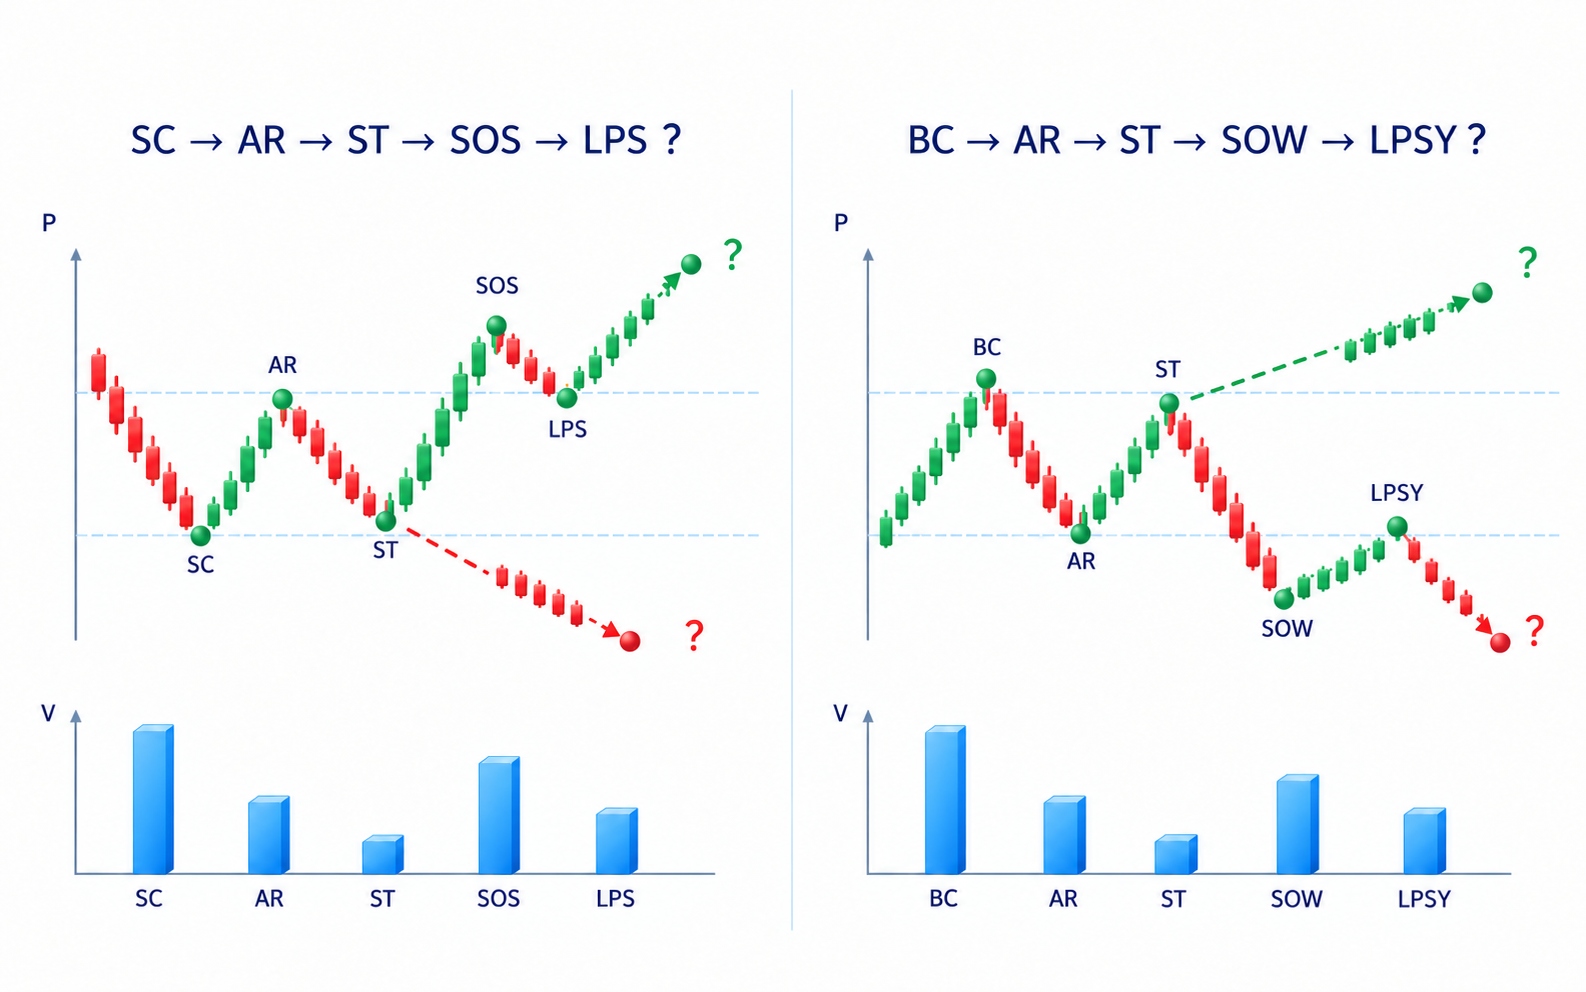
A Wyckoff phase diagram puts observations into a wider sequence. The Wyckoff-method guide explains accumulation, distribution and the named events within those structures. The illustration here provides context for reading volume; it is not evidence that a particular participant caused the move.
Volume in trends and reversals
In a rising move, compare advances with pullbacks; in a falling move, compare declines with rebounds. Ask whether price is still making progress and how activity changes during each part. A surge of volume accompanying a new high does not promise another high.
A new high on lower volume is a price-volume divergence: price extends while recorded activity is lower than in the chosen comparison. It can justify checking for weaker continuation, but it does not mean all buyers have gone. Price can rise on relatively little volume when there is little selling available at nearby prices.
An unusually large burst of activity late in a move may be described as climactic volume. Check whether price subsequently stops extending, returns through the area or continues. Calling the burst a climax before that reaction risks treating a warning as a completed reversal.
In my interpretation, a lack of opposing demand or supply helps explain movement. Sellers may have to accept lower prices when buyers are not available in the required quantity at the old price; buyers may have to pay more when nearby offers are insufficient. Volume records the executed part of that process. It does not measure every remaining order or prove that one cause explains the whole move. The Smart Money material develops this interpretation of participant activity.
Volume Profile, POC and value area
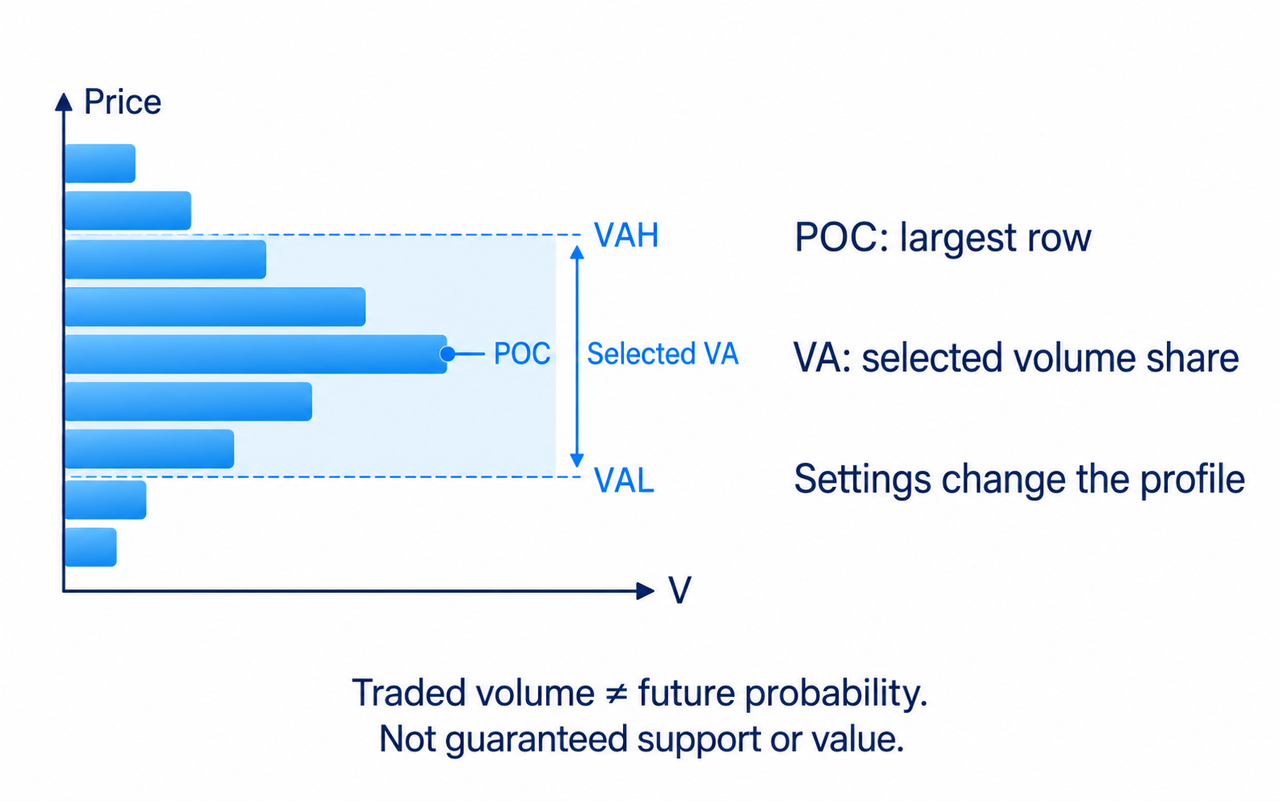
Volume Profile groups traded activity by price over a selected period. The columns beneath candles answer when activity occurred; the horizontal profile answers at which prices it was recorded. Some tools use individual trades, while others distribute data from smaller time intervals. Check the calculation method before treating the profile as a complete record of every transaction at each price.
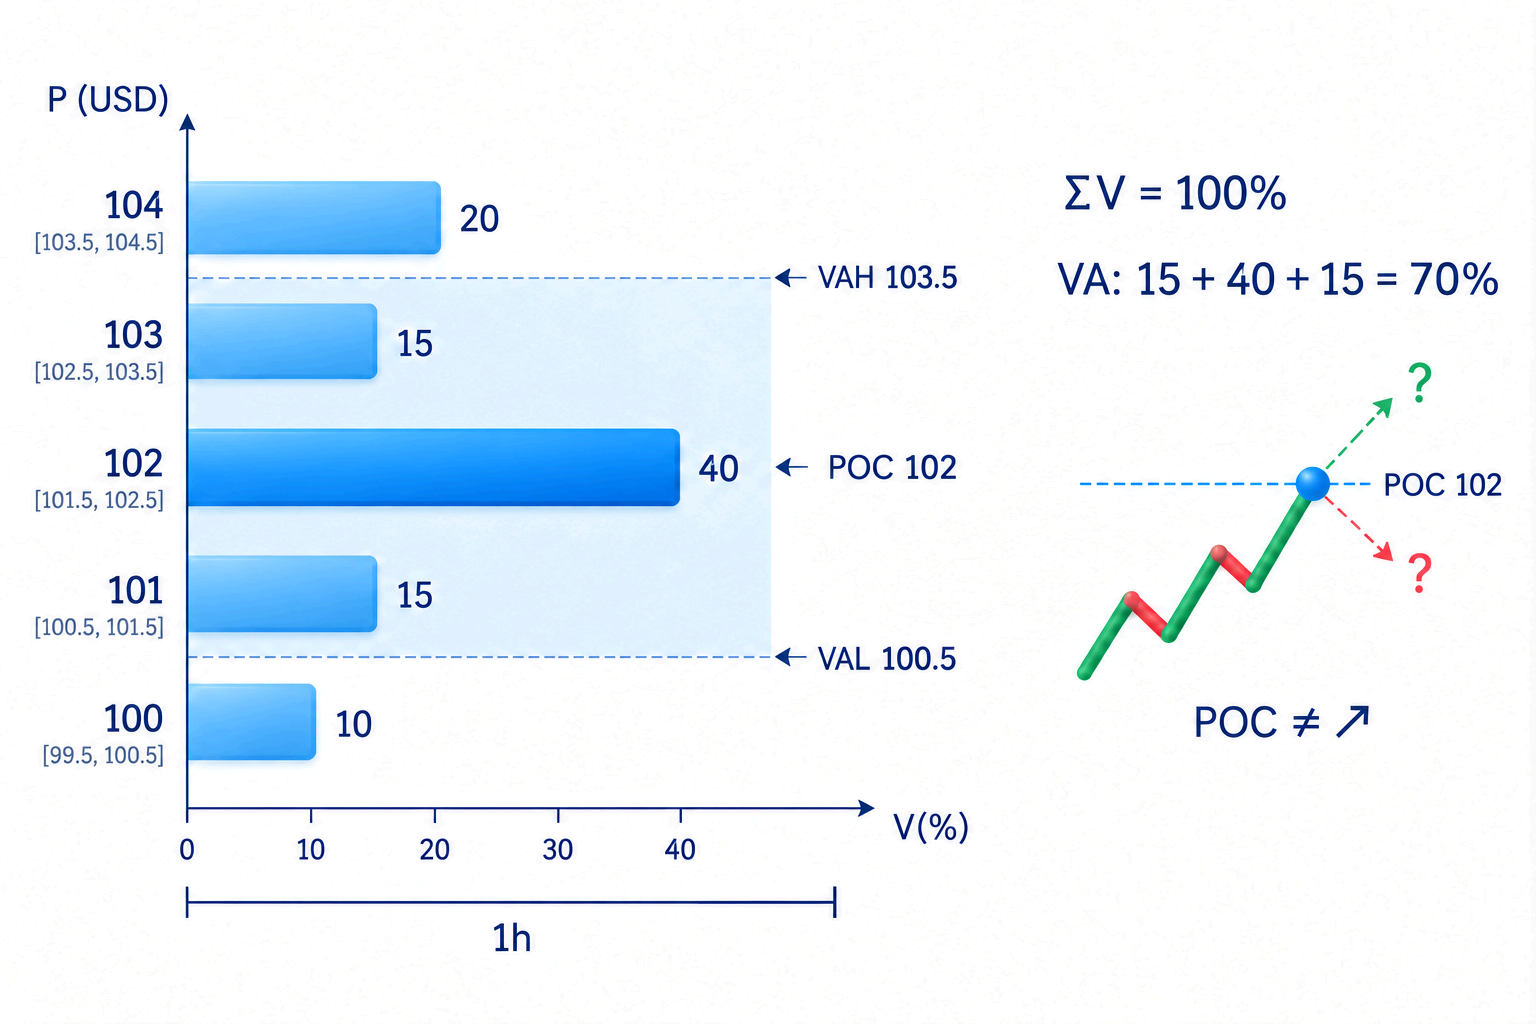
The point of control, or POC, is the profile row with the greatest volume. The value area contains a selected share of the profile's volume, often about 70%. VAH is its upper boundary and VAL its lower boundary. These describe the selected distribution, not the asset's intrinsic value. Being above VAH does not by itself make an asset overpriced.
High-volume nodes, or HVNs, are areas with relatively large recorded volume; low-volume nodes, or LVNs, have relatively little. They show where trading was concentrated and where less was recorded. On a return, check whether price hesitates, reverses or passes through. A dense node does not guarantee a stop, and a thin node does not require a rapid move.
A session profile covers one selected trading session. A composite profile combines a longer period. Changing the period, session hours or price-row size can change the POC and value-area boundaries. Fix those settings before comparing profiles, so that a change in calculation is not mistaken for a change in the market.
Volume Profile is different from the time-based Market Profile developed by Peter Steidlmayer. Its time-price opportunities, or TPOs, mark price areas visited during separate time blocks, commonly half-hour blocks. Several letters at a price show visits in several blocks, not a specified number of contracts.
A time-based POC and a volume-based POC can therefore be different. Initial Balance is the high-to-low range during the profile’s selected opening period, often its first hour; check the session start and number and length of the included time blocks. Single prints are price rows represented by only one TPO time block in the selected profile, not by one trade. A later visit can remove that single-block status.
Platform detection rules and profile settings matter, and neither an opening range nor a single-print area guarantees a future return. A profile describes a distribution across prices; Wyckoff analysis examines price and volume as a developing sequence. Neither description establishes a participant's identity.
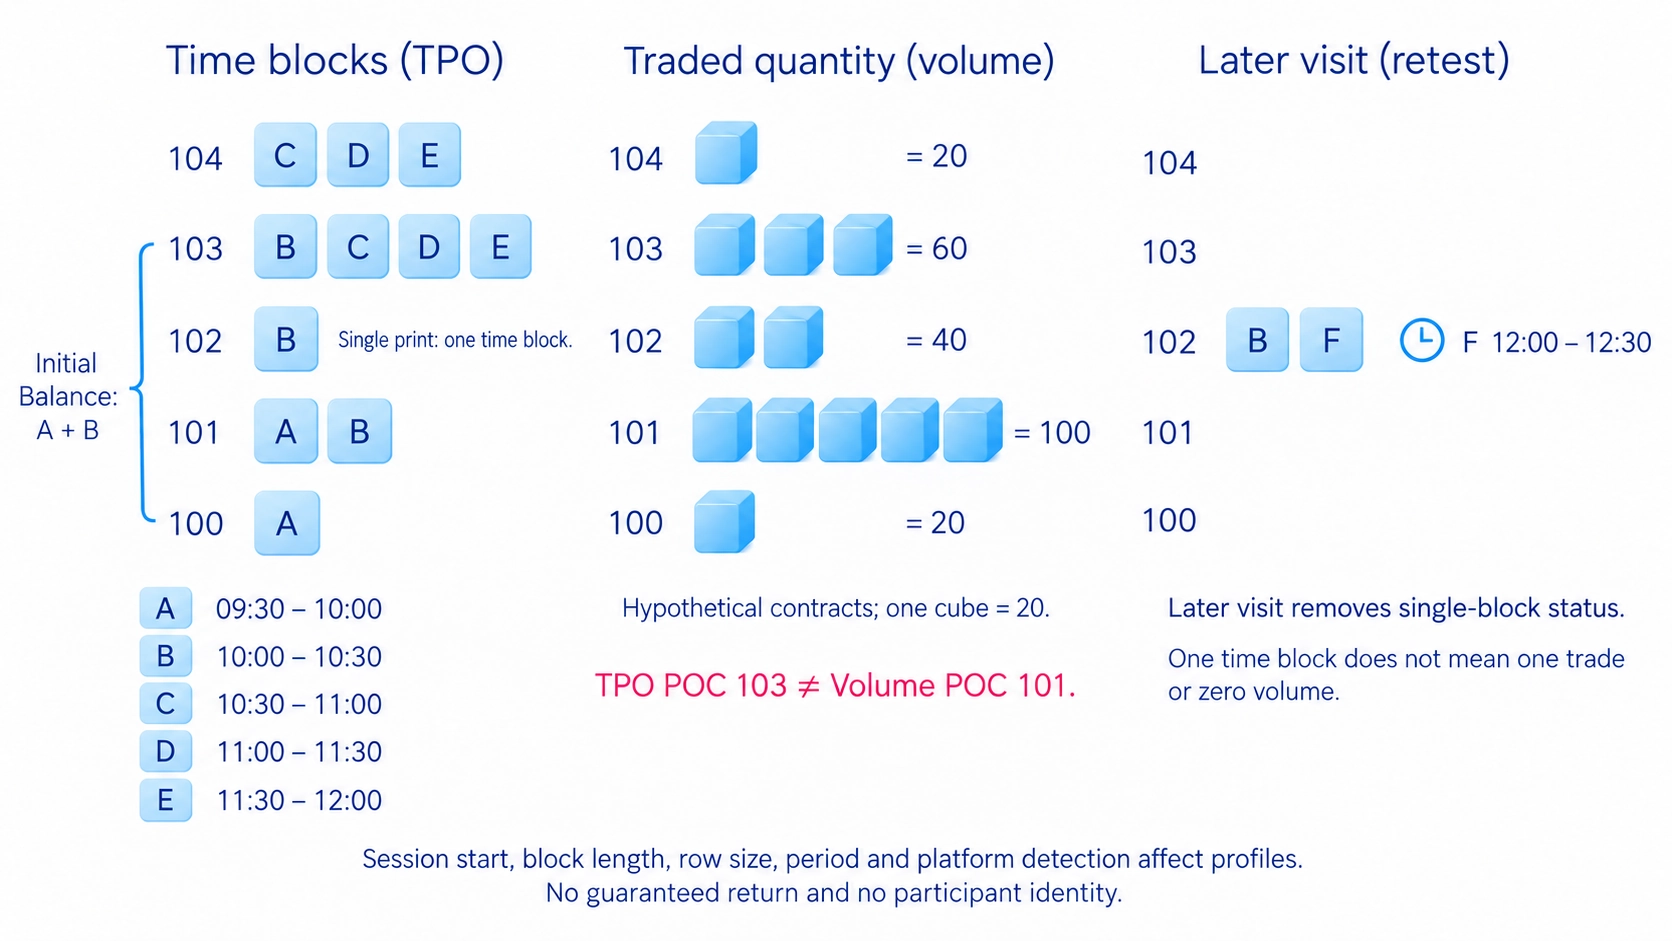
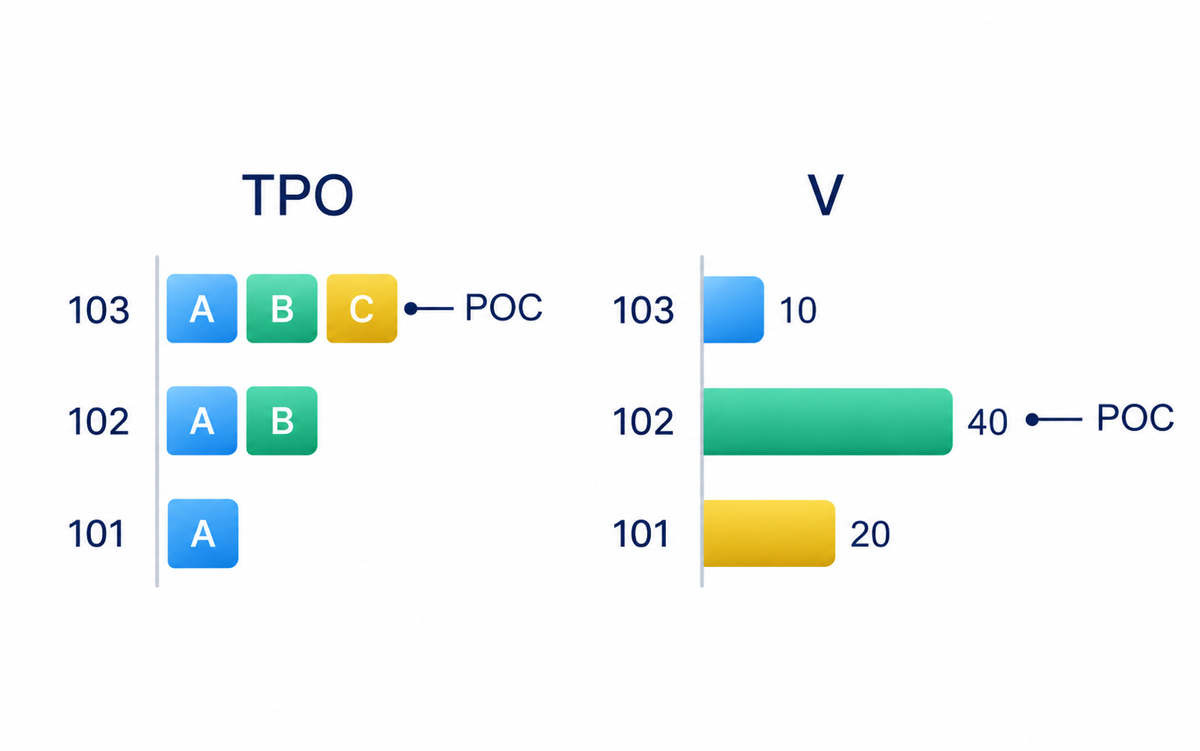
The illustration shows how time marks are arranged. Do not read those letters as exact contract volume. Choose the volume-based tool when traded quantity is the question, and check its units. The volume-weighted average price (VWAP) guide explains a different way of combining price and traded volume.
Footprint charts and volume delta
A footprint, also called a cluster chart, distributes activity inside a candle across price rows. It can show concentrations that an ordinary volume column combines into one total. The meaning of its columns depends on the feed and calculation, so the labels Buy and Sell need checking.
With classification by the side that accepted the available opposing price, volume delta is aggressive buying volume minus aggressive selling volume. Buying at the available seller's price belongs to the first category; selling at the available buyer's price belongs to the second. Positive delta means more volume in the first category. It does not mean there were no sellers: each trade still had both sides.
Not every platform receives that classification directly. TradingView's footprint, for example, categorises volume using price movement within smaller intervals. That is a calculated estimate, not a direct identification of the initiating side of every trade. Its historical detail can also change with the available lower-interval data. Read the methodology before comparing live observations with historical footprints.
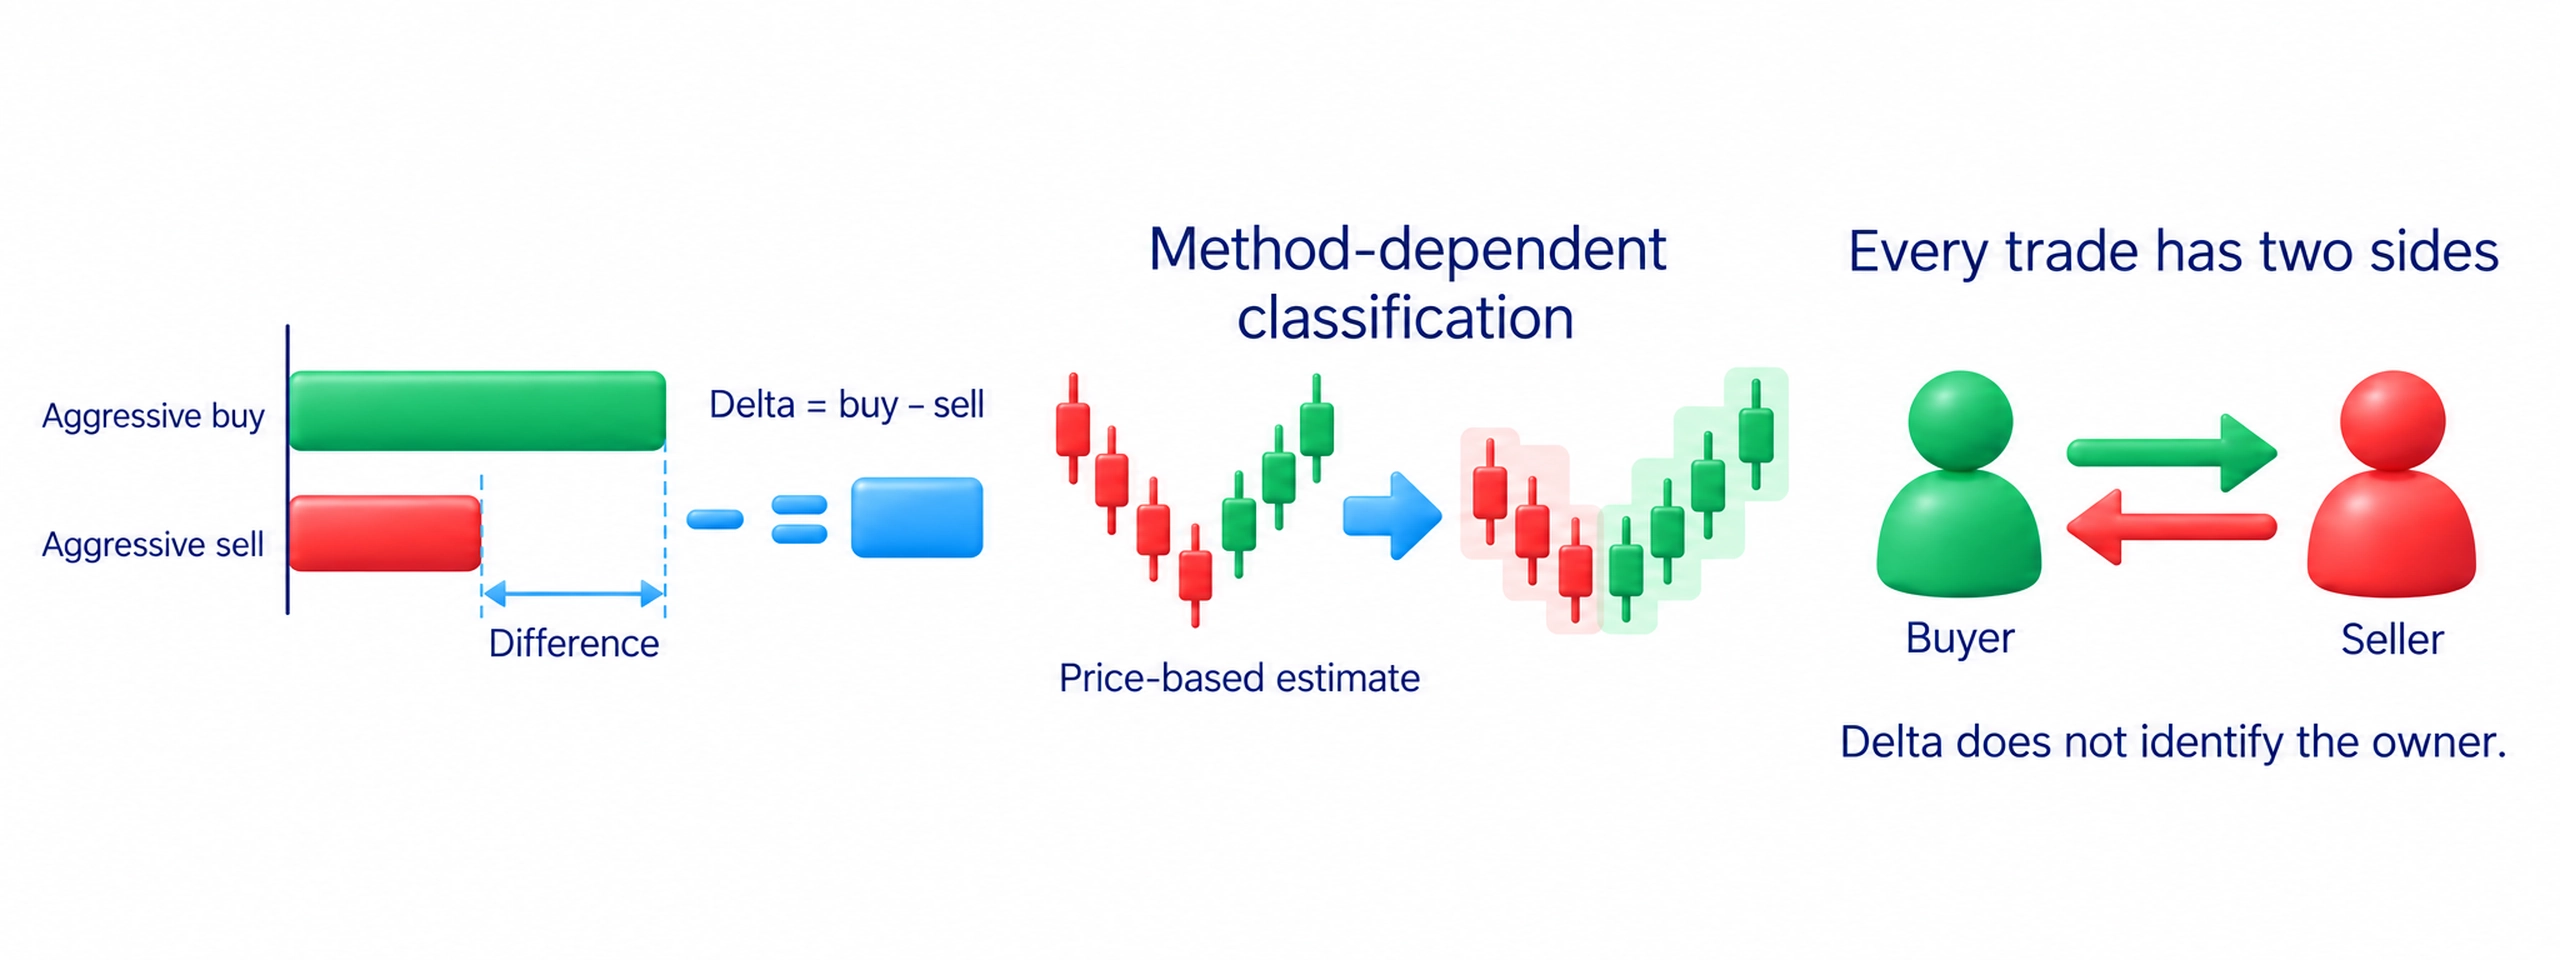
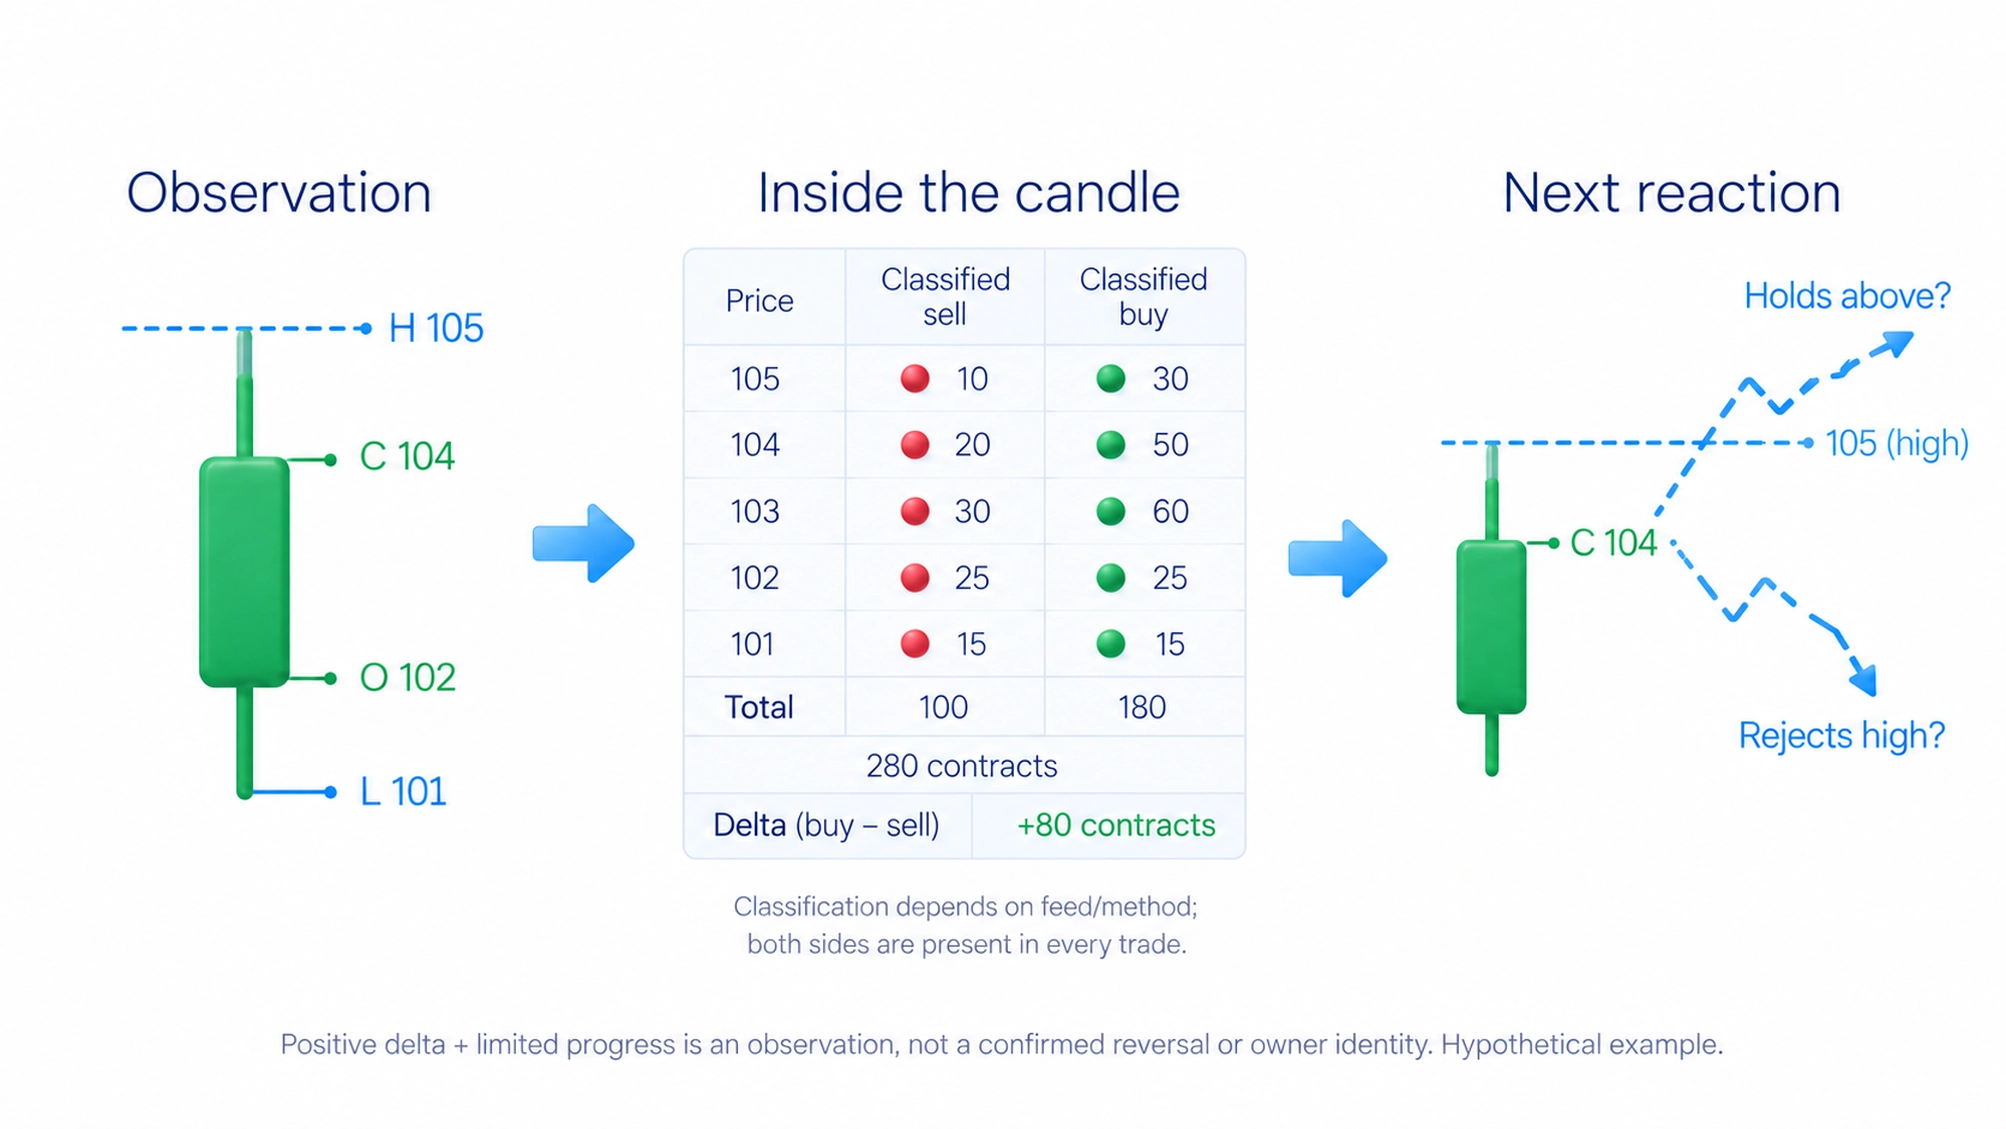
When positive delta accompanies little upward progress, examine the high and the next reaction. Aggressive buying may have met enough selling to limit the rise, but that observation alone does not confirm a reversal. Delta adds detail without identifying the owner of an order or replacing the price response.
How I apply volume analysis
In the course's effort-versus-result example, I examine gold futures. A rise on high volume stalls, price moves into a range and the next attempt to rise does not continue. Lower levels then form as the structure changes. The decision follows that sequence rather than the first unusually large column.
I then look for a return towards the area of the earlier effort and check whether the new direction resumes. In the course example, the return towards the breakout area has lower volume; renewed decline follows and establishes another level. Lower pullback volume alone is not an entry signal. Location, reaction and subsequent movement matter. The chart-reading guide explains how to mark price areas for that comparison.
For practice, choose one instrument and record volume, range, closing position and the next move around one area. Write the observation before the interpretation: for example, activity was greater than in neighbouring candles and the new low did not hold. Then state the idea and what would contradict it. That keeps a visible result separate from a story about a fund definitely buying.
Before entering, set a loss budget using the risk-management rules. A convincing volume observation does not make a failed trade harmless. My video on exchange volume adds a practical explanation of futures contract data; the written method above is complete without it.
Frequently asked questions
Exchange volume shows the quantity traded during a period, such as shares or futures contracts. The number of transactions is a different measure. Check the source: tick volume counts quote updates rather than contract quantity.
Wyckoff's approach compares volume with price progress. High activity with limited progress is a reason to examine whether movement is stalling. One candle cannot confirm a reversal or identify a particular participant's intentions.
High exchange volume shows active trading during the breakout, not guaranteed continuation. Tick volume instead records quote updates, so check the data source. Check whether price holds beyond the area and what happens on a return. In my approach, the sequence of reactions matters more than the column alone.
POC is the price row with the greatest volume in the selected profile. Its position depends on the data, period and row size. It marks past activity, not a compulsory destination for the next move.
You can examine activity in the available Forex feed, but first identify the measure. Retail tick volume counts quote updates; it is not the combined transaction volume of the global currency market.
Not in my approach. I compare volume with location, price progress and the subsequent reaction. Without those conditions, a high or low column does not determine a trade's direction.
About the author
Igor Arapov, practising trader since 2013 and author of the ArapovTrade library. ORCID: 0009-0003-0430-778X.




