VWAP, the volume-weighted average price, describes the average recorded price from a specified starting point, giving more weight to prices associated with more trading. It helps compare the current price with that calculated average. It does not reveal an asset’s fair value, a fund’s intentions or where price must move next.
What VWAP shows
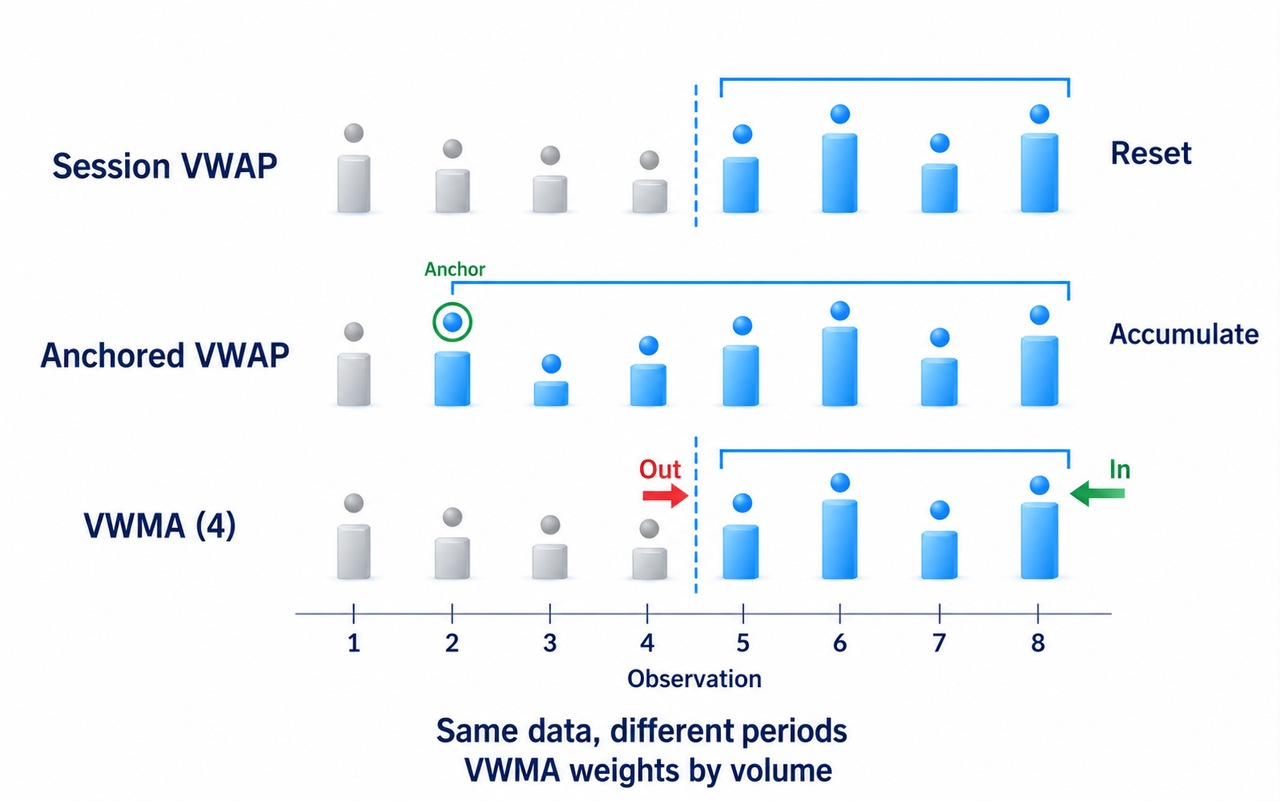
A session VWAP averages recorded trading prices, giving greater weight to prices associated with larger traded quantities. Its calculation starts again at the beginning of each trading session. Other settings can start at the beginning of a week, a month or a selected event. Before reading the line, check its starting point: two indicators called VWAP can cover different periods.
The average need not be the price at which most trading occurred. Trading can be concentrated at two distant prices while the average falls between them. Nor does VWAP identify a large participant or show which holdings remain. A distribution of trading across price levels requires more information than one average.
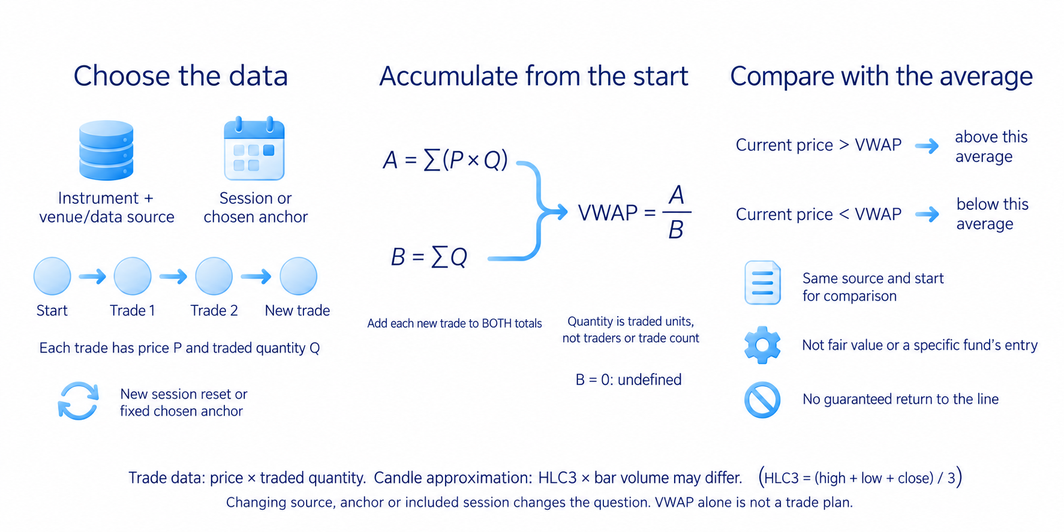
How VWAP is calculated
When individual trades are available, multiply each trade’s price by its quantity, add those products and divide by the total quantity. In symbols, VWAP = sum of (price × quantity) / total quantity. Every observation must belong to the same selected period. Quantity means units traded, such as shares or contracts, not the number of people trading.
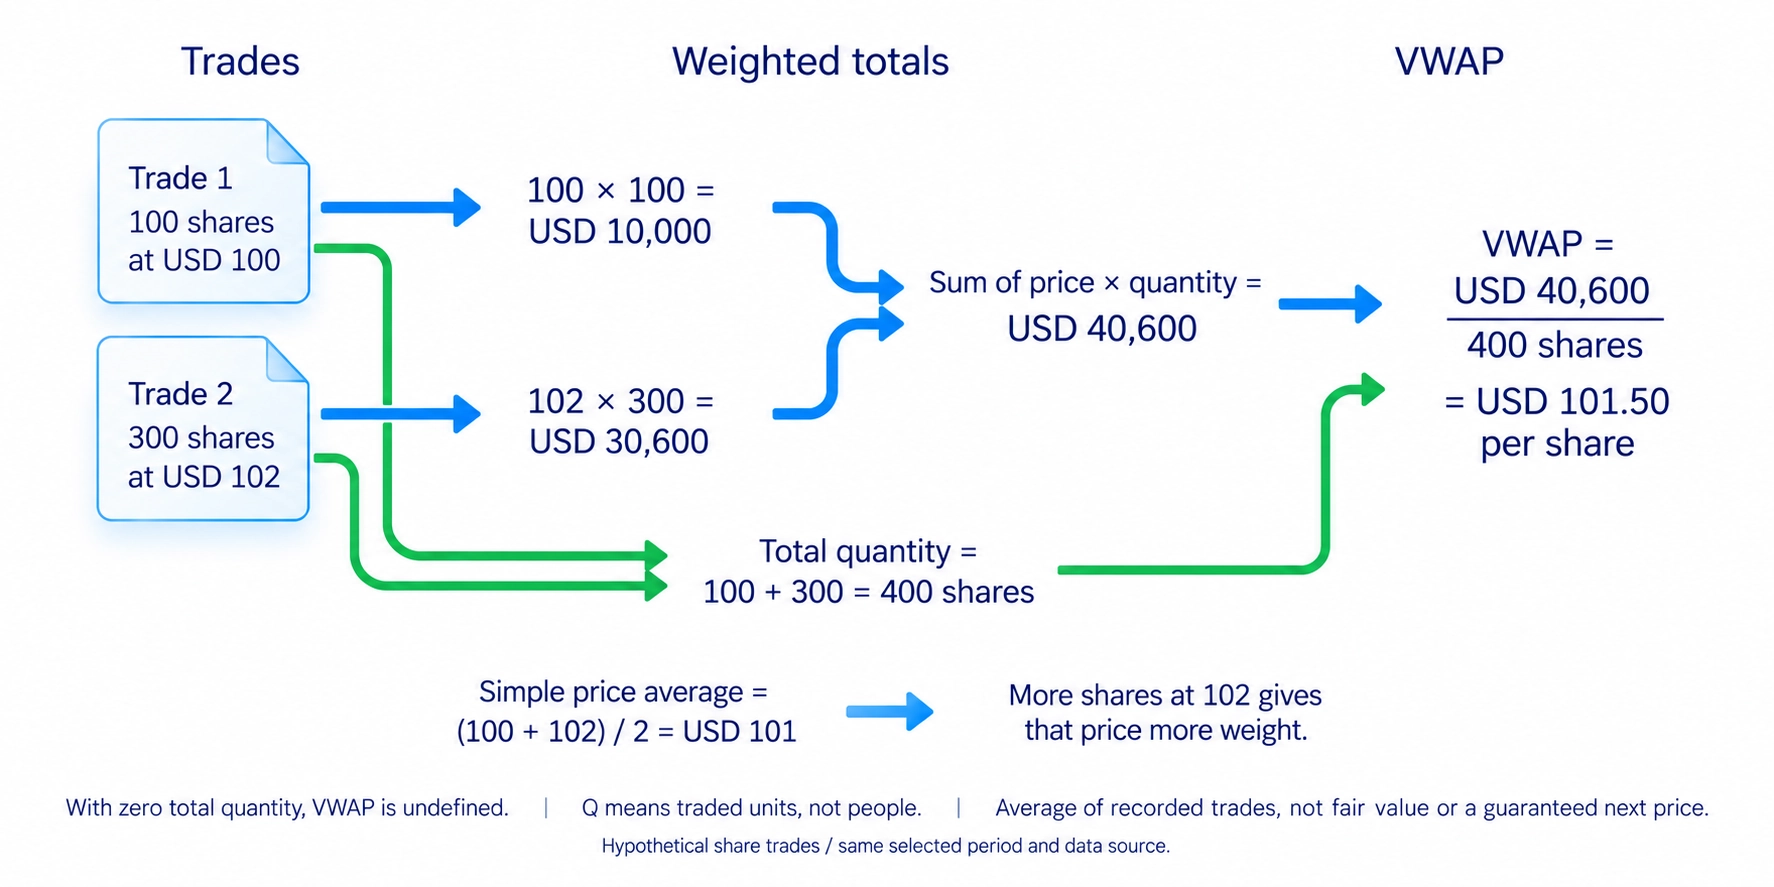
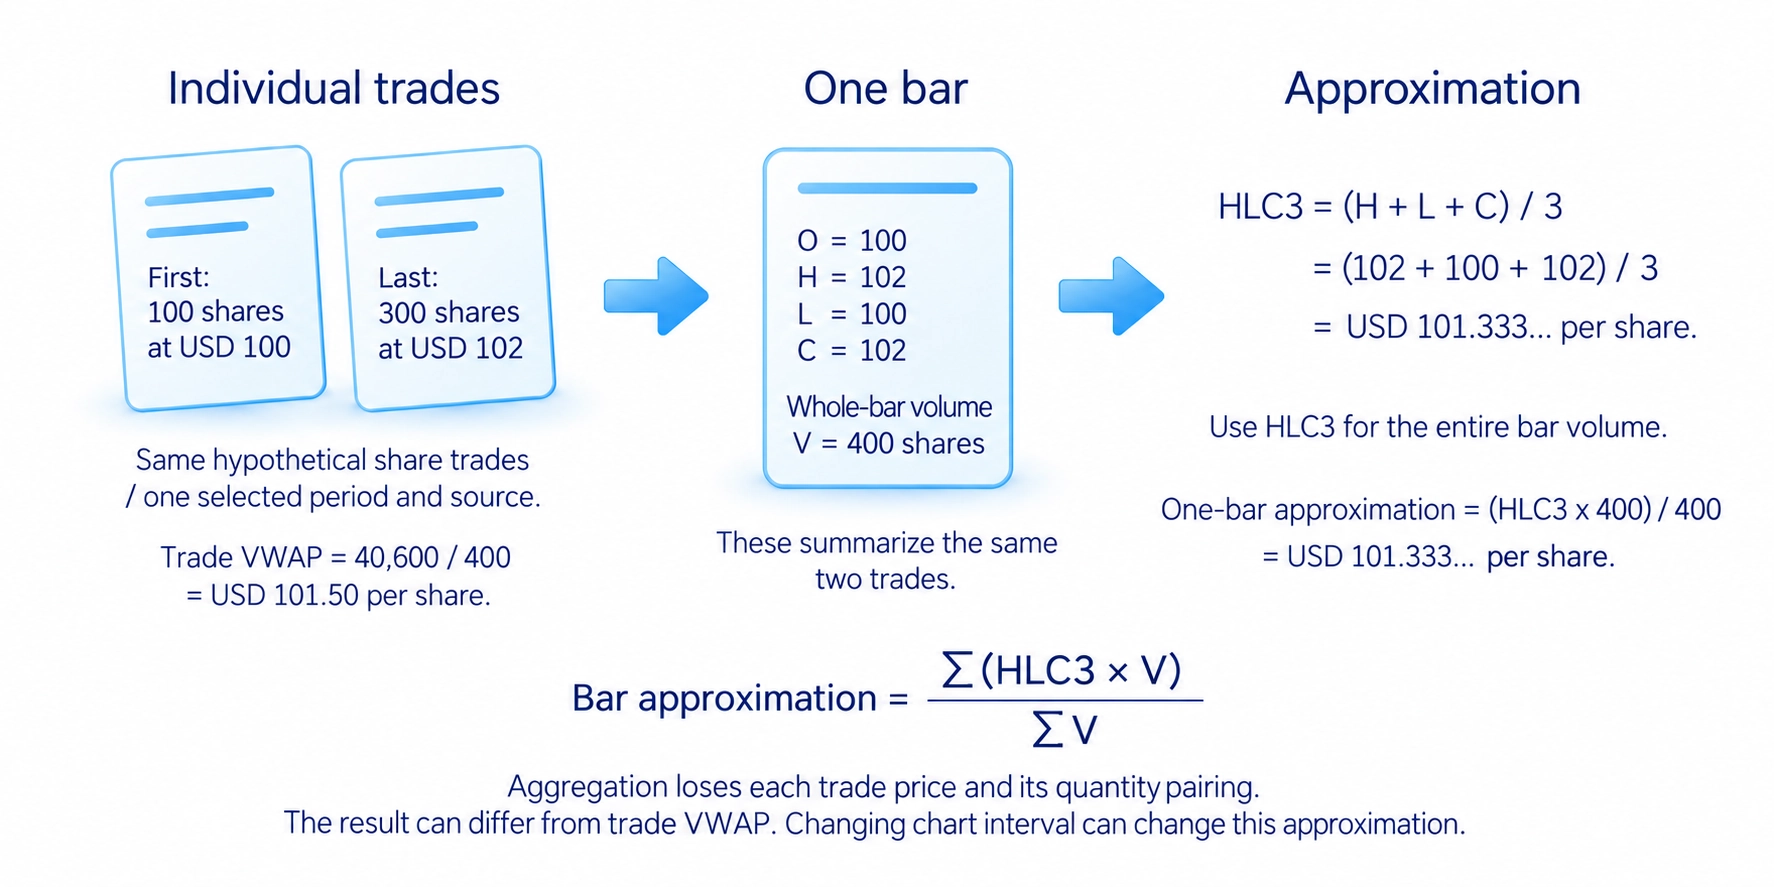
Chart indicators often approximate this calculation using bars, the individual periods on the chart. A common representative price is HLC3: add the bar’s high, low and close, then divide by three. Multiply that price by the bar’s entire volume. HLC3 does not preserve the prices of individual trades within the bar, so this result can differ from a trade-by-trade average. Changing the chart interval can change the approximation too.
Consider two hypothetical share trades. First, 100 shares trade at USD 100; then 300 trade at USD 102. Total quantity is 400 shares and the sum of price times quantity is USD 40,600. VWAP is 40,600 / 400 = USD 101.50.
The simple average of the two prices is USD 101. VWAP lies closer to USD 102 because more shares traded there. These are teaching numbers, not readings taken from the illustration.
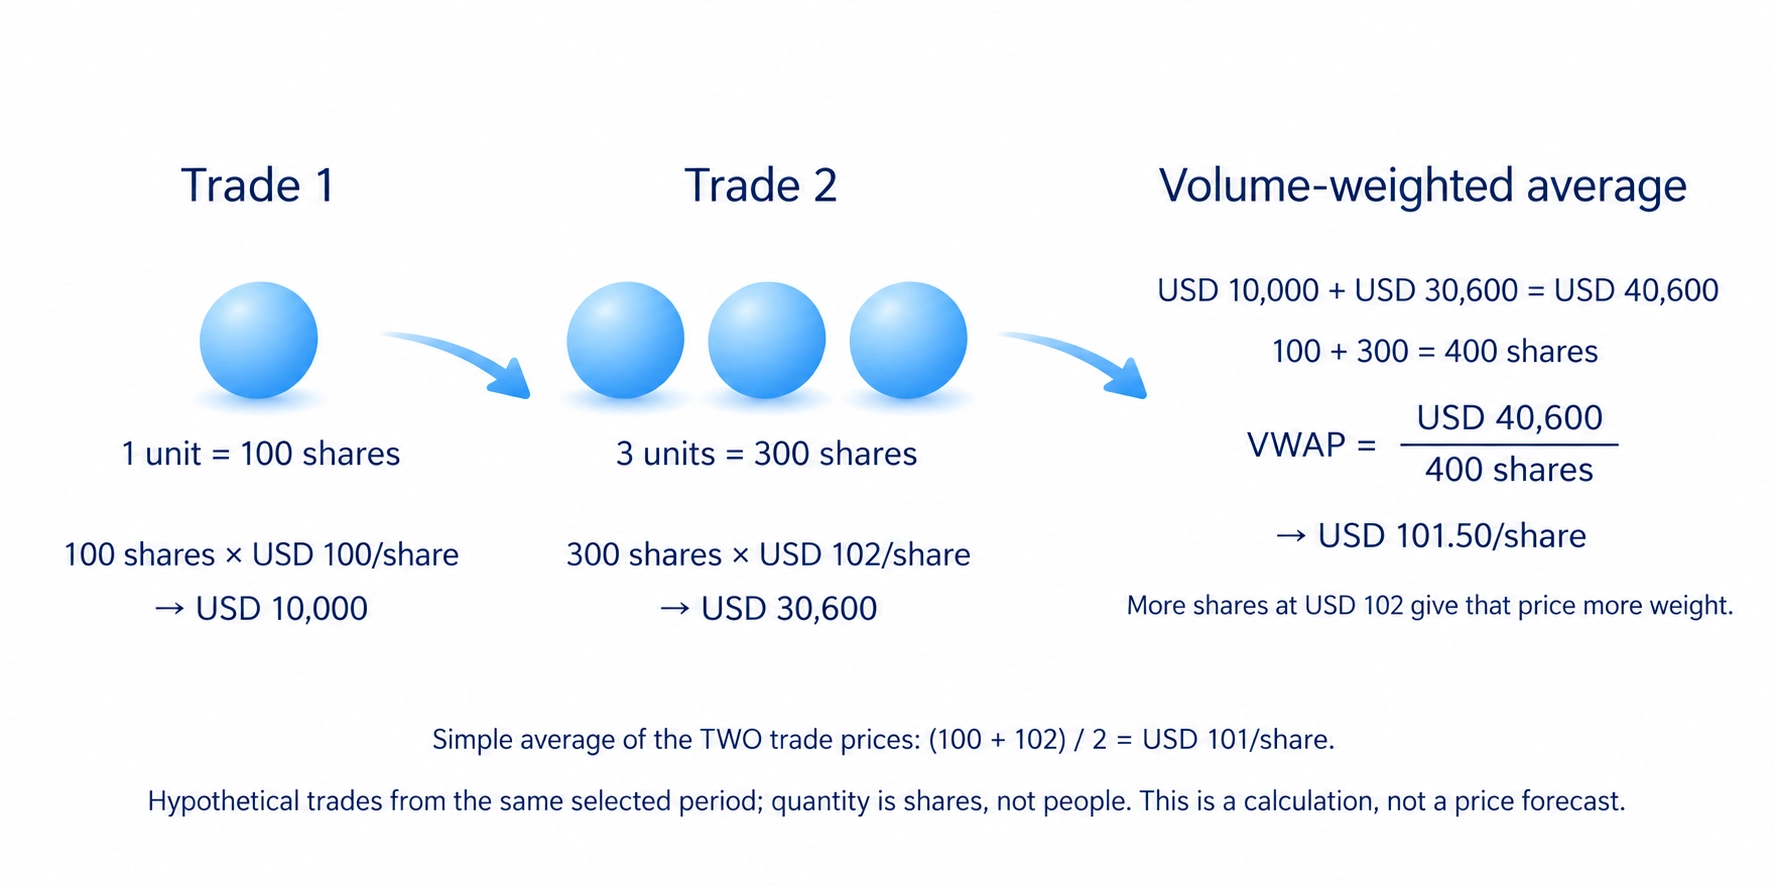
Each new observation adds to the accumulated totals. As earlier volume builds up, a new trade of the same size has less influence on the average. A sufficiently large new quantity can still move it substantially. With zero total volume, the division is undefined: a usable VWAP needs suitable volume data.
VWAP versus moving averages
A simple moving average usually averages prices over a fixed number of recent periods. Session VWAP accumulates price and volume from the session’s starting point. It does not discard the earliest bars after a fixed number of new bars unless a particular implementation explicitly uses a rolling window.
A volume-weighted moving average, or VWMA, also uses volume, but normally covers a rolling window. The oldest bar leaves when a new one enters. Anchored VWAP keeps accumulating from its selected start. Before comparing these lines, check the calculation, price source and starting point rather than their colours alone.
Data sources and trading sessions
VWAP uses the trades supplied by its data source. Futures data can describe one contract on one exchange. Share data can cover a single venue or a combined feed. Do not assume that every share chart includes all trading in that share: first check which trades the provider includes.
The same cryptocurrency pair can have different trades, prices and volumes on different exchanges. One exchange’s VWAP is not the average entry price of every holder of the coin. In a market open around the clock, a daily reset is a selected boundary. Check its time and rules. Switching data providers can change the line without changing the formula.
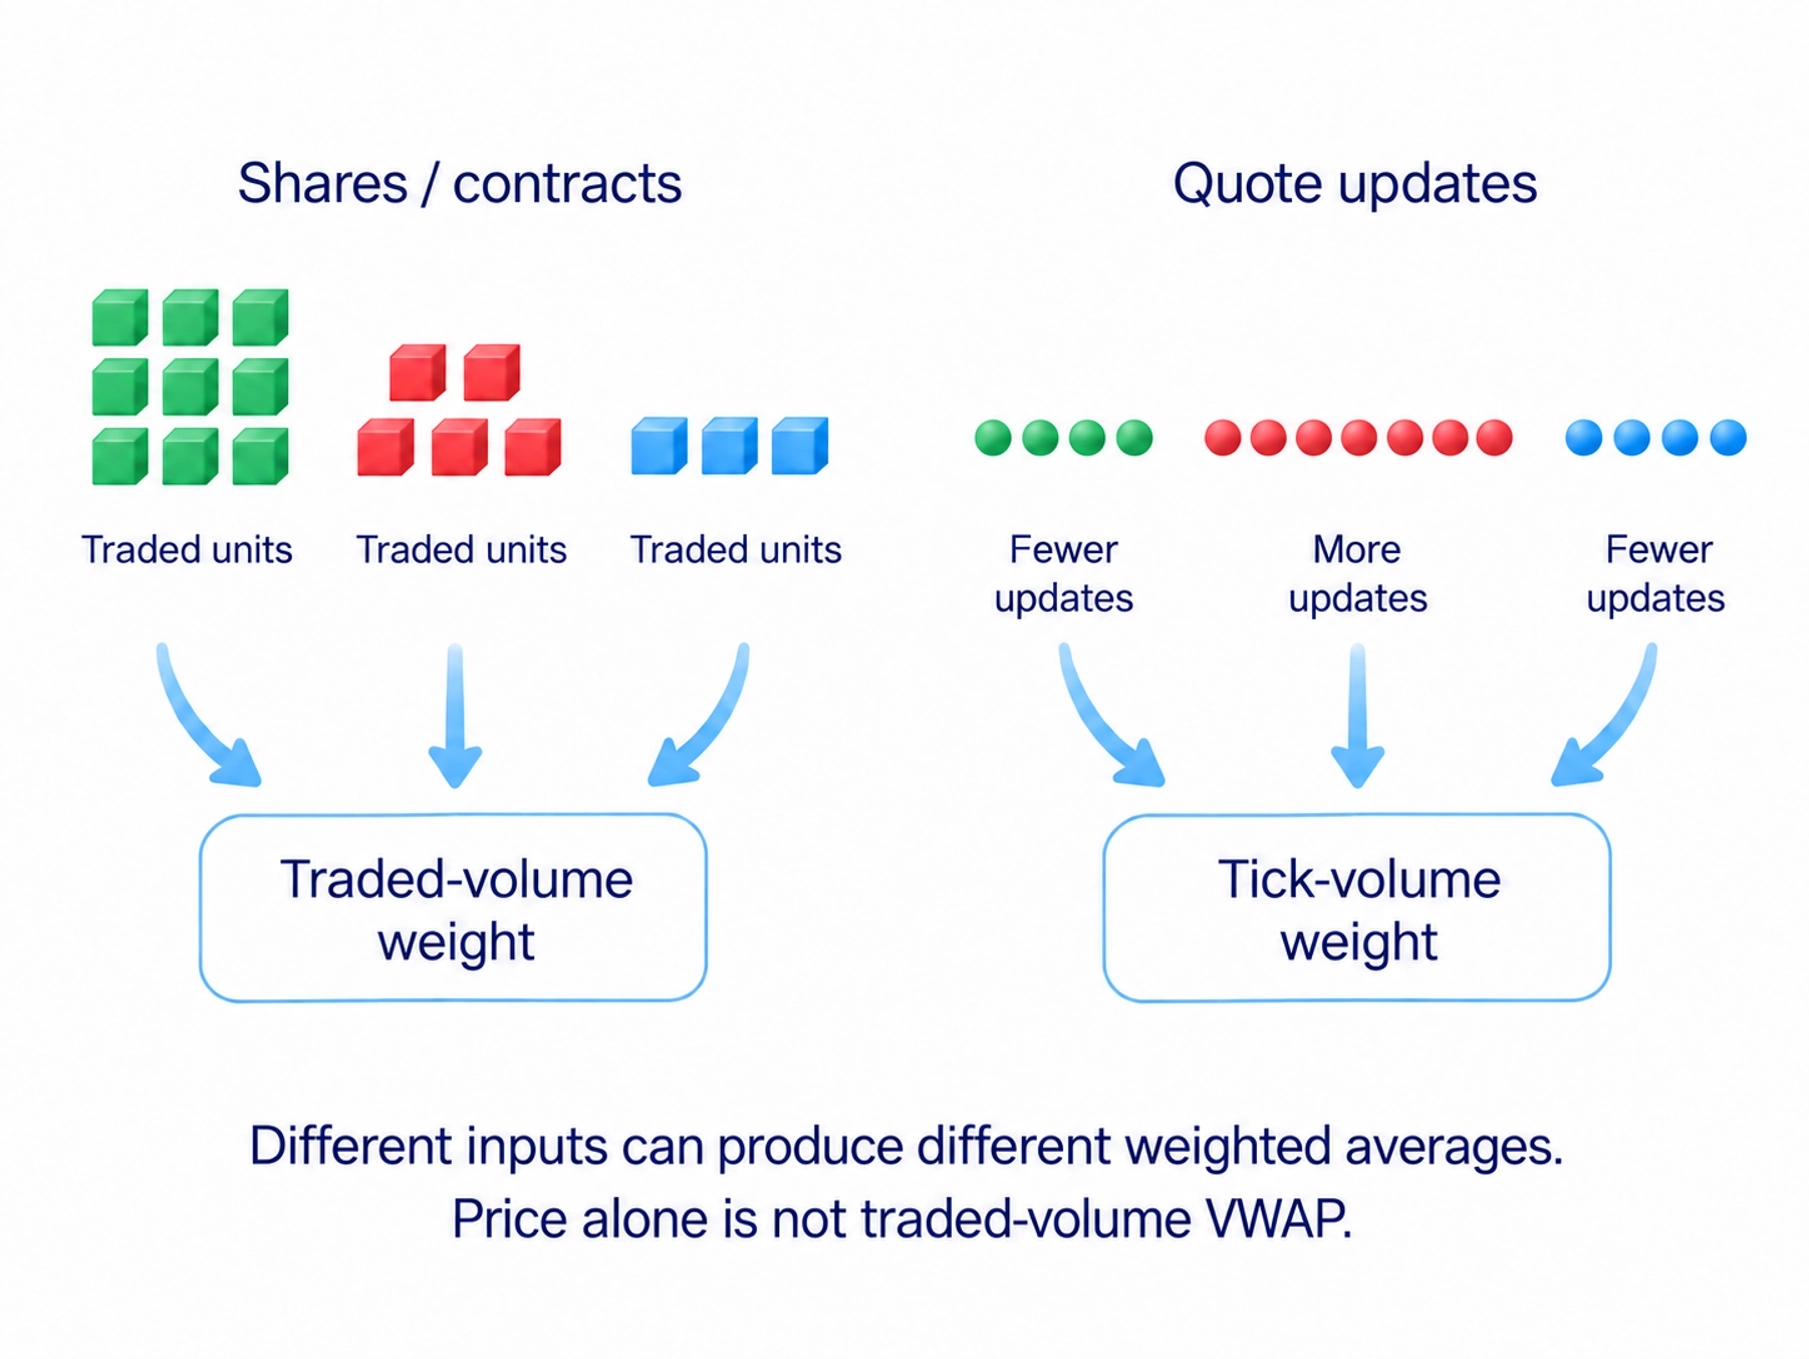
Some currency pairs and contracts for difference, products based on a price change rather than ownership of the asset, supply tick volume: counts of quote updates instead of traded units. Weighting prices by those updates measures something different from weighting by shares or contracts. Without volume, price alone cannot produce a traded-volume VWAP. The volume-analysis guide explains these data distinctions.
For a session line, check whether the calculation includes trading before and after the main session. Platforms can include different bars. Match the instrument, provider, session, price source and chart interval before comparing values. On an unfinished bar, its high, low, close and volume can change, so the current VWAP can change too.
VWAP as an execution benchmark
VWAP can be a benchmark for evaluating an order’s execution over an agreed period. A purchase average below the comparable benchmark is cheaper relative to it; for a sale, the comparison reverses. The period and data must match. Comparing a morning purchase with the whole day is a different assessment that includes subsequent market movement.
An execution algorithm can distribute a large order over time while trying to approach VWAP. Interactive Brokers describes its VWAP algorithm as a best-effort attempt: reaching the benchmark or filling the entire order is not guaranteed. An algorithmic order and a calculated line on a chart are different tools.
That use does not establish that every fund buys near the line or that price must return to it. VWAP averages completed trades involving both buyers and sellers. It does not reveal a particular buyer’s entry, later exits or remaining holdings. You cannot conclude that everyone who bought above VWAP is still holding a loss.
Reading VWAP on a chart
Price above the line is above the calculated average for the selected period; price below it is below that average. This is a comparison, not an instruction to buy or sell. Sustained movement on one side can help describe the current trend. A large distance from the line does not automatically make the asset expensive or cheap.
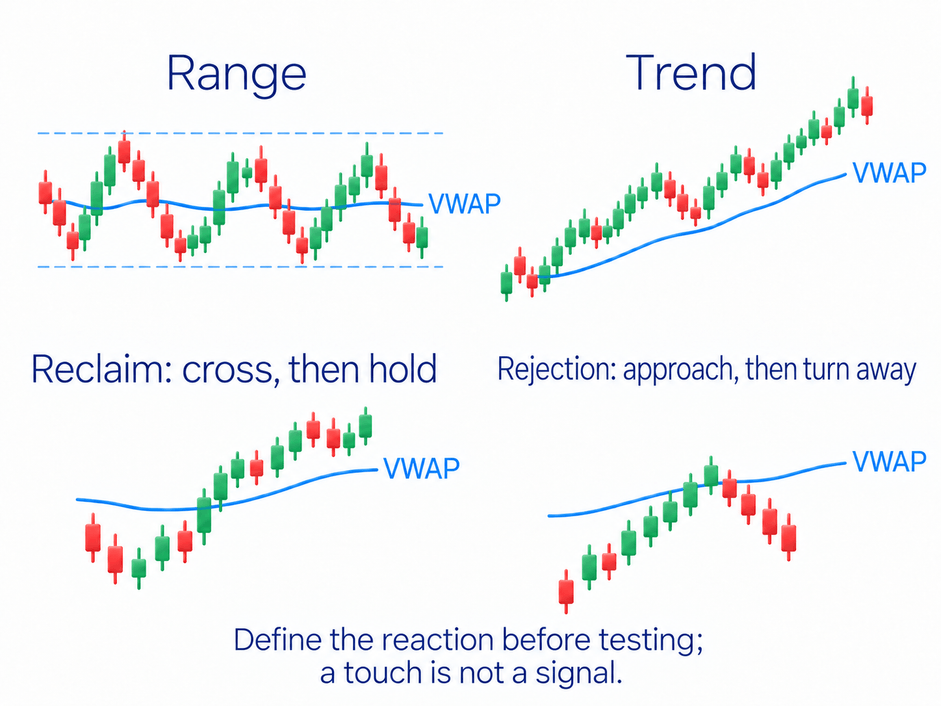
Near VWAP, observe whether price pauses, crosses and returns, or continues through. A reclaim describes a move back across the line followed by holding on the other side; a rejection describes an approach followed by a turn away. Define what counts as holding or turning before testing the observation. A touch alone does not establish either outcome.
Start with price structure and meaningful levels, then ask whether VWAP adds useful information. The chart-reading guide develops that first step. A price level and VWAP at the same place are not necessarily independent confirmations: both can reflect the same price history. Record the subsequent reaction instead of assuming the overlap will hold.
In a range, price can cross the average repeatedly without sustained continuation. In a trend, it can move away and never return before the chosen period ends. A rule expecting a return and a rule expecting continuation are different rules. Do not switch between them after seeing which would have worked.
What VWAP bands show
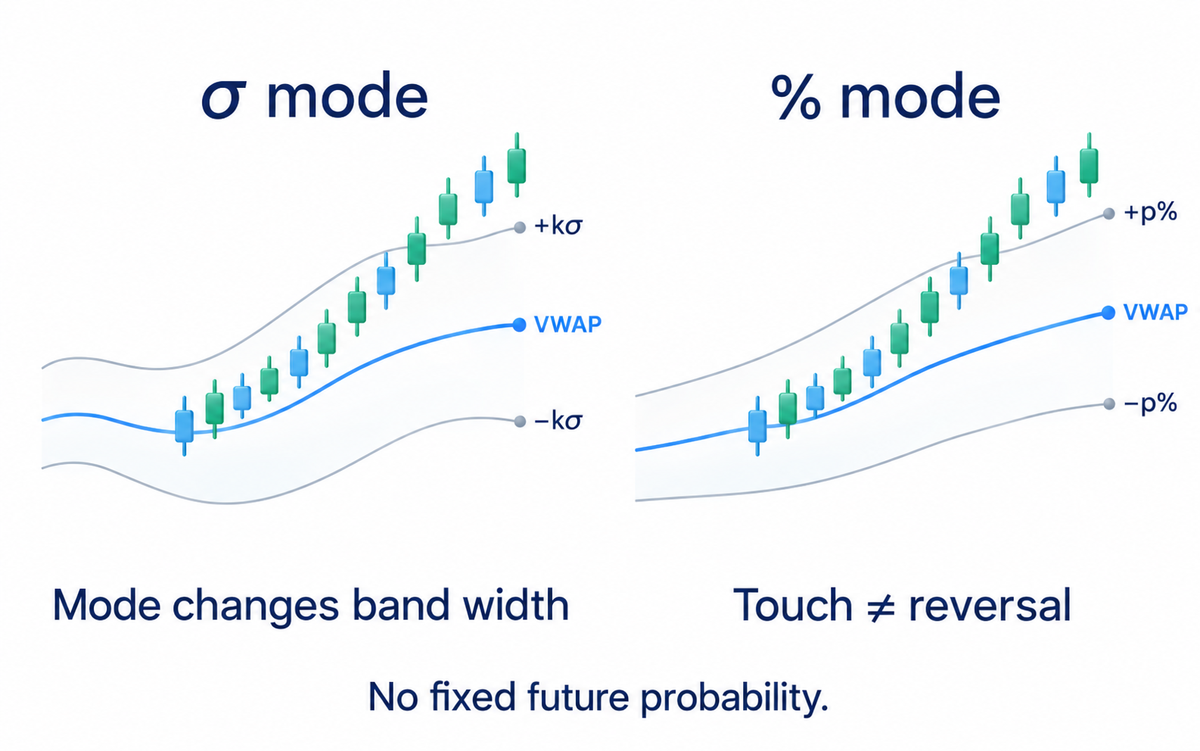
VWAP bands plot boundaries above and below the average. TradingView offers a standard-deviation mode, which measures how widely prices differ from the average, and a percentage mode. The formula for that spread and volume weighting depend on the implementation. The same multiplier can therefore produce different widths in different modes.
Touching an upper band shows a distance from the selected calculation, not compulsory overpricing; touching a lower band does not compel a recovery. Two bands do not establish a fixed probability that future prices will stay inside them. During sustained movement, price can continue near an outer boundary instead of returning to the centre.
Setting up VWAP and Anchored VWAP
In TradingView, add Volume Weighted Average Price to the price chart. Check Anchor Period, which sets the start or reset, Source, which chooses the price input, and the band mode. HLC3 was defined above. A session calculation on a chart where one bar represents the entire session loses the within-session detail. Use a smaller chart interval if that detail is the task.
Anchored VWAP accumulates from a selected point, such as an event or a visible high or low, rather than necessarily resetting every day. With a fixed anchor, subsequent data keep entering the same totals. Moving the anchor changes the period being described and therefore changes the question the line answers.
Choose a manual anchor for an identifiable reason, not by moving it after a failed observation until the chart looks convincing. If a low was only identifiable after later bars, a historical test must not treat its selection as available earlier. An automatic anchored indicator can move its start when a new extreme or maximum-volume bar appears. Read that rule separately from the behaviour of a fixed manual anchor.
Using VWAP in learning
My course’s section on volume analysis examines trading activity and the response of price. That provides a basis for reading the market; it is not a separate personal VWAP strategy. The average can help describe a selected period, while the behaviour of price near meaningful areas still needs to be observed directly.
The optional video on indicator lag explains limitations of calculations derived from earlier movement. To test a VWAP condition, record the data source, starting point, reaction required and time of observation. Compare the same actions with and without that condition, retaining failures as well as apparent successes. The risk-management guide addresses the planned money loss; an attractive line does not set that budget.
Frequently asked questions
It shows an average from a specified start, giving greater weight to prices associated with larger traded quantities. It does not show fair value, the most-traded price or the remaining holdings of a particular fund.
Session VWAP accumulates price and volume from a session’s start. A simple moving average usually covers a fixed recent window. A volume-weighted moving average (VWMA) also weights prices by volume but normally uses a rolling window.
Use it where suitable volume data are available, and identify their source. A session VWAP used to study movement within the day needs an intraday chart. An anchored calculation can cover a longer period. Neither is a market-wide average unless the underlying data actually cover that market.
An average alone does not specify a complete trade. Above or below the line is not a ready-made signal. Define the reaction, entry, exit and permitted loss before testing a rule.
The starting point differs. Anchored VWAP accumulates from a chosen point without a compulsory daily reset; session VWAP begins a new calculation with each session.
About the author
Igor Arapov, practising trader since 2013 and author of the ArapovTrade library. ORCID: 0009-0003-0430-778X.




