Smart Money is a name for large professional participants and their capital. Smart Money Concepts, or SMC, is an approach to interpreting possible activity through price structure and marked areas on a chart. The useful task is to form a scenario, check the reaction when price reaches an area and decide whether the idea still holds. A marked area does not reveal which bank bought or where price must go next.
Who are Smart Money?
Banks, investment funds and other professional participants can trade large positions and have advantages in infrastructure, execution speed and access to data. Size does not make them infallible. Large participants also lose money and take opposing positions.
Their objectives differ. A fund may buy for long-term ownership, a company may exchange currency to make a payment, and a market maker may quote buying and selling prices while managing positions held. These trades are not all part of one coordinated plan against retail traders. Price develops through the interaction of orders serving different purposes.
In my approach, Smart Money provides a question to investigate: where is activity substantial while price makes less progress? I compare the price area, volume and subsequent reaction. That helps assess a change in the balance between buying and selling without pretending to identify an individual participant.
Why large orders are split
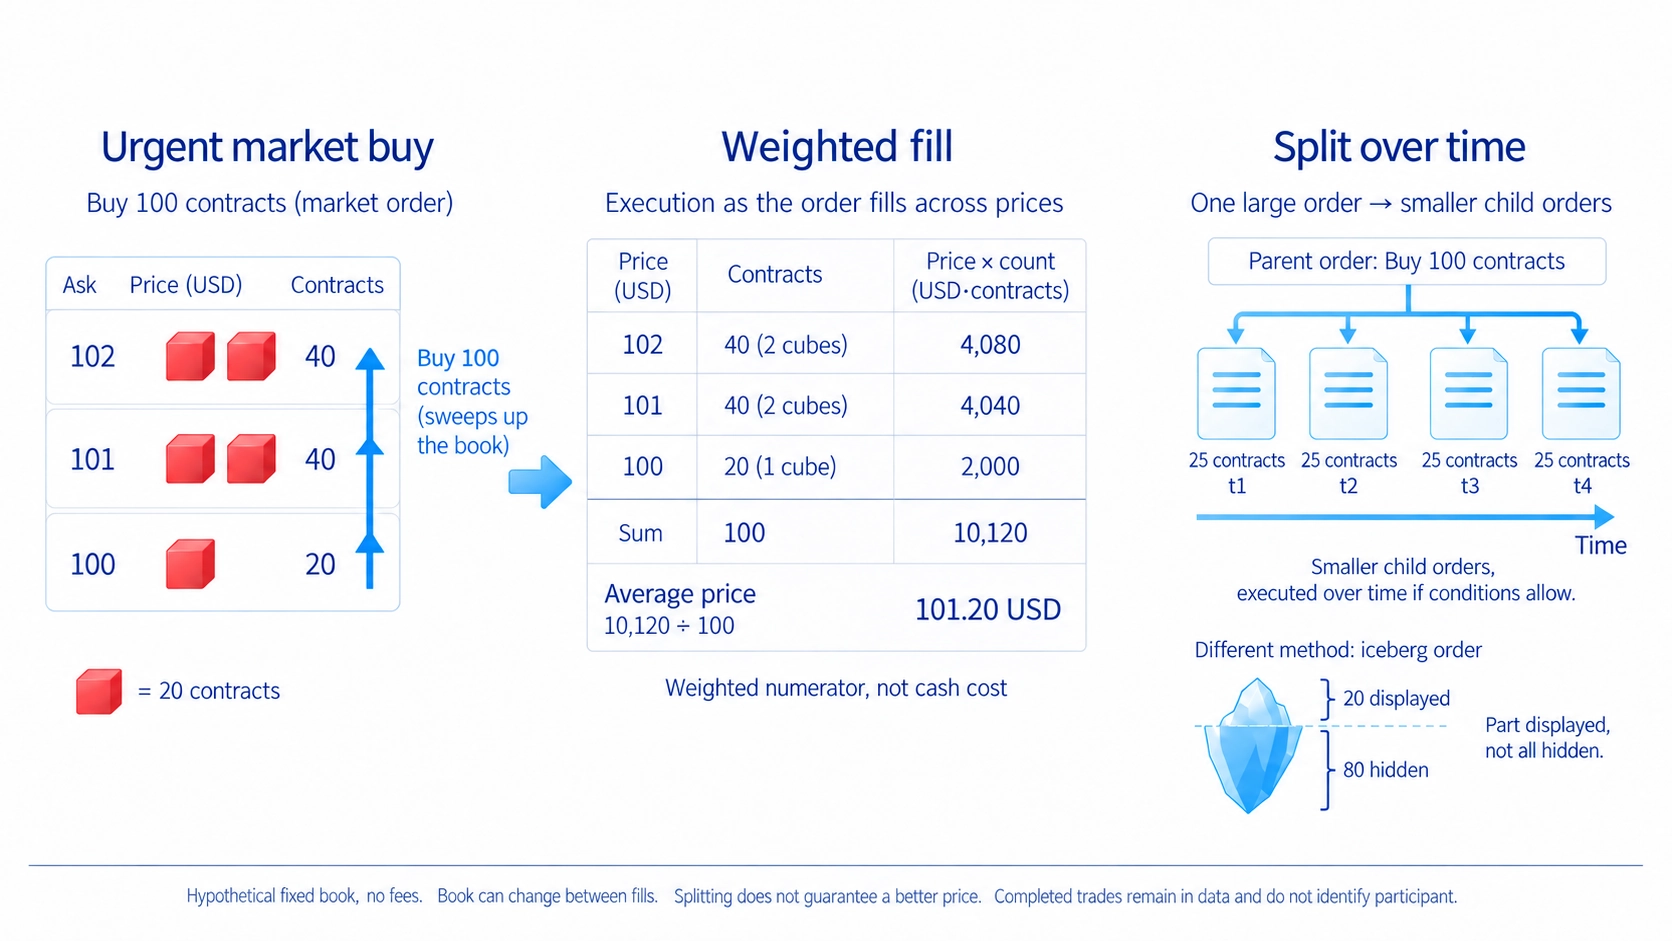
A large purchase needs enough offers to sell. If little is available at the nearest price, a market order takes offers at progressively higher prices and the average purchase price becomes less favourable. The impact depends on the quantity available and how urgently the order must be completed.
An institution may split an order into smaller pieces and spread execution over time. An iceberg order displays only part of its total quantity, with more kept hidden. These methods help manage execution; they do not make every transaction invisible or guarantee a better outcome. Concealing an order's full size through a permitted order type is not inherently manipulation.
Order splitting explains why one chart bar, which records a period of trading, does not reveal an entire position. Several small trades may belong to one instruction, while heavy total trading may come from many participants. The market-microstructure guide explains how orders meet and what displayed and executed data can tell you.
Smart Money and the Wyckoff method
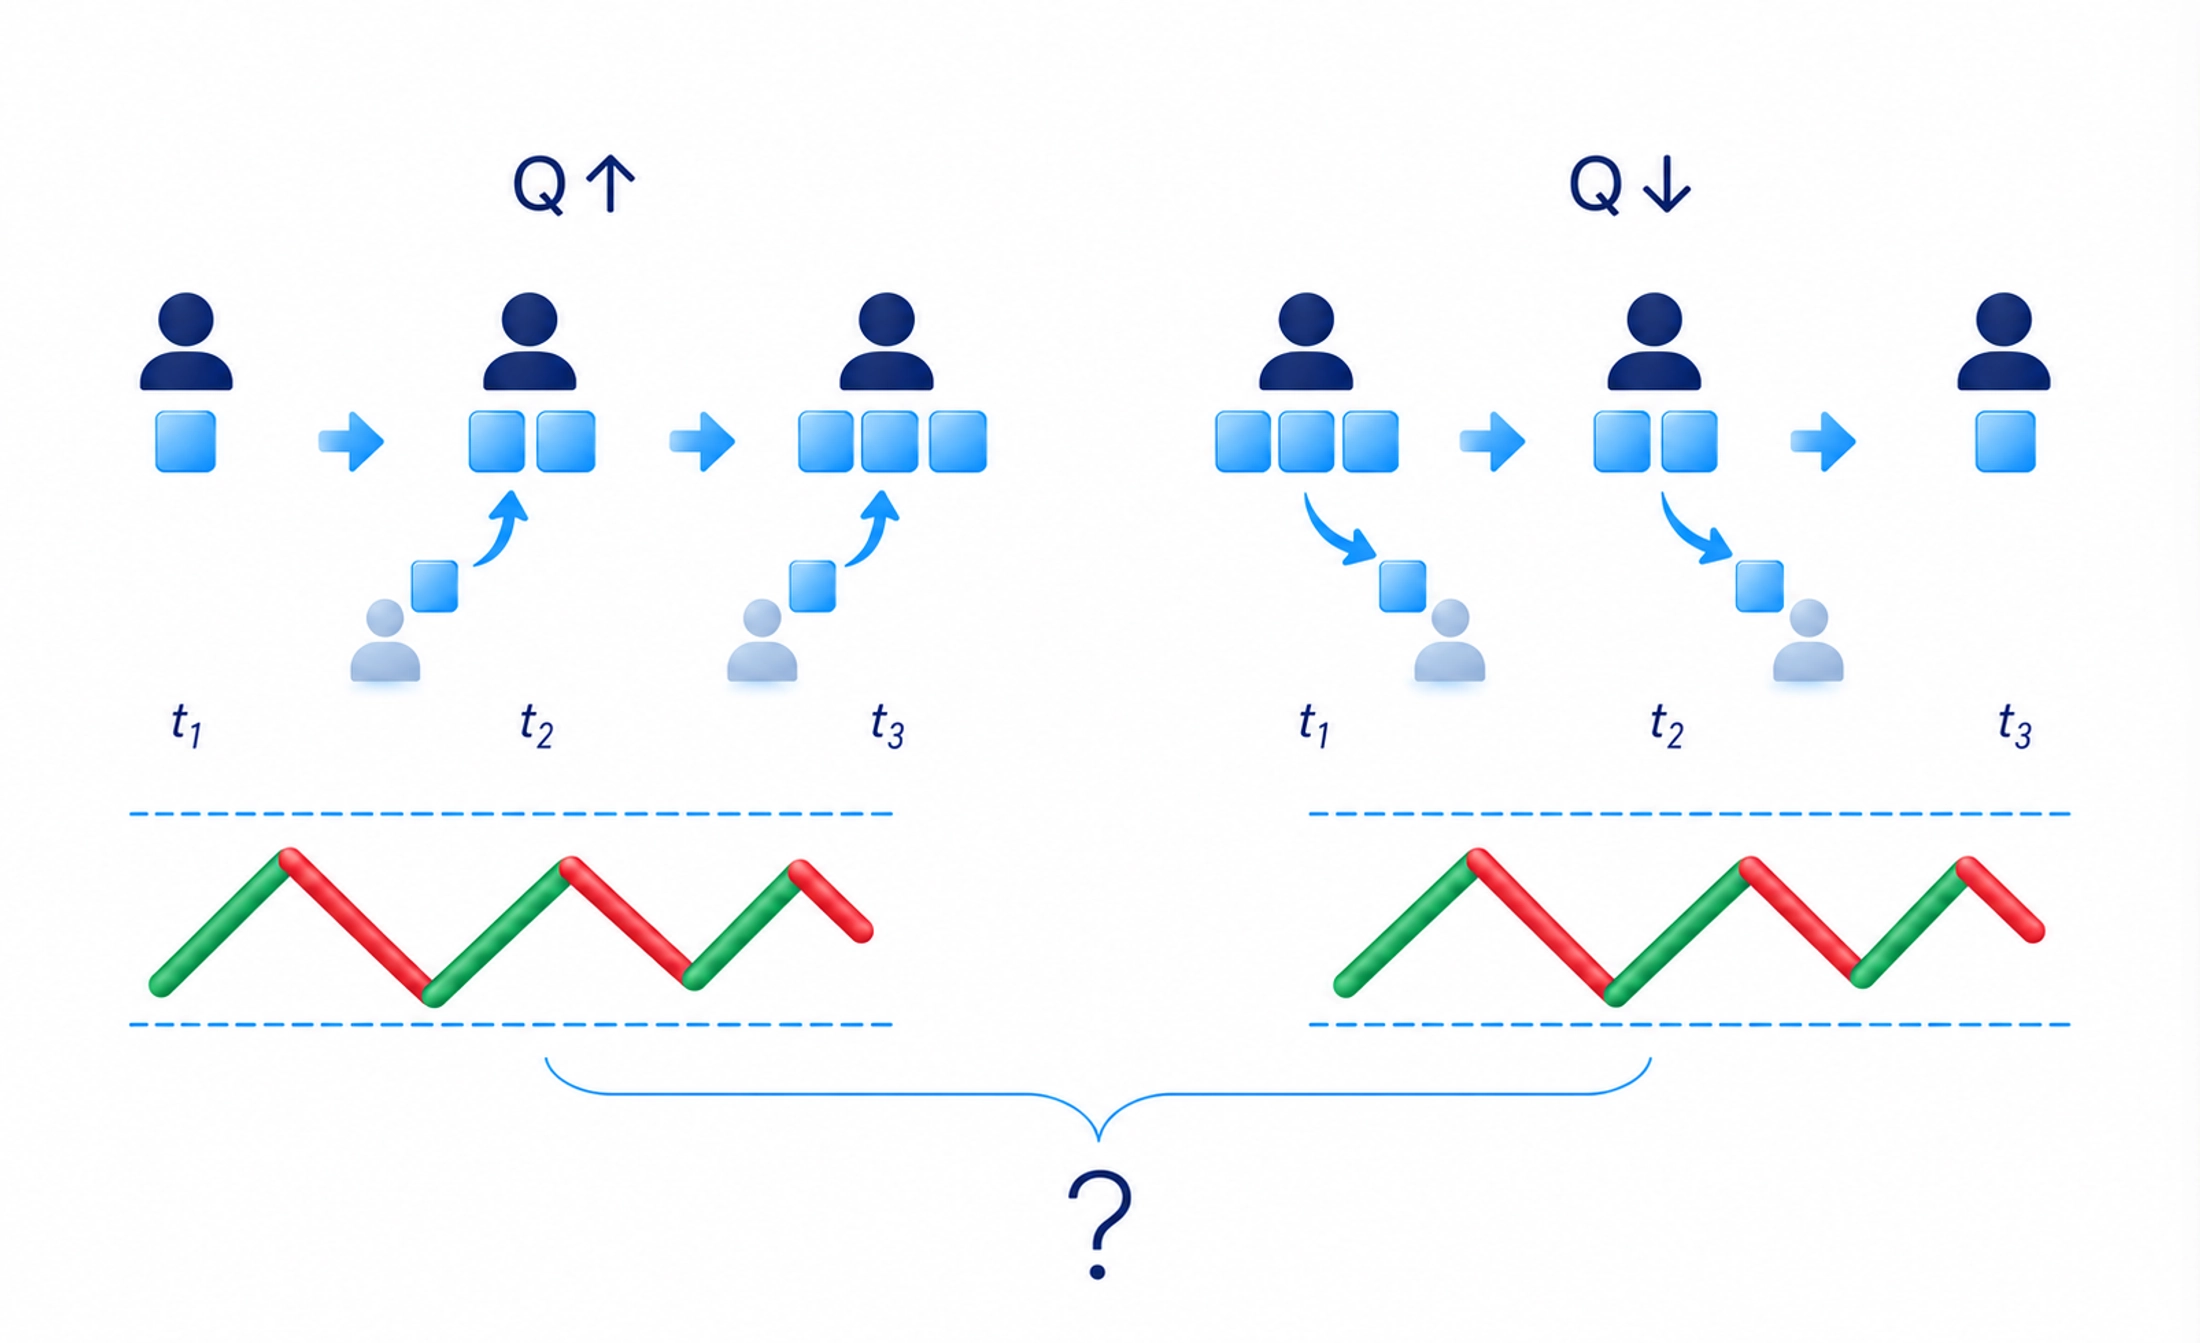
In the Wyckoff model, accumulation describes position-building, assessed through price and volume within a range. Distribution describes selling accumulated holdings to other participants. A directional move may follow, but sideways movement alone does not identify either process or establish the eventual direction.
I interpret SMC through Richard Wyckoff's connection between activity and price progress. If price leaves a range but the advance does not continue, I examine the buying activity and the following reaction. Wyckoff and SMC contain overlapping ideas; that does not make every label or rule identical. The Wyckoff-method guide explains the cycle and the development of accumulation and distribution ranges.
What liquidity means in SMC
Market liquidity means being able to trade the required quantity without a large deterioration in price. In SMC, liquidity also refers to suspected clusters of orders around highs, lows and other prominent areas. A cluster marked on a chart is an estimate, not a complete list of actual orders.
A protective stop is an instruction intended to close a position when its trigger condition is met. Above a high, there may be orders to buy a breakout and protective buy stops for sellers. Below a low, sell orders and buyers' protective sell stops may be triggered. A conventional stop that becomes a market order adds to transactions in the direction of the move. A stop-limit order works differently and may remain unfilled. The product, venue and broker determine the applicable rules.
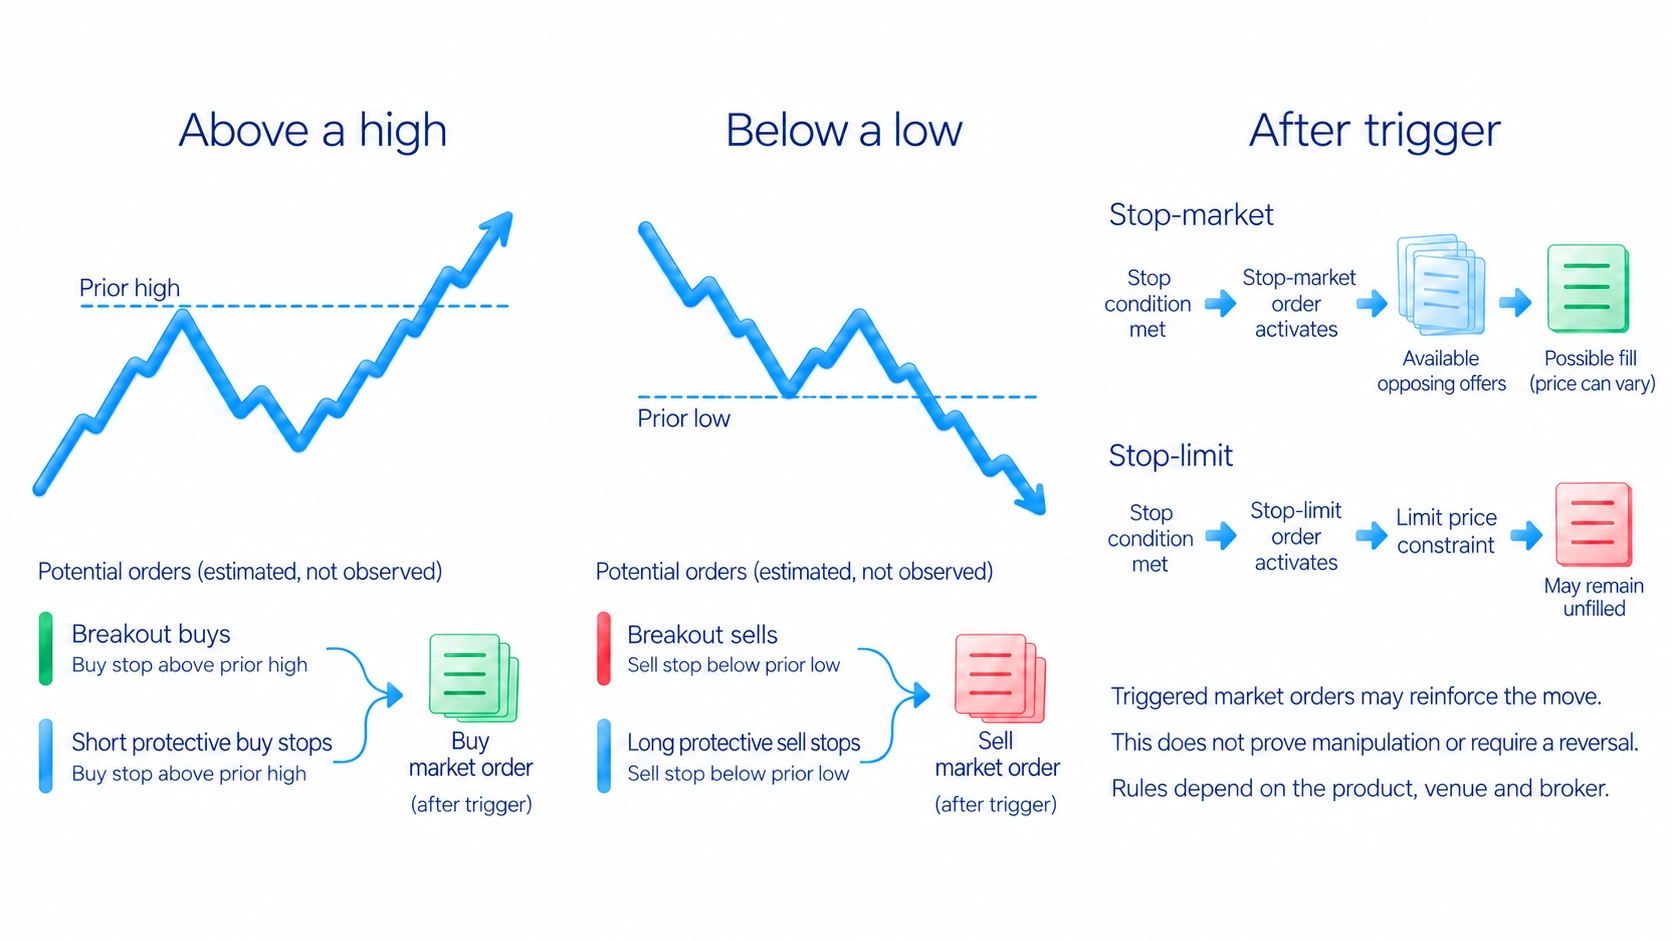
In research on currency markets, Carol Osler found evidence that clustered stop orders can contribute to rapid, self-reinforcing price moves, called price cascades. This provides a mechanism for an accelerating move through an area. It does not establish that every such move was deliberately triggered or must reverse afterwards.
A large buyer needs sellers; a large seller needs buyers. Areas of substantial activity matter to execution as well as chart analysis. The liquidity-pools guide explains where SMC traders look for possible order clusters and how to check the price response.
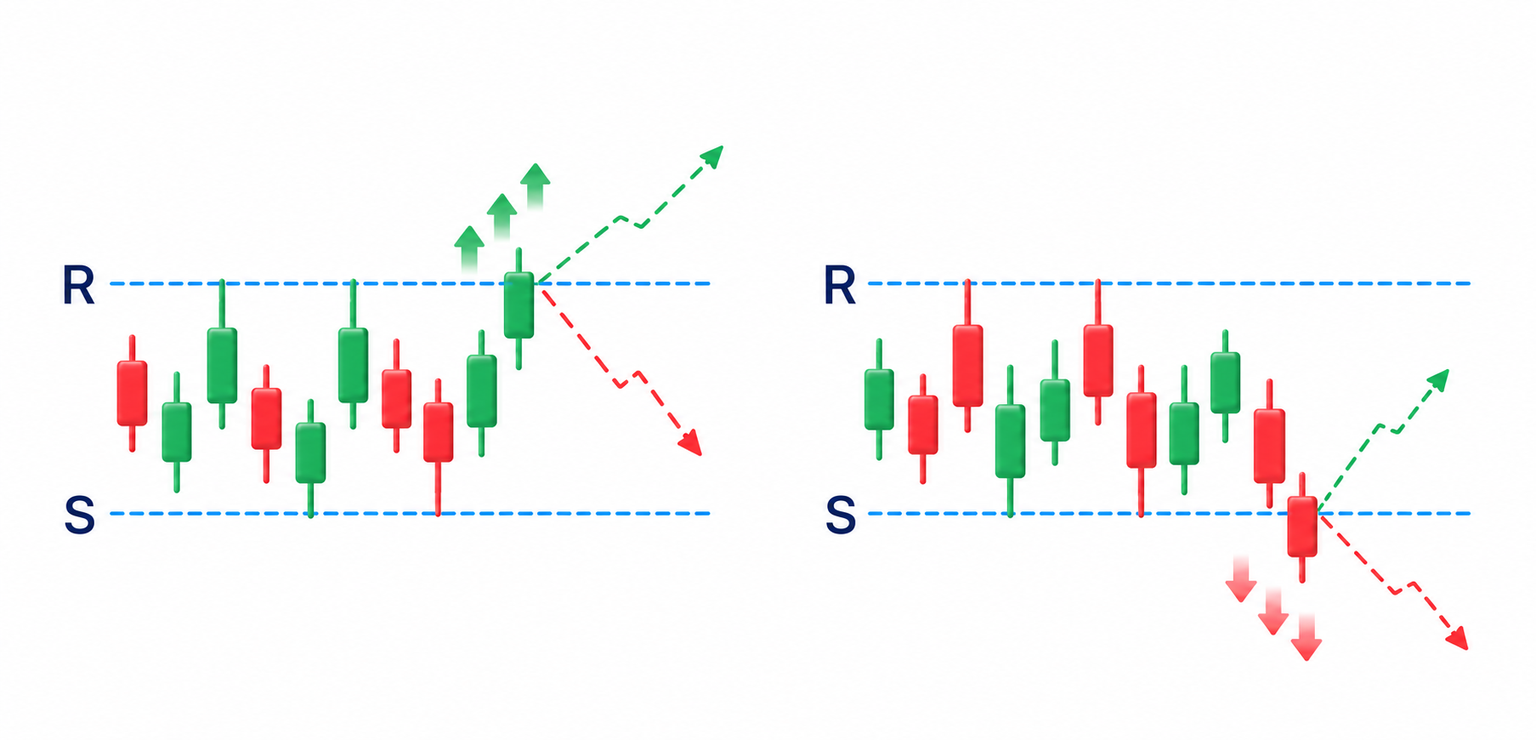
Stop hunting and false breakouts
Stop hunting describes an interpretation that price was deliberately moved towards a cluster of protective orders. On a normal chart, the move is visible but its cause is not. News, incoming market orders, limited available quantity or a large participant's actions can all contribute. A brief move through a level does not establish deliberate targeting.
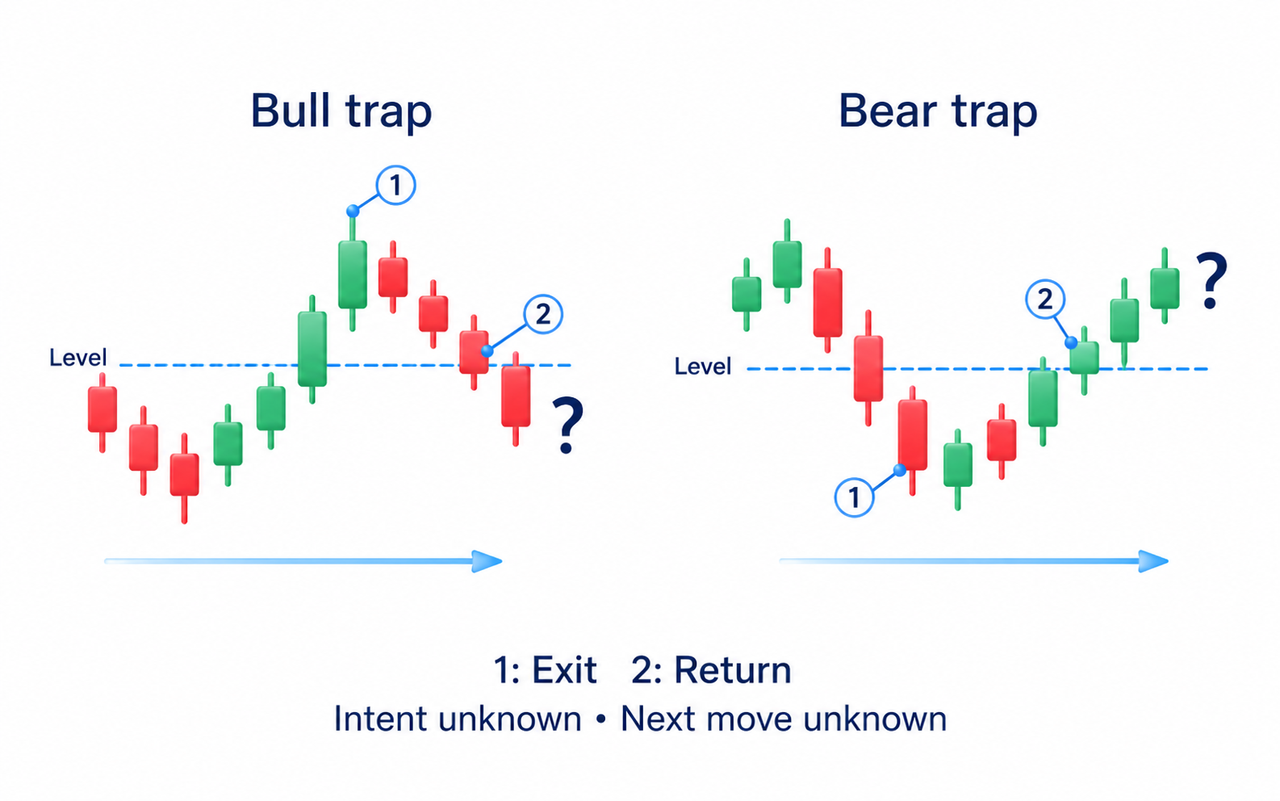
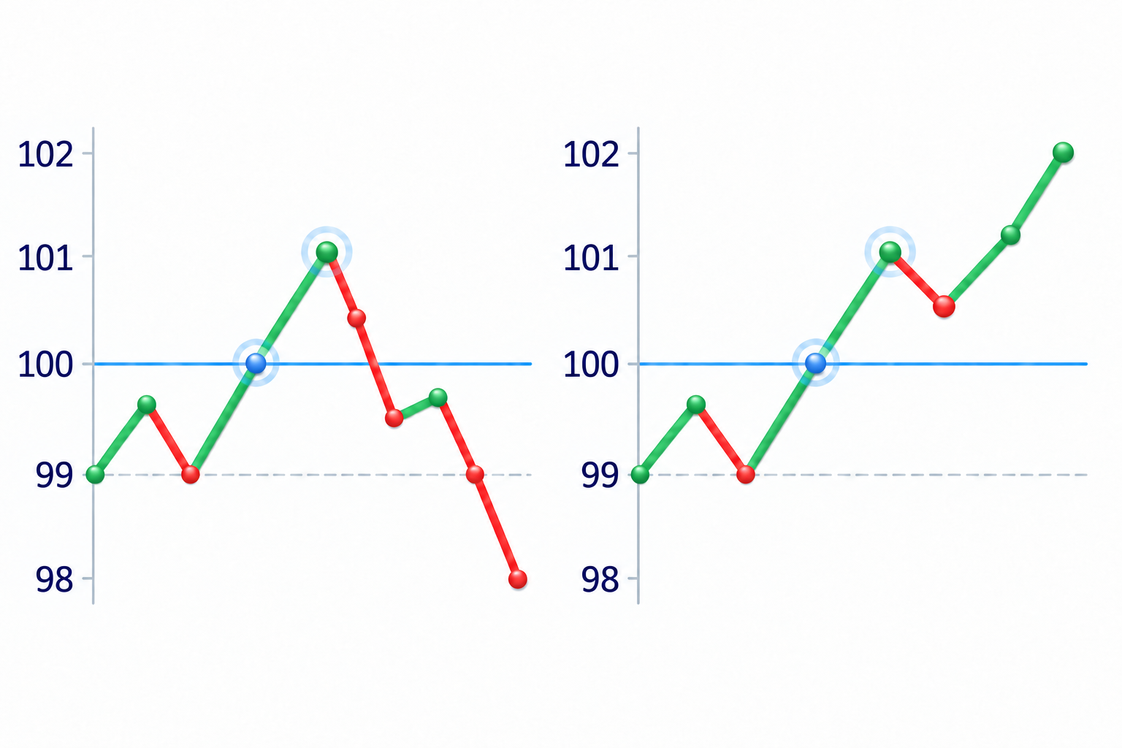
A false breakout occurs when price moves beyond a chosen boundary, fails to hold outside it and returns. A failed upward move is called a bull trap because it can draw in buyers; a failed downward move is called a bear trap because it can draw in sellers. At the moment of the initial breakout, the later result is unknown. Check the return and subsequent movement before calling it false.
In my analysis, a liquidity-grab idea needs that reaction. I examine movement after the return, trading activity near the area and changes in local highs or lows, not just a candle's long tail. High volume can occur in both a sustained breakout and a reversal. A simple rule that low volume always means a false breakout is not sufficient.
Illegal manipulation is a separate question. Spoofing involves orders intended to create a misleading impression of supply or demand rather than be executed. Assessing it requires information about orders and conduct, not just a price pattern. A false breakout is not proof of spoofing, and an iceberg order is not automatically illegal.
Order blocks, FVG, BOS and CHoCH
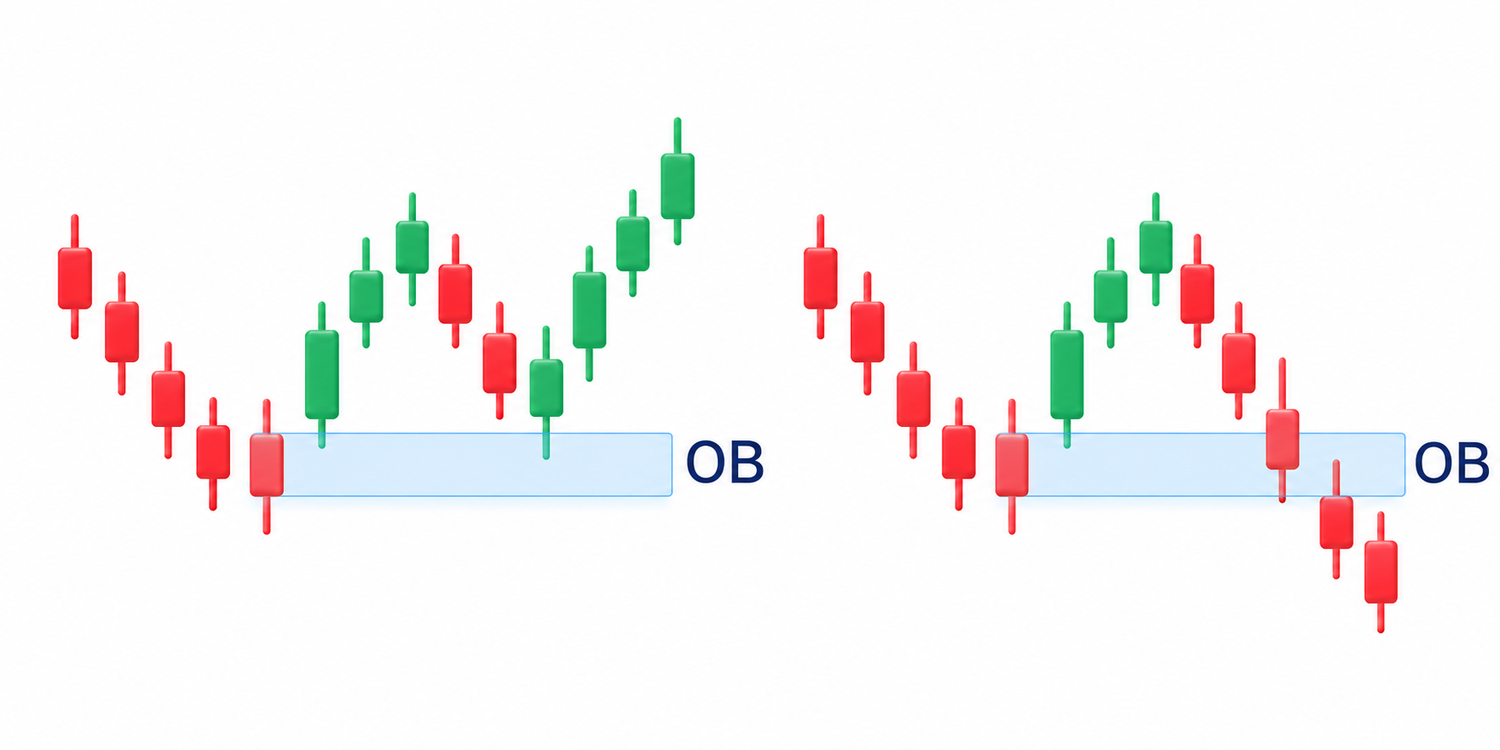
An order block, in a common SMC marking convention, is the area of the last opposite-direction candle before a strong move. Before an advance, for example, traders may mark the last falling candle. Different conventions choose its boundaries differently, so fix the rule before marking it. The area is not a record of confirmed bank orders. The order-block guide explains how to define and test such an area.
Imbalance means an uneven balance, but SMC traders often use the term for a Fair Value Gap, or FVG. This marks a non-overlapping area between the first and third candles in a three-candle move. Transactions may have occurred there during the middle candle, so the shape does not prove an empty market or outstanding institutional orders. Price may revisit it, but need not. The imbalance-and-FVG guide explains the distinction and the marking rules.
A break of structure, or BOS, usually means price passes a selected previous high or low in the direction of the existing move. A change of character, or CHoCH, describes a break against that sequence. Before applying the labels, specify which highs and lows count and whether a candle must close beyond the boundary. Otherwise, different marking rules can give the same chart different labels.
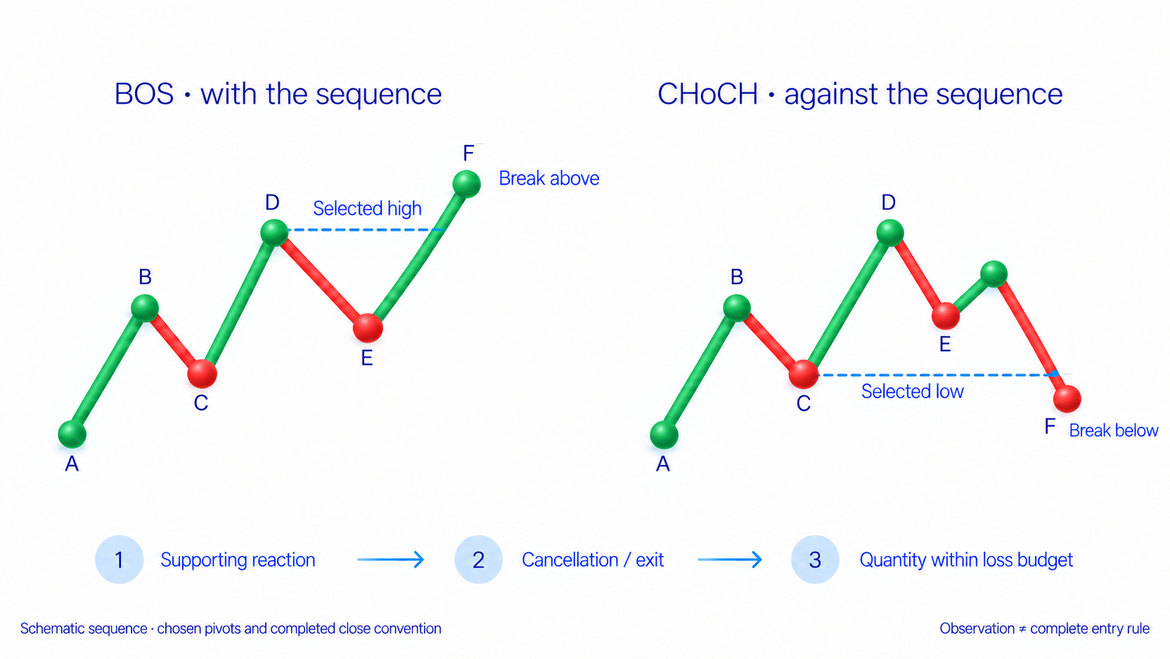
These names describe price observations, not complete entry conditions. An order block may fail, an FVG may remain unfilled, and a CHoCH may be followed by renewed movement in the original direction. State in advance which reaction supports the scenario and which would cancel it.
Why add trading volume?
Trading volume records the quantity exchanged during a period, such as futures contracts. It helps compare activity with the result: how far did price move with substantial trading, and did it keep the position it reached? In my system, that check comes before an entry rather than being added to explain an already known reversal.
Heavy volume with little further progress is consistent with opposing orders limiting the move, but does not identify the buyer or seller. Every completed transaction has both sides. A rising candle does not prove that its entire volume belonged to one fund, and public order feeds can remain anonymous.
Compare the same instrument, venue and time interval. CME futures volume belongs to that contract, not all transactions in its underlying asset. Currency quote updates do not equal the quantity traded across global Forex markets. The volume-analysis guide explains data sources and how to compare activity with price.
How to check an entry scenario
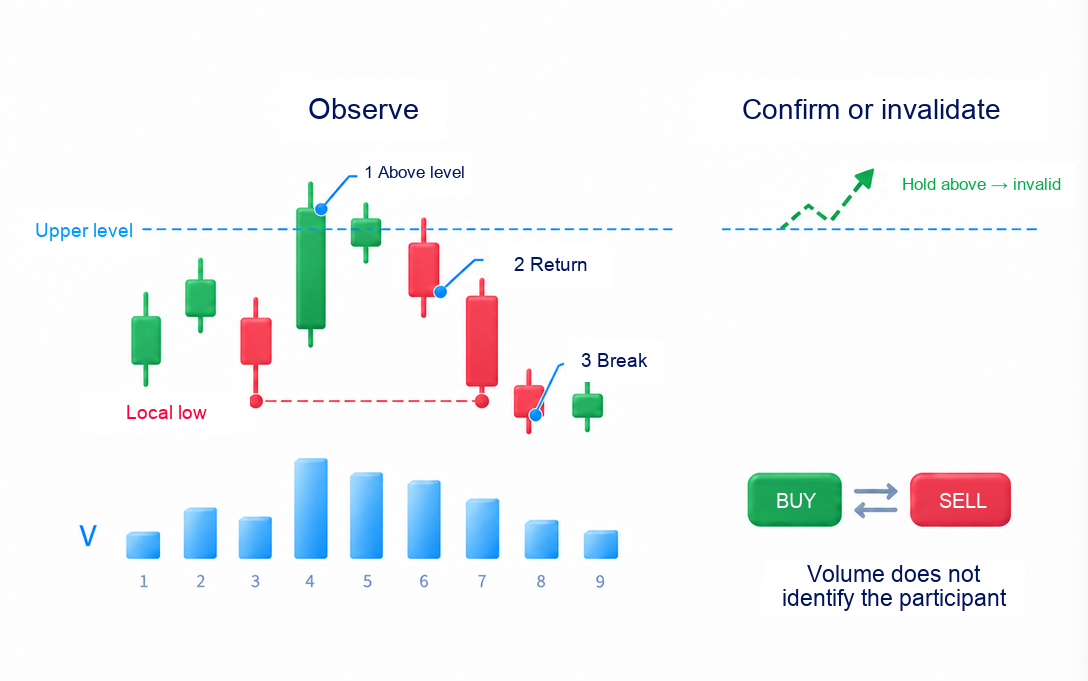
In the course's working-with-levels example, I examine an upward move with active buying. The following rising bars become narrower, then a strong decline breaks local support areas. The learning task is to connect substantial activity, a lack of further progress and the subsequent change in movement. Buying from the first prominent bar alone misses that sequence.
My video on large-capital activity explains how I interpret the relationship between price, volume and position-building. It is an optional practical addition. The interpretation helps form a hypothesis; a trade still requires observable conditions rather than certainty that a particular large buyer is present.
Consider a hypothetical scenario in which the upper boundary of a range was marked before the next move. Price passes it with increased activity but fails to remain above it. After returning inside, the next decline breaks the nearest local low. This supports a failed-upward-break scenario. If price instead regains and holds above the boundary, the reason for a sale needs reassessment. No numerical return is implied by this example.
Before entering, define what would make the idea wrong and where the price structure provides a possible exit. A stop beyond the failed breakout's extreme is not protection against every later move or a guarantee of the execution price. If the required distance is too large, reduce the position or skip the trade rather than enlarge the allowed loss to accommodate an attractive zone. The risk-management guide explains position sizing.
For practice, mark areas before revealing the next candles. Record what you expected, which confirmation appeared and which movement cancelled the idea. Keep failed areas as well as successful returns. Moving a zone after seeing the outcome does not show whether the decision could have been made at the time.
Frequently asked questions
Smart Money refers to large professional participants and their capital. SMC interprets possible activity through price, but a marked area does not reveal a participant's identity or mean that larger traders always win.
They can differ in capital, infrastructure and objectives. Banks, funds and market makers may take opposing positions. They should not be treated as one side that always knows the future.
It is an interpretation that price moved deliberately towards suspected protective exit orders. A chart shows the move, not the participant's intent. Triggered stops can reinforce movement without an inevitable reversal.
Check whether price holds beyond the area and what happens next. A return inside indicates that the exit has failed under that definition. A brief excursion or a volume figure alone is not a guaranteed trading signal.
Compare activity with price progress and the reaction near an area. High volume records trading, but does not prove who carried it out or why. A later reaction helps test the interpretation.
Do not enter from a marked zone or a brief move through a level alone. Set the required confirmation, cancellation condition, trade quantity and exit beforehand. A more distant protective exit is not inherently safer; the position must fit the chosen loss budget.
About the author
Igor Arapov, practising trader since 2013 and author of the ArapovTrade library. ORCID: 0009-0003-0430-778X.




