Imbalance describes an uneven balance, while a Fair Value Gap, or FVG, is a particular area marked from three candles. Traders using Smart Money Concepts (SMC) mark it after a directional move and watch what happens if price returns. The useful task is to set the boundaries correctly and test the reaction, not assume that the market must fill the area.
An FVG rectangle describes the positions of candle ranges. It is not a list of orders somebody is obliged to execute later. Before using it for a trade, separate the chart construction, the later price response and the actual order you would submit.
How imbalance differs from an FVG
Imbalance has several meanings in trading. In order data, it can describe unmatched buying or selling quantity at a specified price. For example, an exchange auction reports shares that cannot be paired with opposite orders at its reference price. That measures eligible orders under the venue's rules, not a three-candle pattern.
In Smart Money Concepts, or SMC, imbalance often describes an area of rapid directional movement. An FVG is one marking convention: the first and third candle ranges do not overlap, with a directional second candle between them. Order imbalance can exist without this shape, and the shape does not measure the exact difference between buying and selling orders.
Buying can move price higher when too little selling quantity is available at earlier prices or sellers withdraw their offers to sell. Selling can similarly reach lower prices offered by buyers. Different combinations of transactions and changed orders can produce the same candle arrangement. The market-microstructure guide explains available quantity and execution.
Fair Value Gap does not mean that somebody has calculated the instrument's fair economic value. It is the name of a chart model. Trades may have occurred inside the marked area during the middle candle, so gap does not establish that no trading took place there.
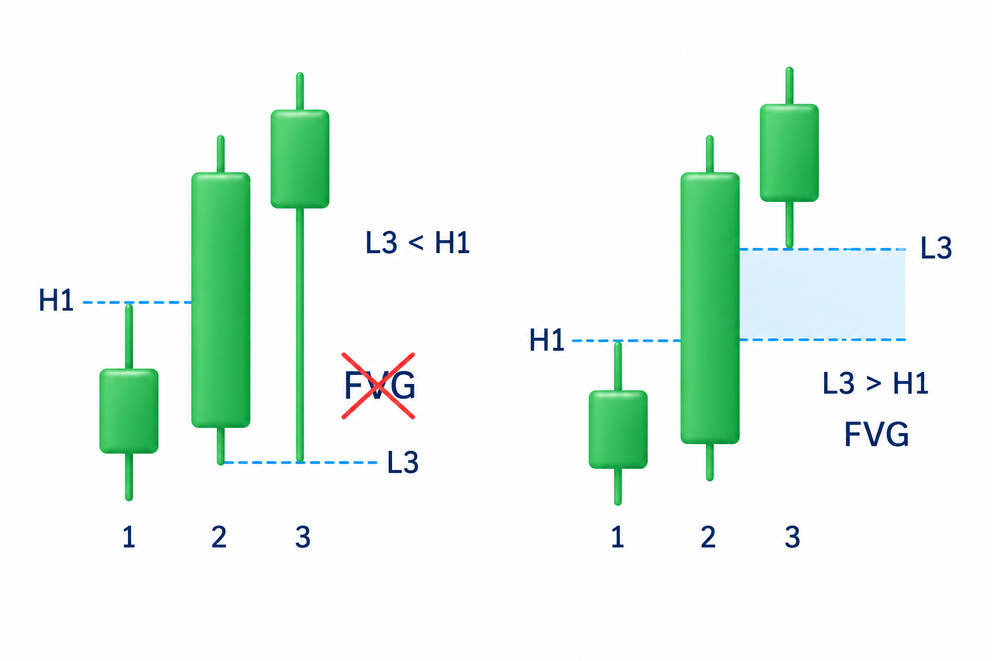
Price need not revisit an FVG or cross its entire width. The model describes a candle arrangement that has already occurred; it does not create an obligation to trade back through the area. Marking it is therefore not an instruction to buy or sell.
How to find bullish and bearish FVGs
Use three neighbouring completed candles, numbered from left to right. A candle's high is its highest price and its low is its lowest. Include the shadows beyond the body between opening and closing prices, not just that body. The chart-reading guide explains these price fields and chart settings.
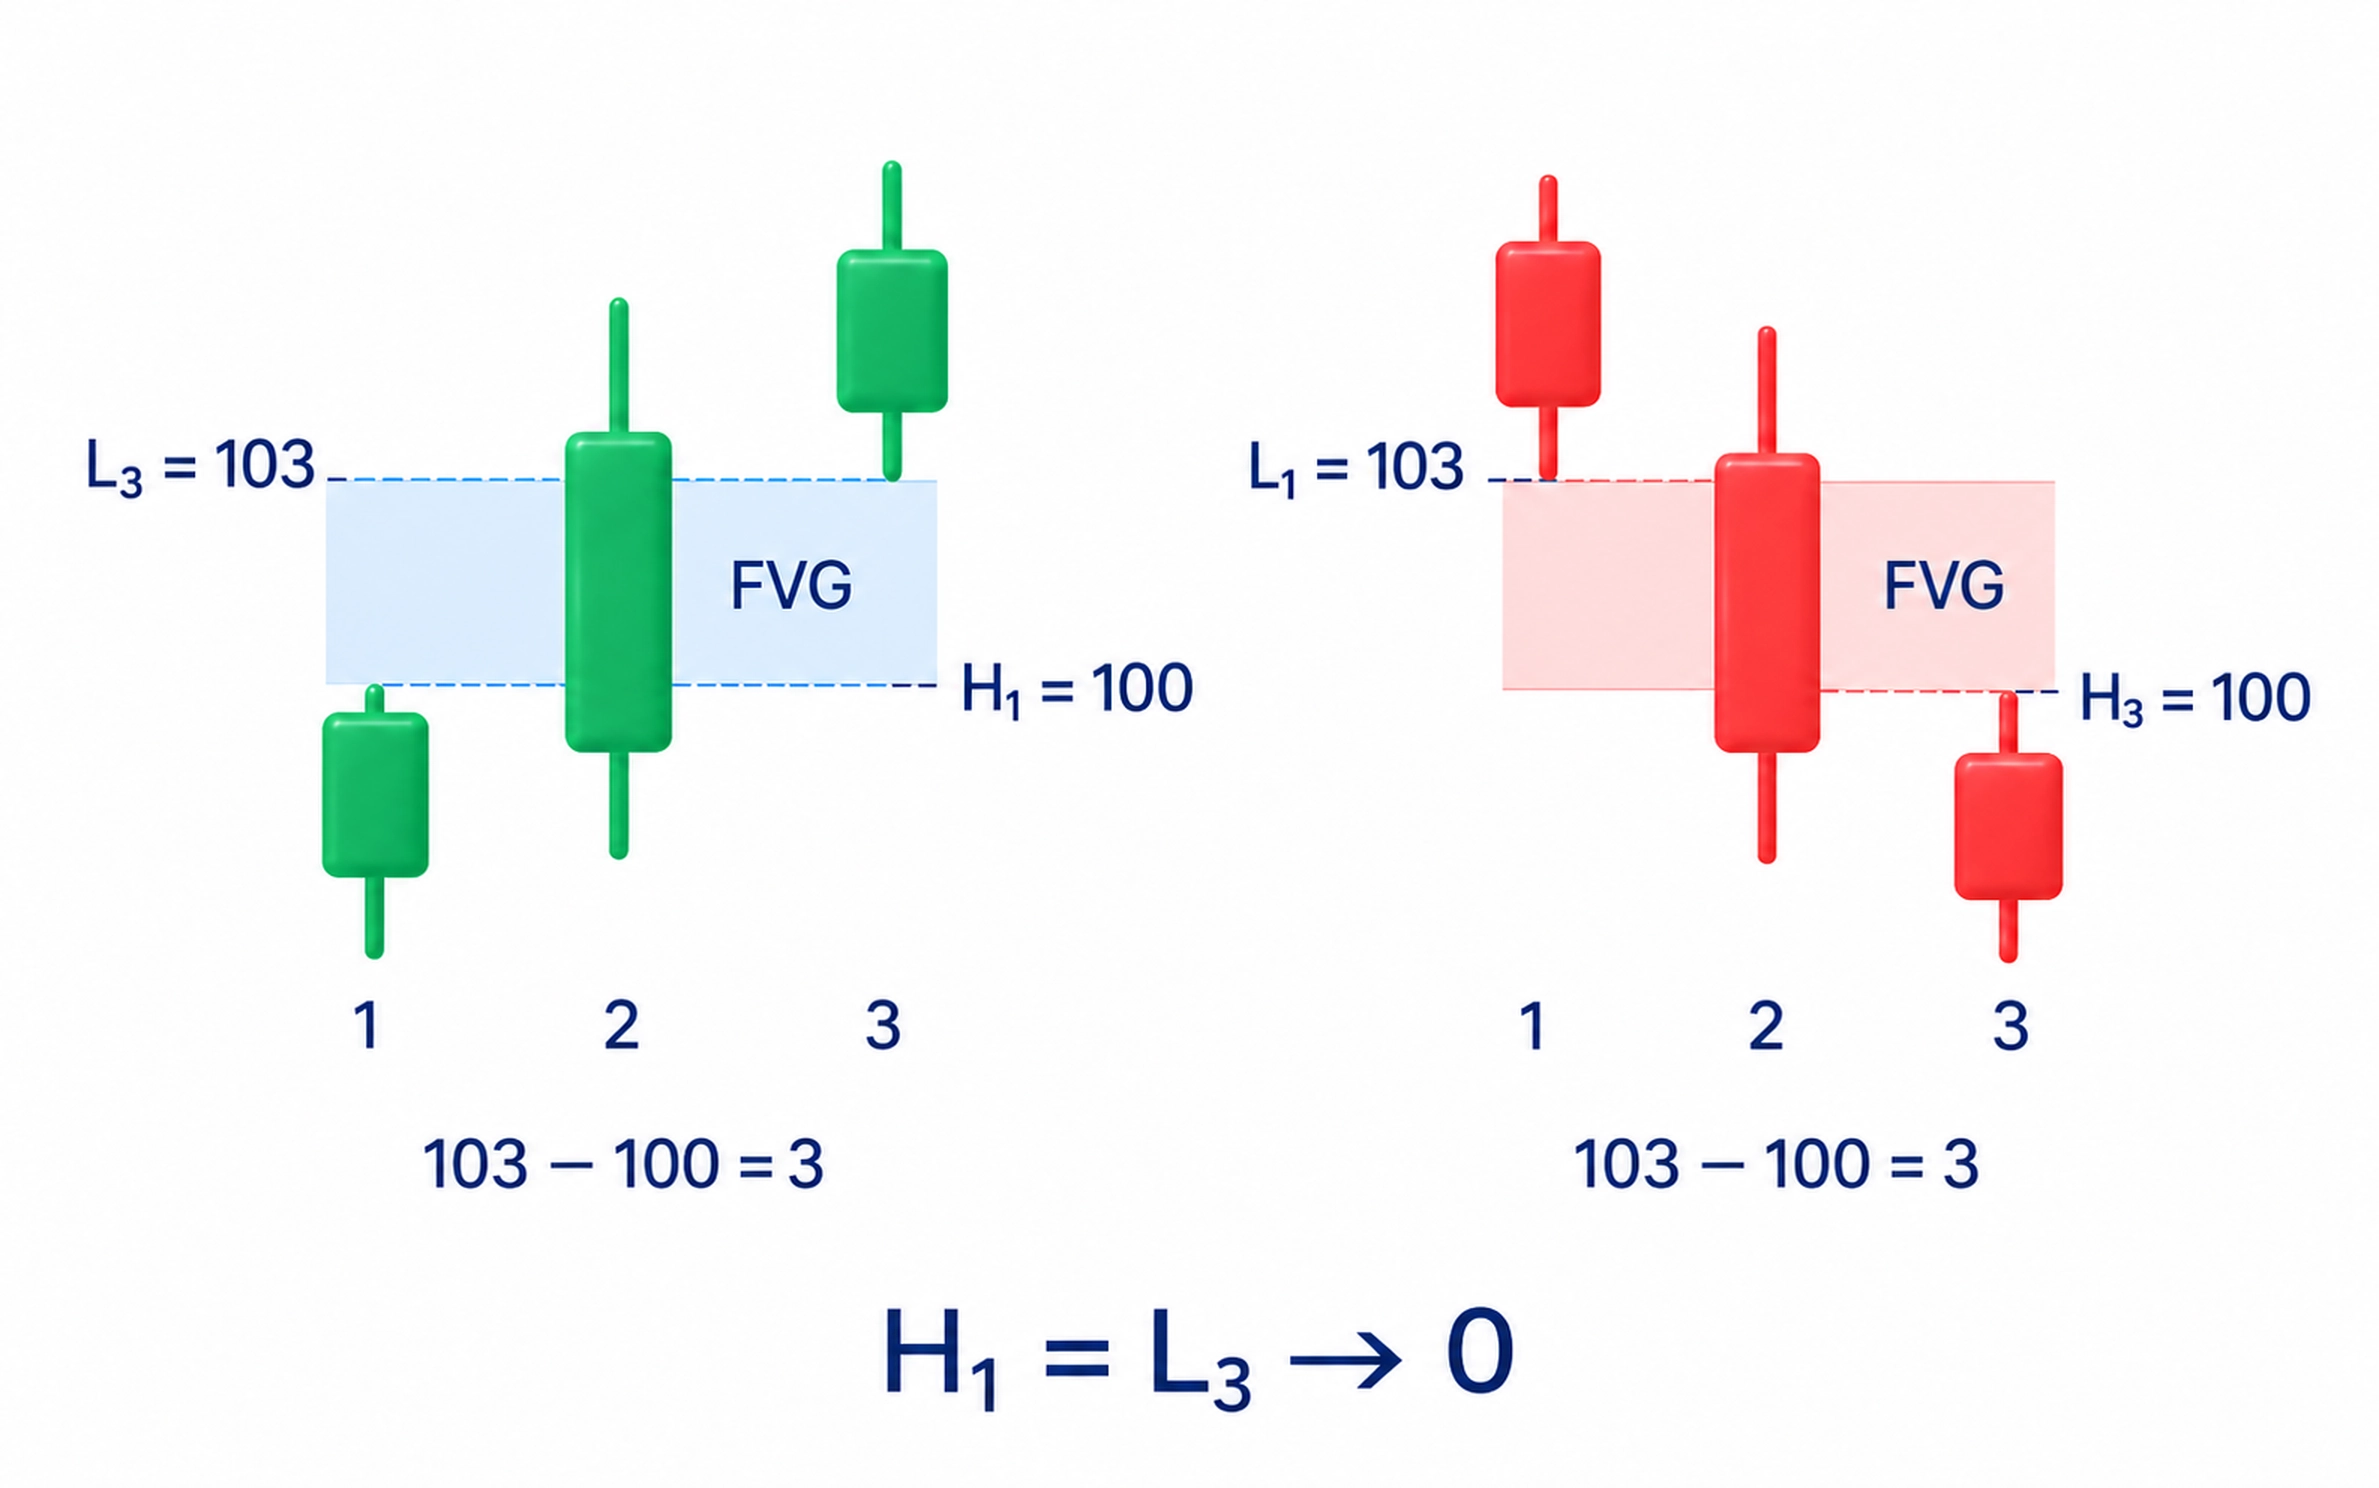
A bullish FVG exists when the third candle's low is above the first candle's high. The first high is the lower boundary and the third low is the upper boundary. If those prices are equal, there is no positive-width area between them.
A bearish FVG exists when the third candle's high is below the first candle's low. The third high is the lower boundary and the first low is the upper boundary. Check those prices directly; one candle's colour does not establish the pattern.
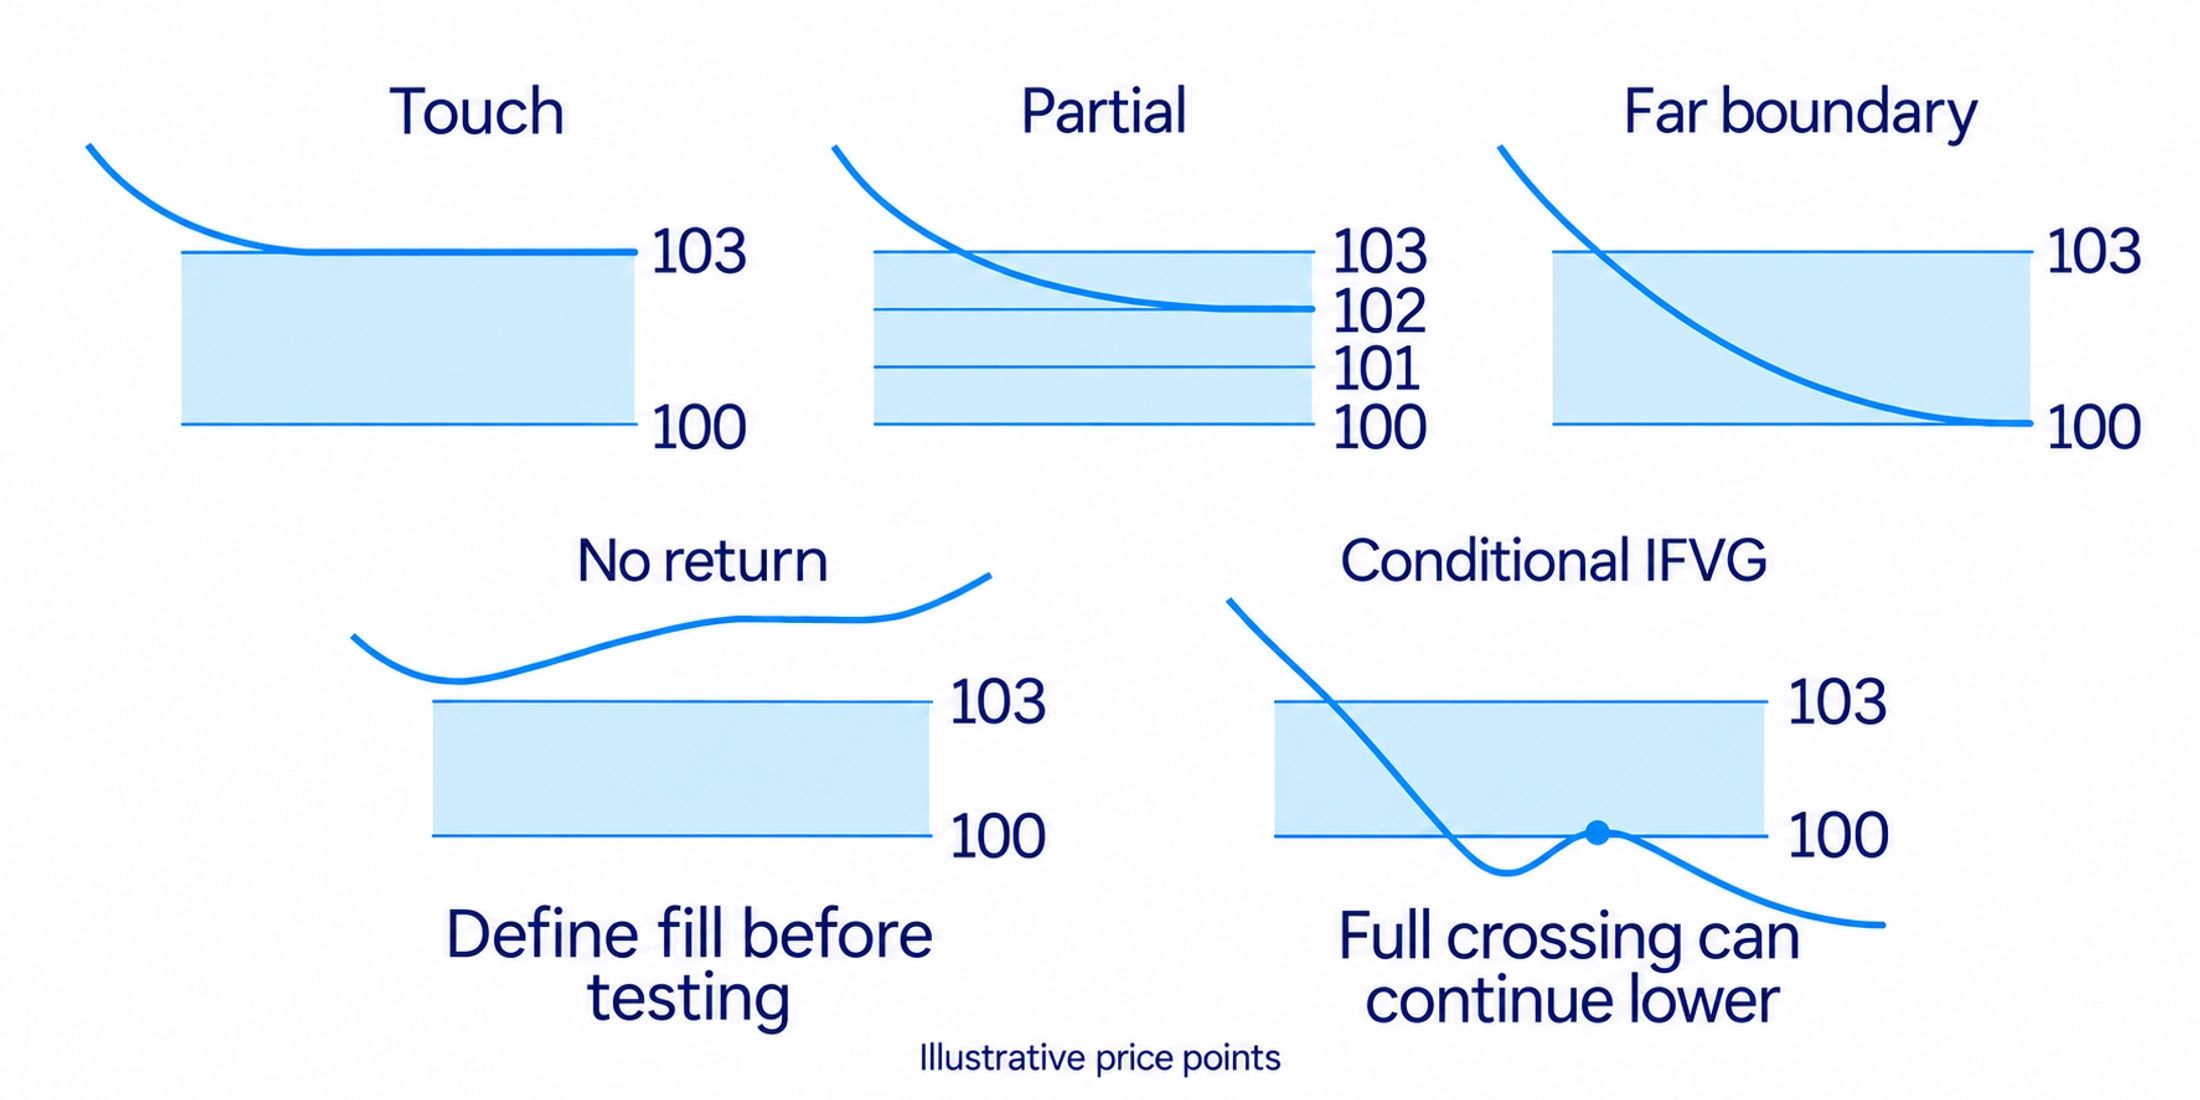
Consider a hypothetical example with prices expressed in arbitrary price points. The first candle's high is 100 and the third candle's low is 103. The bullish area has a width of 103 minus 100, or 3 points. A later decline to 102 enters the area but has not crossed it to the lower boundary at 100. This calculation establishes geometry, not a trade's profitability.
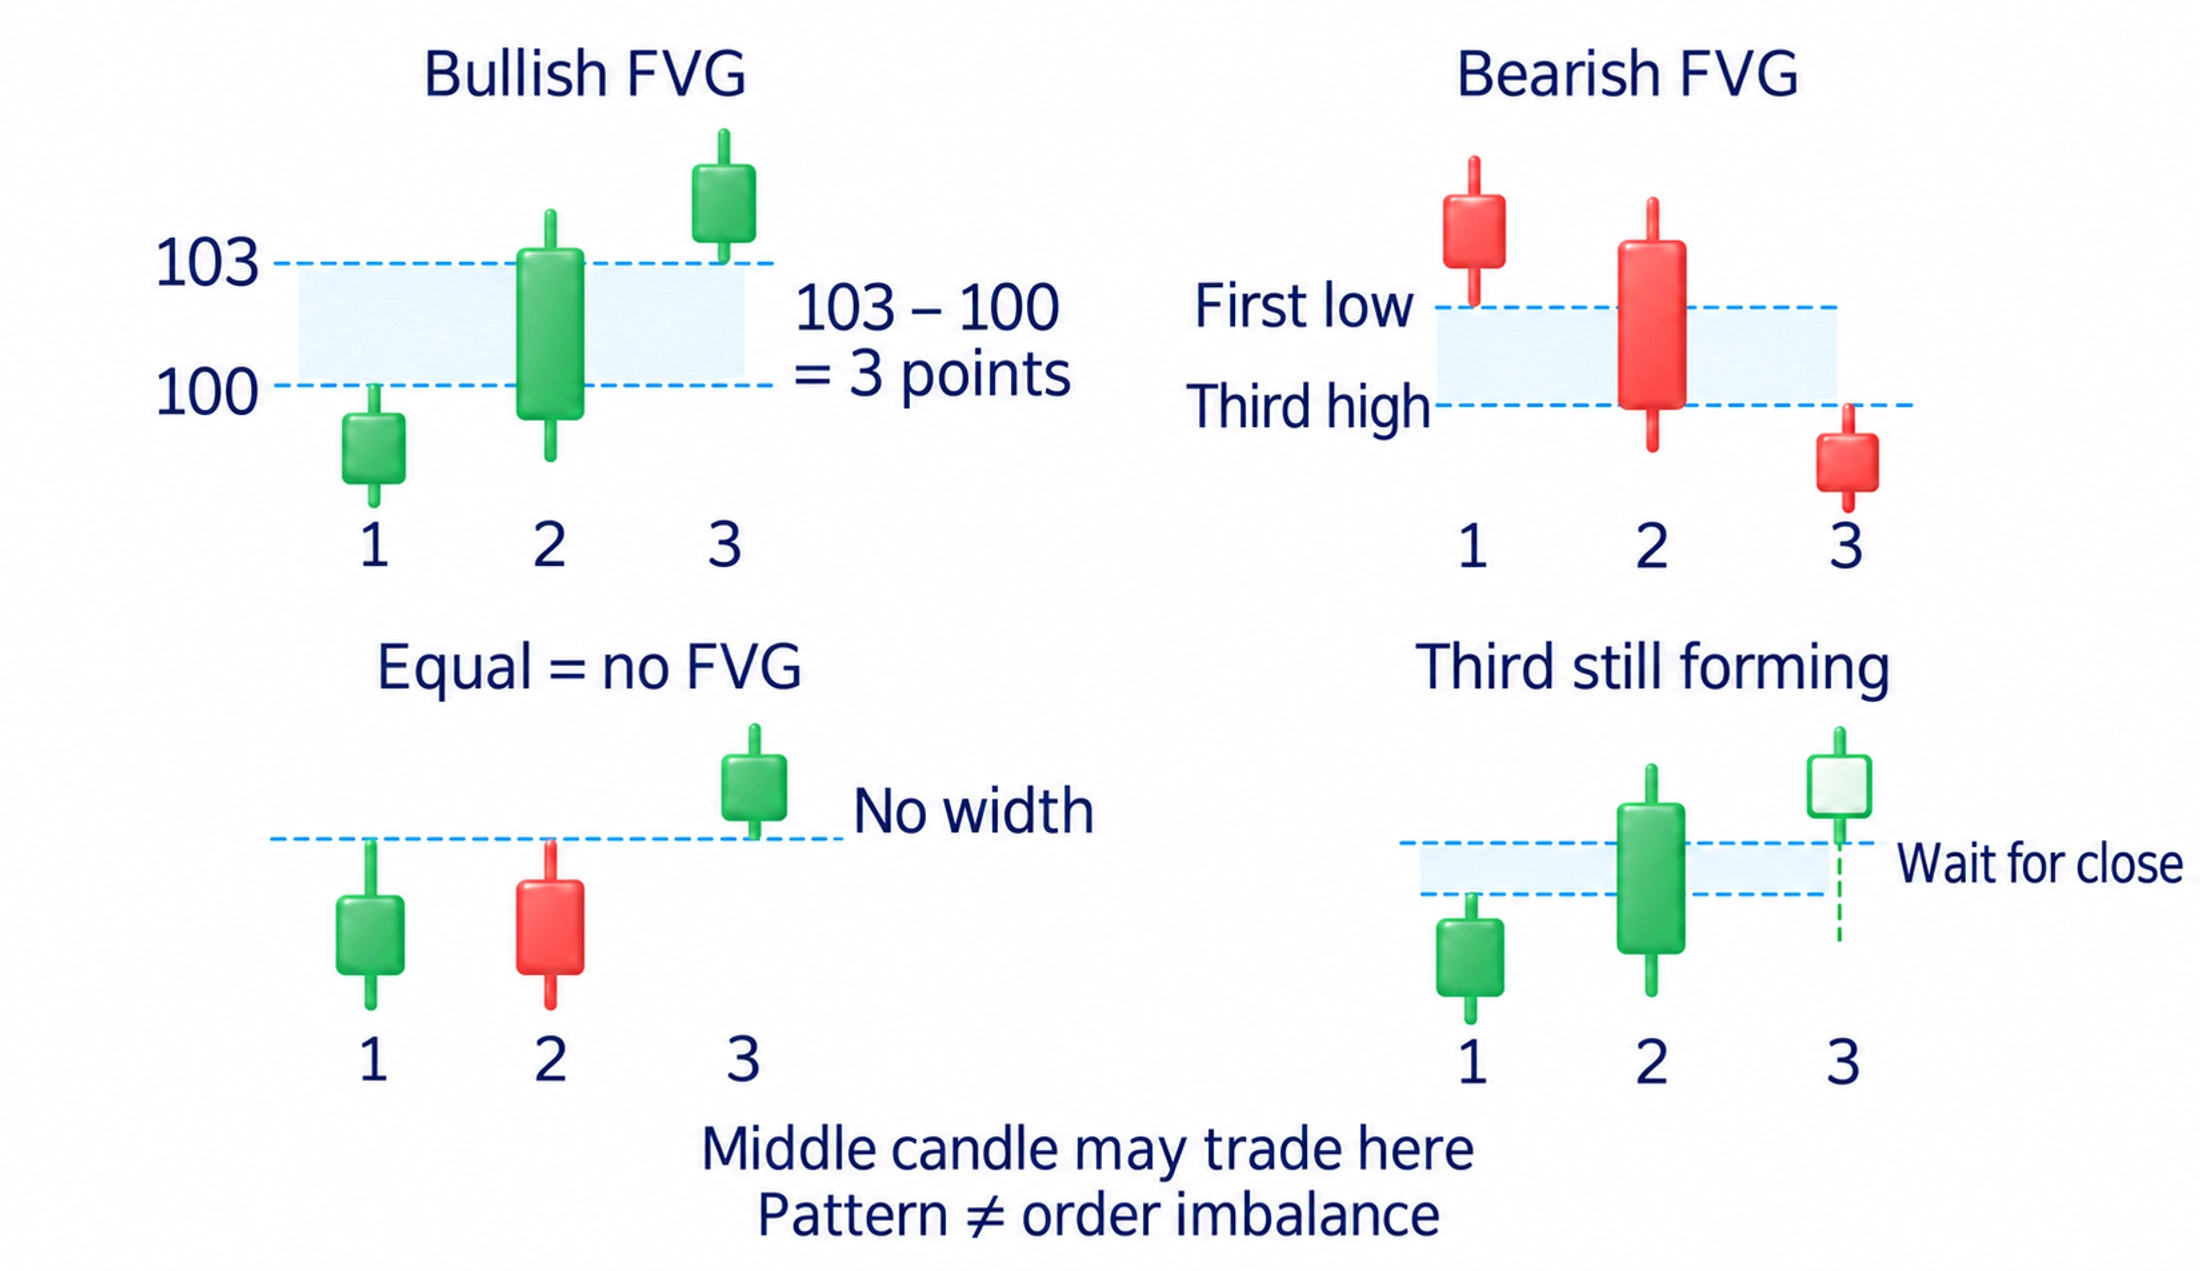
Confirm the pattern after the third candle closes. While it is forming, its high or low can change and remove the apparent non-overlap. An indicator's temporary rectangle is not necessarily a completed FVG.
Use ordinary candles for the selected instrument and data source. Heikin Ashi candles use calculated prices, so their boundaries are not automatically prices available for execution. Changing the candle period, included trading hours or quote feed can also change the shape. Save these settings with the marking so the test uses the same data.
Returns and FVG fills
A return means that later price movement reaches the marked area. Touching the nearest boundary, entering part of the area and reaching its far boundary are different events. Decide which you call a fill before testing. Otherwise, the same chart can be counted differently after the outcome is known.
Some methods use the midpoint as a place to watch. That is a chosen condition, not a price at which the market must reverse. Even a full crossing of a bullish FVG does not establish a successful next purchase: price can continue below the lower boundary.
The area can remain unvisited while new orders or news support further movement. A rectangle does not prove that institutional orders are waiting inside it. Even an order that once existed could be changed or cancelled. Neither the name nor the old price pattern guarantees later trading interest.
If price crosses the area and later reacts to it from the opposite side, some methods mark an inverse FVG, or IFVG. This describes a possible change of role. Define the test beforehand, such as a close beyond the far boundary followed by a reaction from the other side. Crossing alone does not establish future support or resistance.
An ordinary price gap between two neighbouring candles is a different construction. The three-candle FVG compares the first and third, while the middle candle may have traded through the area. Do not import the explanation that no transactions occurred merely because both constructions use the word gap.
How to check an area before entry
First assess the directional move's location. Did it leave a sideways range, continue an existing move or stop near a previous boundary? The same FVG shape can appear in different situations. Its geometry alone does not tell you whether the next move will continue or reverse.
Compare trading activity with price progress and the later response. Volume records the quantity traded during a period, such as shares or futures contracts, not the identity of a fund. Use the same instrument, data source and time interval for the comparison. The volume-analysis guide explains how to check those inputs.
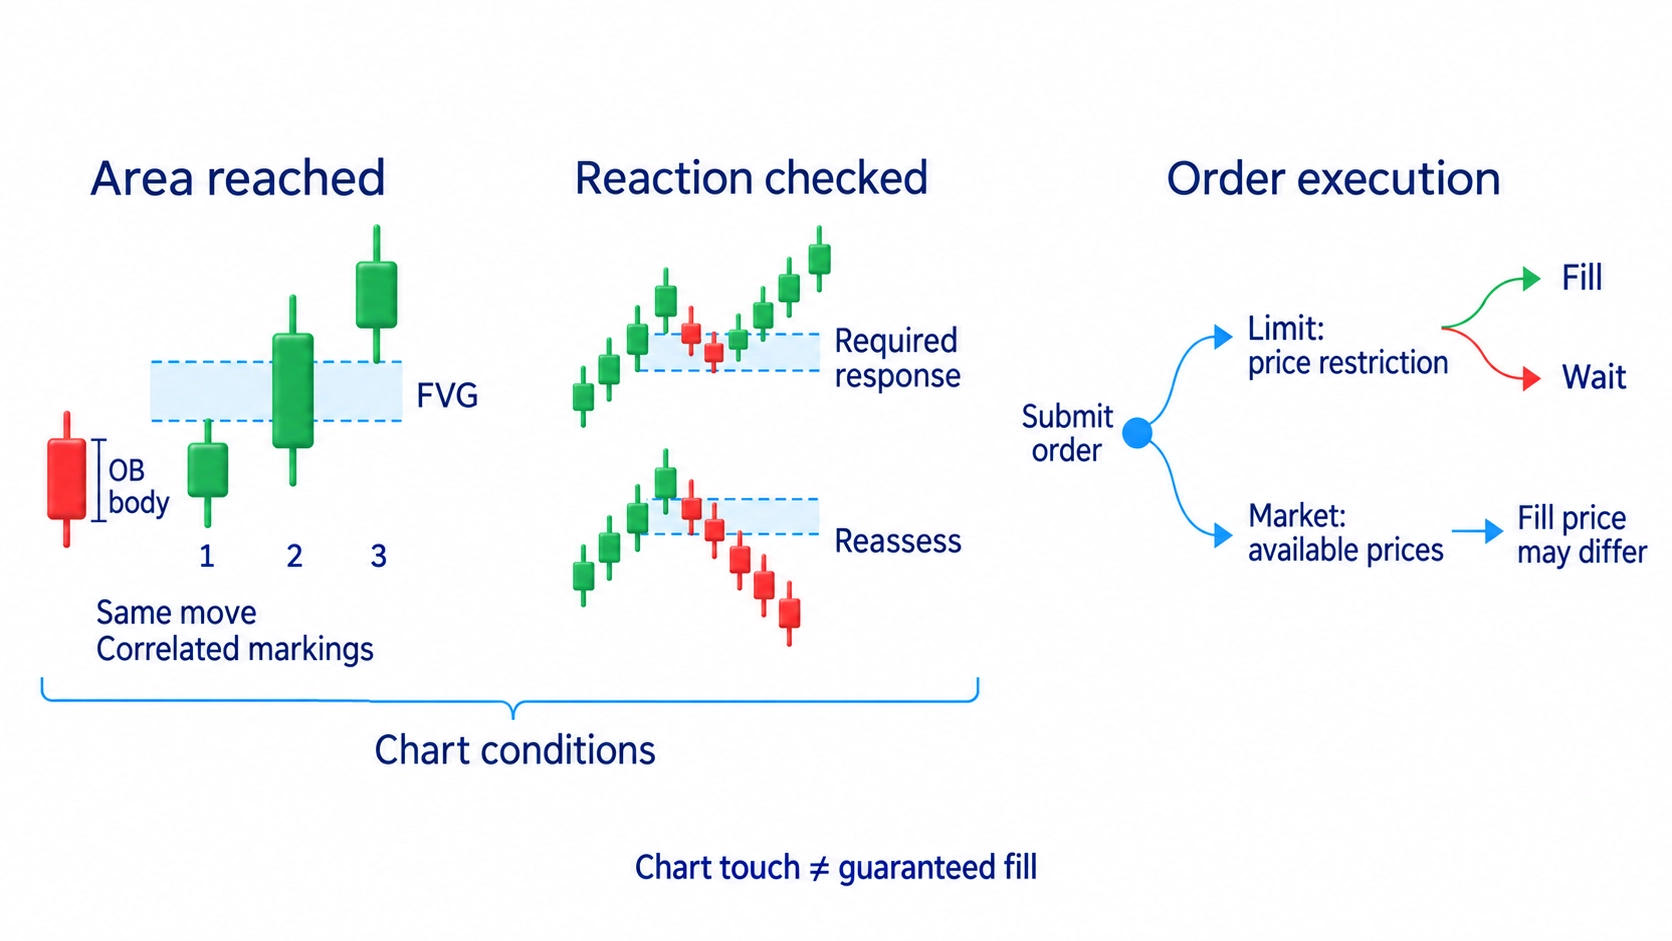
An order block is marked from the selected candle near the move's starting area; an FVG comes from the non-overlap in the three-candle sequence. They can sit nearby or overlap while describing the same move. Counting them as two independent confirmations can exaggerate the evidence. The order-block guide explains how to test the starting area.
On a return, check whether movement against the intended trade stops and movement in the intended direction resumes. A lower-volume pullback, a temporary move against the earlier advance or decline, is not an entry without that reaction. If price keeps crossing the area, reassess the expected bounce instead of moving its boundaries after the fact.
A limit order inside the area specifies a price restriction but does not guarantee a trade. A market order after confirmation can fill at a different price. The order-types guide explains these execution choices. Record reaching the chart area separately from actually receiving a fill.
Choose the cancellation condition from the movement that would contradict the scenario, not just the convenient width of the rectangle. An FVG's far boundary is not a universal stop location. A protective stop is an instruction intended to close a position when its trigger condition is met; its execution price is not guaranteed. If the required distance creates excessive planned loss, reduce the quantity or skip the trade. The risk-management guide explains sizing.
How this relates to my trading system
In the course's entry-point section, I examine a return after a downward move in gold futures. Price approaches the earlier breakout area on low volume, then the decline resumes from a new local price area. I wait for the return and reaction rather than joining the first sharp candle.
The course teaches that checking sequence; it does not establish that every illustrated move forms an FVG. If a three-candle area is present, it can be used as a location marked before the return. Under my decision logic, the later response still matters more than the zone's name.
My video on ranges and directional movement gives an optional practical explanation. It helps place the initial move in context; the FVG boundaries still come from the separate three-candle rule explained here. The Smart Money guide connects these interpretations with activity and price reactions without treating a chart area as known bank orders.
For practice, hide the future candles and mark the area after the third closes. Record the direction, boundaries, fill definition, expected reaction and cancellation condition. Then reveal later movement: did price return, supply the required response or pass through without stopping? Keep unsuccessful cases so the exercise tests the rule rather than a selection of attractive finished charts.
Frequently asked questions
Imbalance describes an uneven balance, while an FVG is a specific three-candle construction. The rectangle does not measure all market orders or prove that no transactions occurred inside the area.
After three neighbouring candles close, compare the first high and third low. If the third low is higher, mark the area between them as a bullish FVG. Equal prices leave no positive-width area.
The third completed candle's high must be below the first candle's low. Mark the area between those prices. Use the full high-low ranges, including shadows, rather than just candle bodies.
No. Price can remain away, enter only part of the area or cross it completely. Define whether fill means a touch, partial entry or reaching the far boundary before counting the results.
A touch records reaching the area, not a completed entry condition. In my approach, the later response must confirm the intended movement. A continued move through the area weakens the expected bounce and requires reassessment.
No. Both markings may describe the same directional move, so they are not automatically independent evidence. Check the location, trading activity and subsequent response rather than entering from overlapping rectangles alone.
About the author
Igor Arapov, practising trader since 2013 and author of the ArapovTrade library. ORCID: 0009-0003-0430-778X.




