Average True Range, or ATR, measures the size of recent price fluctuations, including gaps between periods. It helps you compare the distance to a planned exit with recent movement. An ATR reading does not tell you to buy or sell, and it does not locate the next reversal.
What does ATR measure?
Volatility means how much price varies. ATR measures it through true ranges of bars, the individual periods on a price chart. J. Welles Wilder introduced the indicator in his 1978 book New Concepts in Technical Trading Systems. Its calculation includes distances from the previous closing price as well as the current high and low.
ATR uses the same units as the quoted price. On a share priced in US dollars, an ATR of 3 represents a calculated range of about 3 dollars. It does not mean 3%, or a 3-dollar loss for your entire position. The money result also depends on how many shares you hold.
The chart period matters. ATR on an hourly chart averages hourly true ranges; on a daily chart it averages daily ones. ATR(14) means a smoothing length of 14 bars, not necessarily 14 days. Keep that interval visible when using the number in an exit rule.
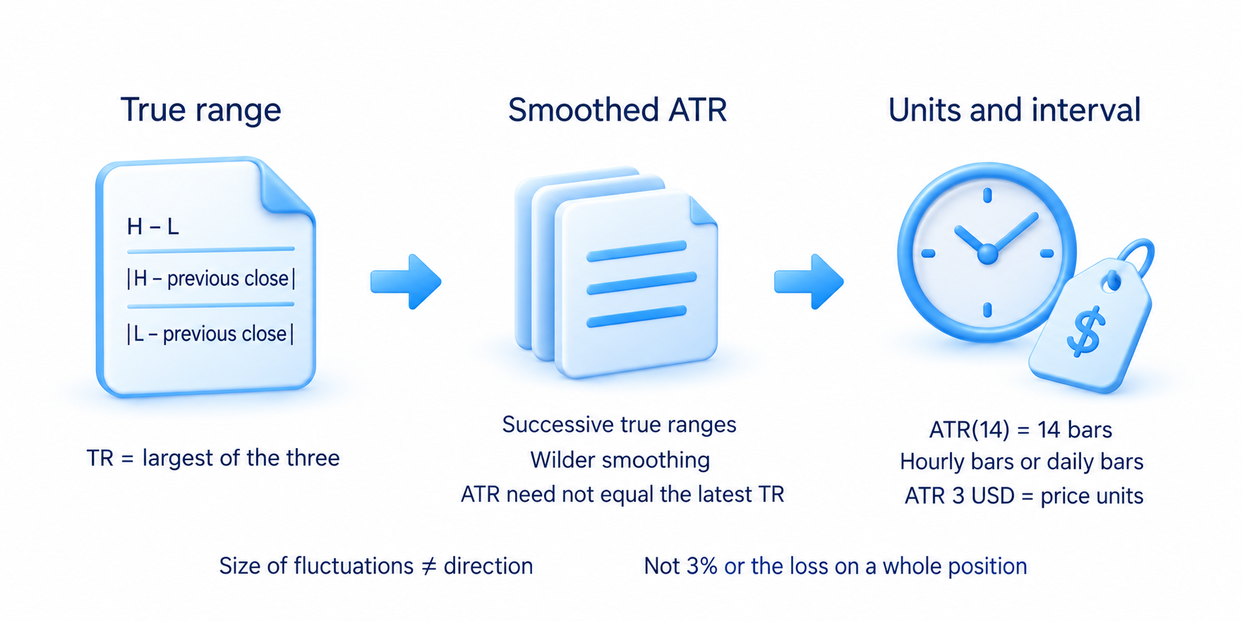
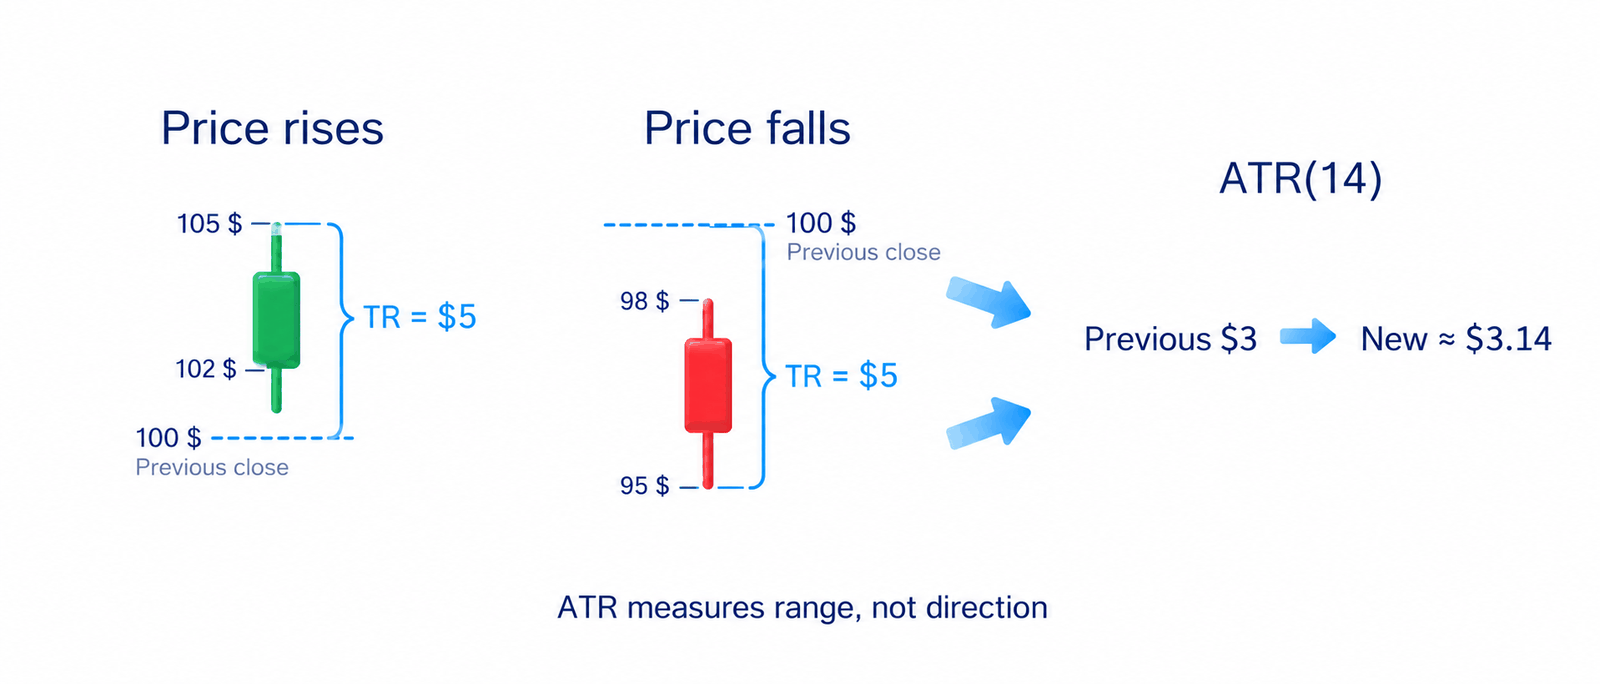
ATR can increase while price rises or falls. It measures distance rather than direction. Read the highs, lows and direction on the price chart itself. The chart-reading guide explains those observations without turning a volatility reading into an entry signal.
How ATR is calculated
Start with True Range, abbreviated TR, for one bar. The difference between its high and low misses a jump from the previous close when that close lies outside the current range. TR compares three distances and keeps the largest.
TR = max(H − L, |H − Cprev|, |L − Cprev|). H is the current high, L the current low, and Cprev the previous closing price. The vertical lines mean absolute value: take the distance as a positive number regardless of direction. All three inputs must come from the same instrument and chart period.
When the previous close lies within the current high-low range, the high minus the low is the largest distance. When that close is outside, the distance to one of the new extremes is larger. This captures a gap that the current candle's height alone would miss.
In Wilder's method, the first ATR is the average of the first n true ranges. Later values use the previous ATR: new ATR = (previous ATR × (n − 1) + current TR) / n. Here n is the smoothing length. A new large range changes the average gradually; ATR need not equal the latest bar's range.
TradingView labels its default ATR smoothing RMA, using Wilder's method, and also offers other averages in the settings. Matching only the length does not ensure that two platforms display identical values. Check their smoothing method, price source and available history before changing your calculation to make it fit the screen.
ATR calculation example
Consider a hypothetical daily share chart with prices in US dollars. The previous close was 100; the current high is 105, low 102 and close 104. The high-low range is 105 minus 102, or 3 dollars. The gap from the previous close means that this is not the full true range.
The three distances are 3, 5 and 2 dollars, so TR is 5. Suppose the previous ATR(14), already calculated using Wilder's method, was 3 dollars. The updated ATR is (3 × 13 + 5) / 14 = 3.142857, or about 3.14 dollars. This updates an existing average rather than calculating its initial value.
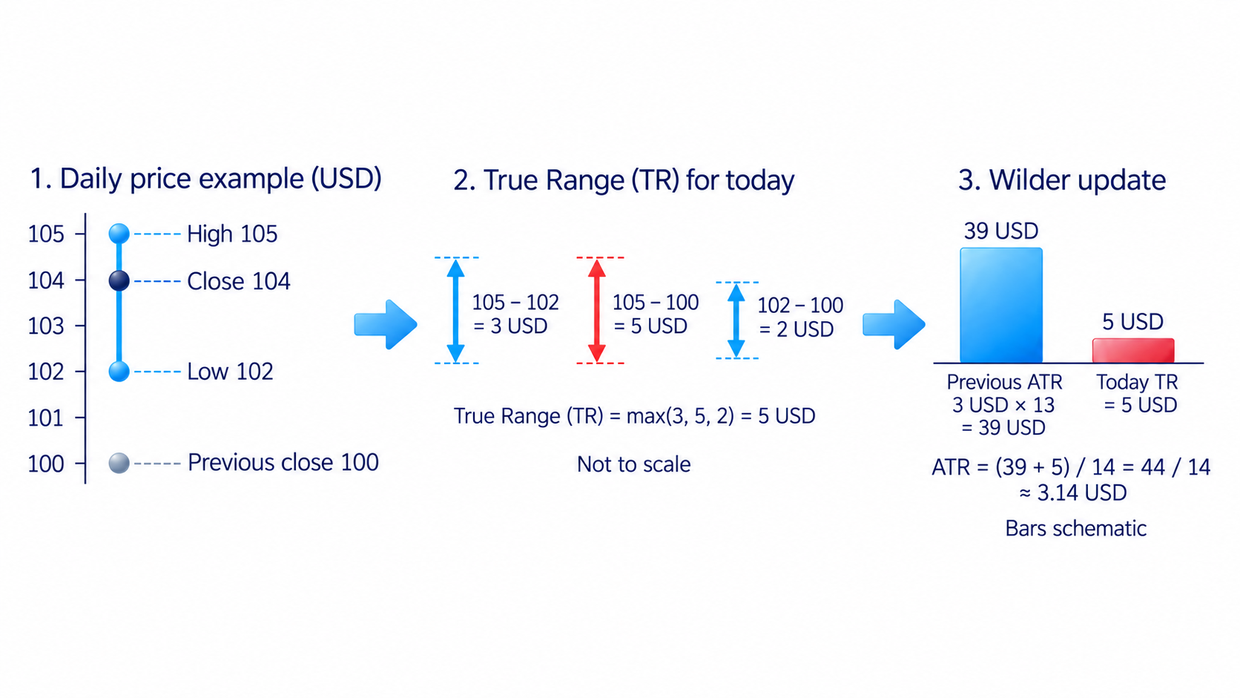
A single true range of 5 has not made the average equal 5. Keep precision inside the formula and round for display at the end. A shorter history or different initialization can produce a small difference from the platform even when the update formula is correct.
Choosing a length and comparing values
Fourteen is a common starting length, not a required setting for every trade. With the same smoothing method, a shorter length responds more quickly to new ranges, while a longer one changes more slowly. Choose and test the setting before judging a trade, rather than selecting whichever line looks best after its outcome is known.
Compare a high or low ATR with the same instrument's recent values under the same settings. A dollar reading from an expensive share and a much smaller reading from a cheap share do not by themselves establish which is relatively more volatile. Different sessions and chart intervals also change the comparison.
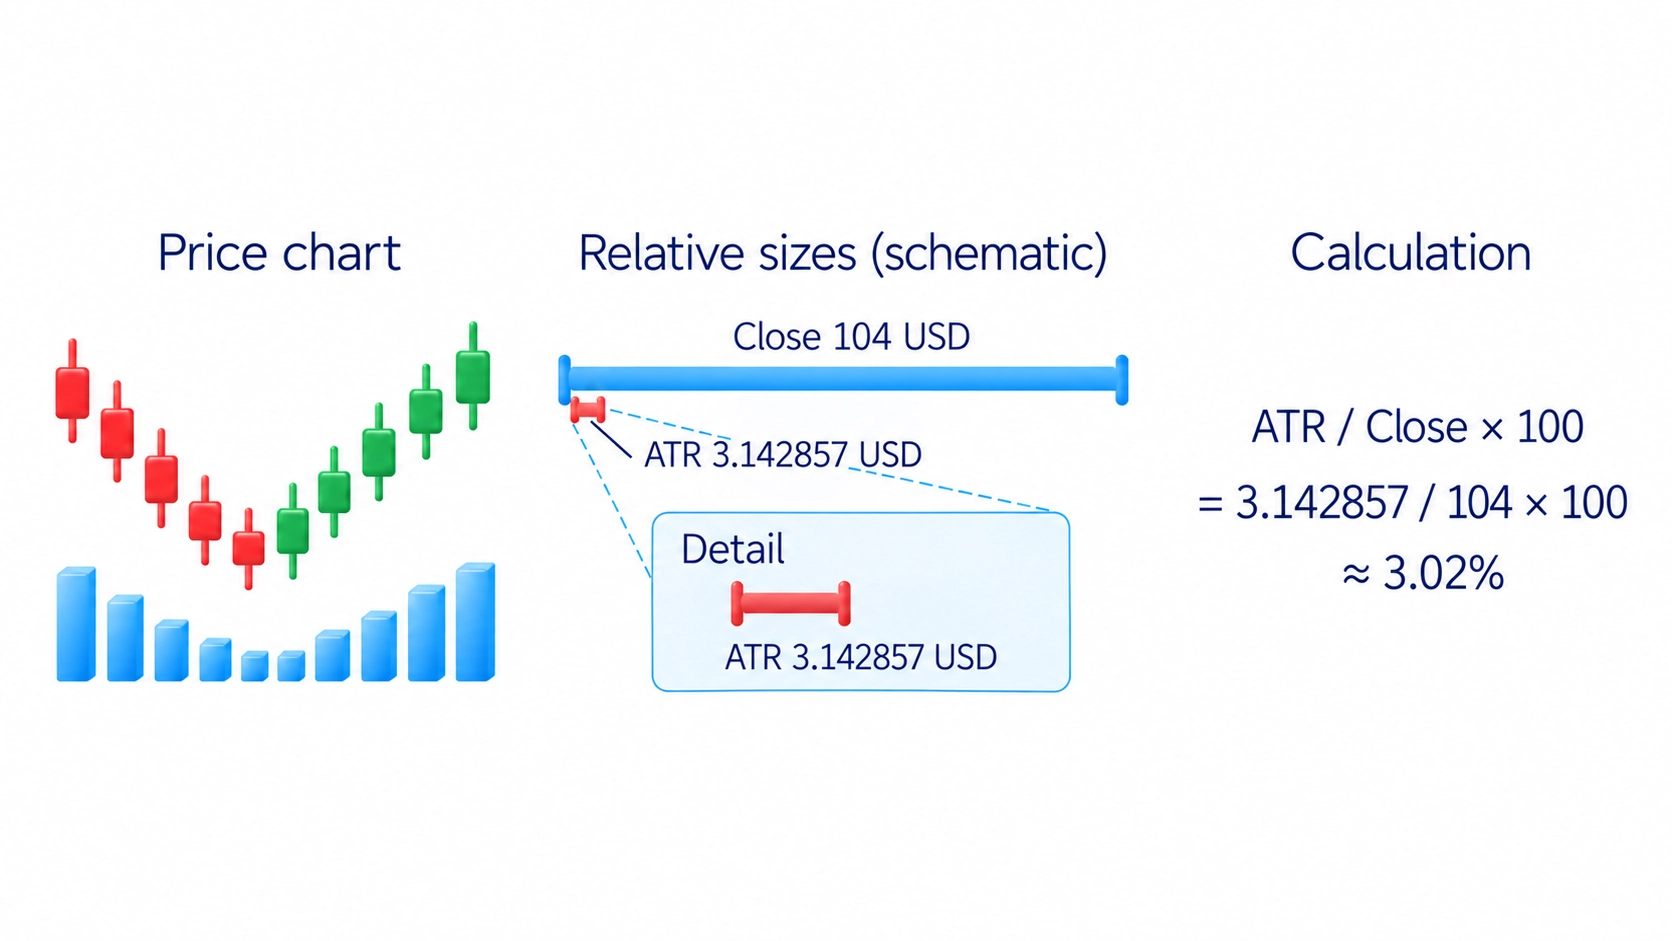
ATR percent, also called ATRP, expresses the range relative to price: ATR% = ATR / closing price × 100. Using the same example, 3.142857 / 104 × 100 is about 3.02%. This changes the units from dollars to a percentage of the close. Keep the timeframe, length and smoothing method consistent when comparing instruments.
That 3.02% is not the probability of a move, an expected return, or a limit on the next day's range. It describes recent true ranges relative to the current closing price. Normalizing the value makes the scale easier to compare; it does not create a forecast.
What rising and falling ATR mean
Rising ATR means that new true ranges are increasing the smoothed value. After a quiet stretch, it can help you notice wider fluctuations. Those wider ranges may accompany a continuing trend, a sharp move against it, or broad movement with no lasting direction.
Falling ATR means that the smoothed range is getting smaller. Price can still keep moving in one direction through smaller bars. A falling line does not establish that buyers have disappeared or that the trend has ended.
Low ATR does not choose the direction of a future breakout. If price crosses a range boundary, assess what it does next. ATR cannot distinguish a valid breakout from a failed one, and the first increase is not a complete buying condition.
In my video on ATR and exit preparation, I discuss unusually high readings as a reason to pay closer attention to exiting a trend trade or a possible period of sideways movement. I explicitly distinguish this from a reversal indicator. This is a guide in my approach, not a universal rule that price must turn when ATR peaks. The written calculation and limitations here stand on their own; the video is an optional practical addition.
The high and low of an unfinished bar can still change, so its TR and the current ATR can change too. If your rule compares completed bars, wait for that period to close. Testing the final historical value and acting on a changing live value are different conditions.
Using ATR with a stop-loss
A protective stop is an instruction intended to close a position when its trigger condition is met. ATR can help you check whether the planned distance is tight relative to recent fluctuations. First identify the price change that would invalidate the trade, then compare that boundary with the range. A conveniently small loss distance does not make the boundary suitable.
Some systems set a distance as a multiple of ATR. The multiplier is part of the chosen rule; there is no universally safe number. One ATR is not the maximum possible next move, and a stop several ATR away can still trigger. The calculation also does not cover commissions, the difference between buying and selling prices, or a worse-than-planned execution price.
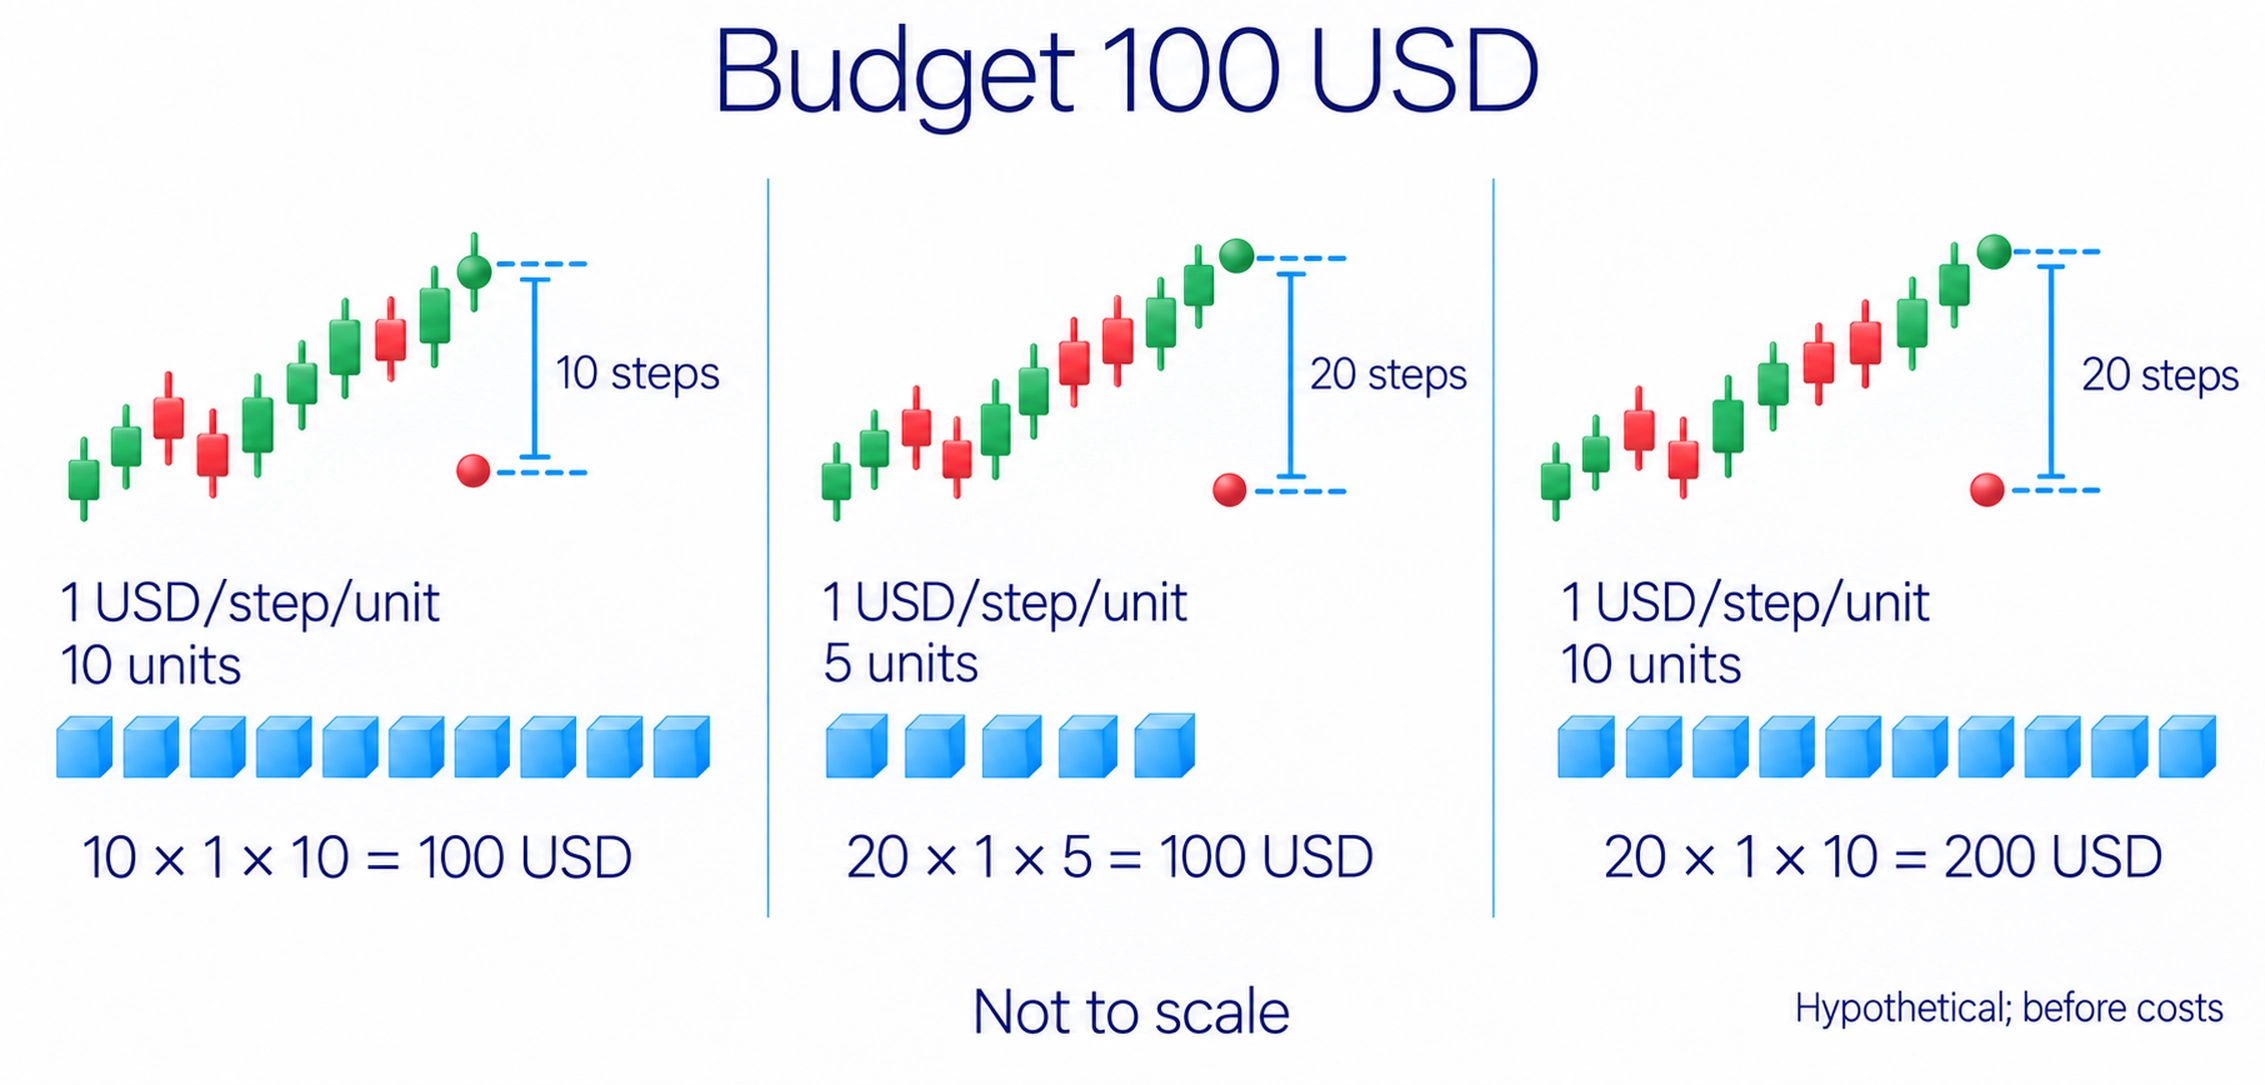
Before entry, a wider necessary exit distance calls for a smaller position if the money loss budget is unchanged. The course's position-sizing section explains the sequence: choose the allowed loss, the distance to the exit and the instrument's value per price step. ATR informs the scale of the distance; it does not replace these inputs or provide its own permission to risk more.
Moving an exit farther away while keeping the same quantity increases the planned loss. Rising ATR after entry is not permission to do that. The risk-management guide explains the money calculation and execution limits. Decide how changing volatility affects the trade before opening it, rather than revising the loss budget while it is losing.
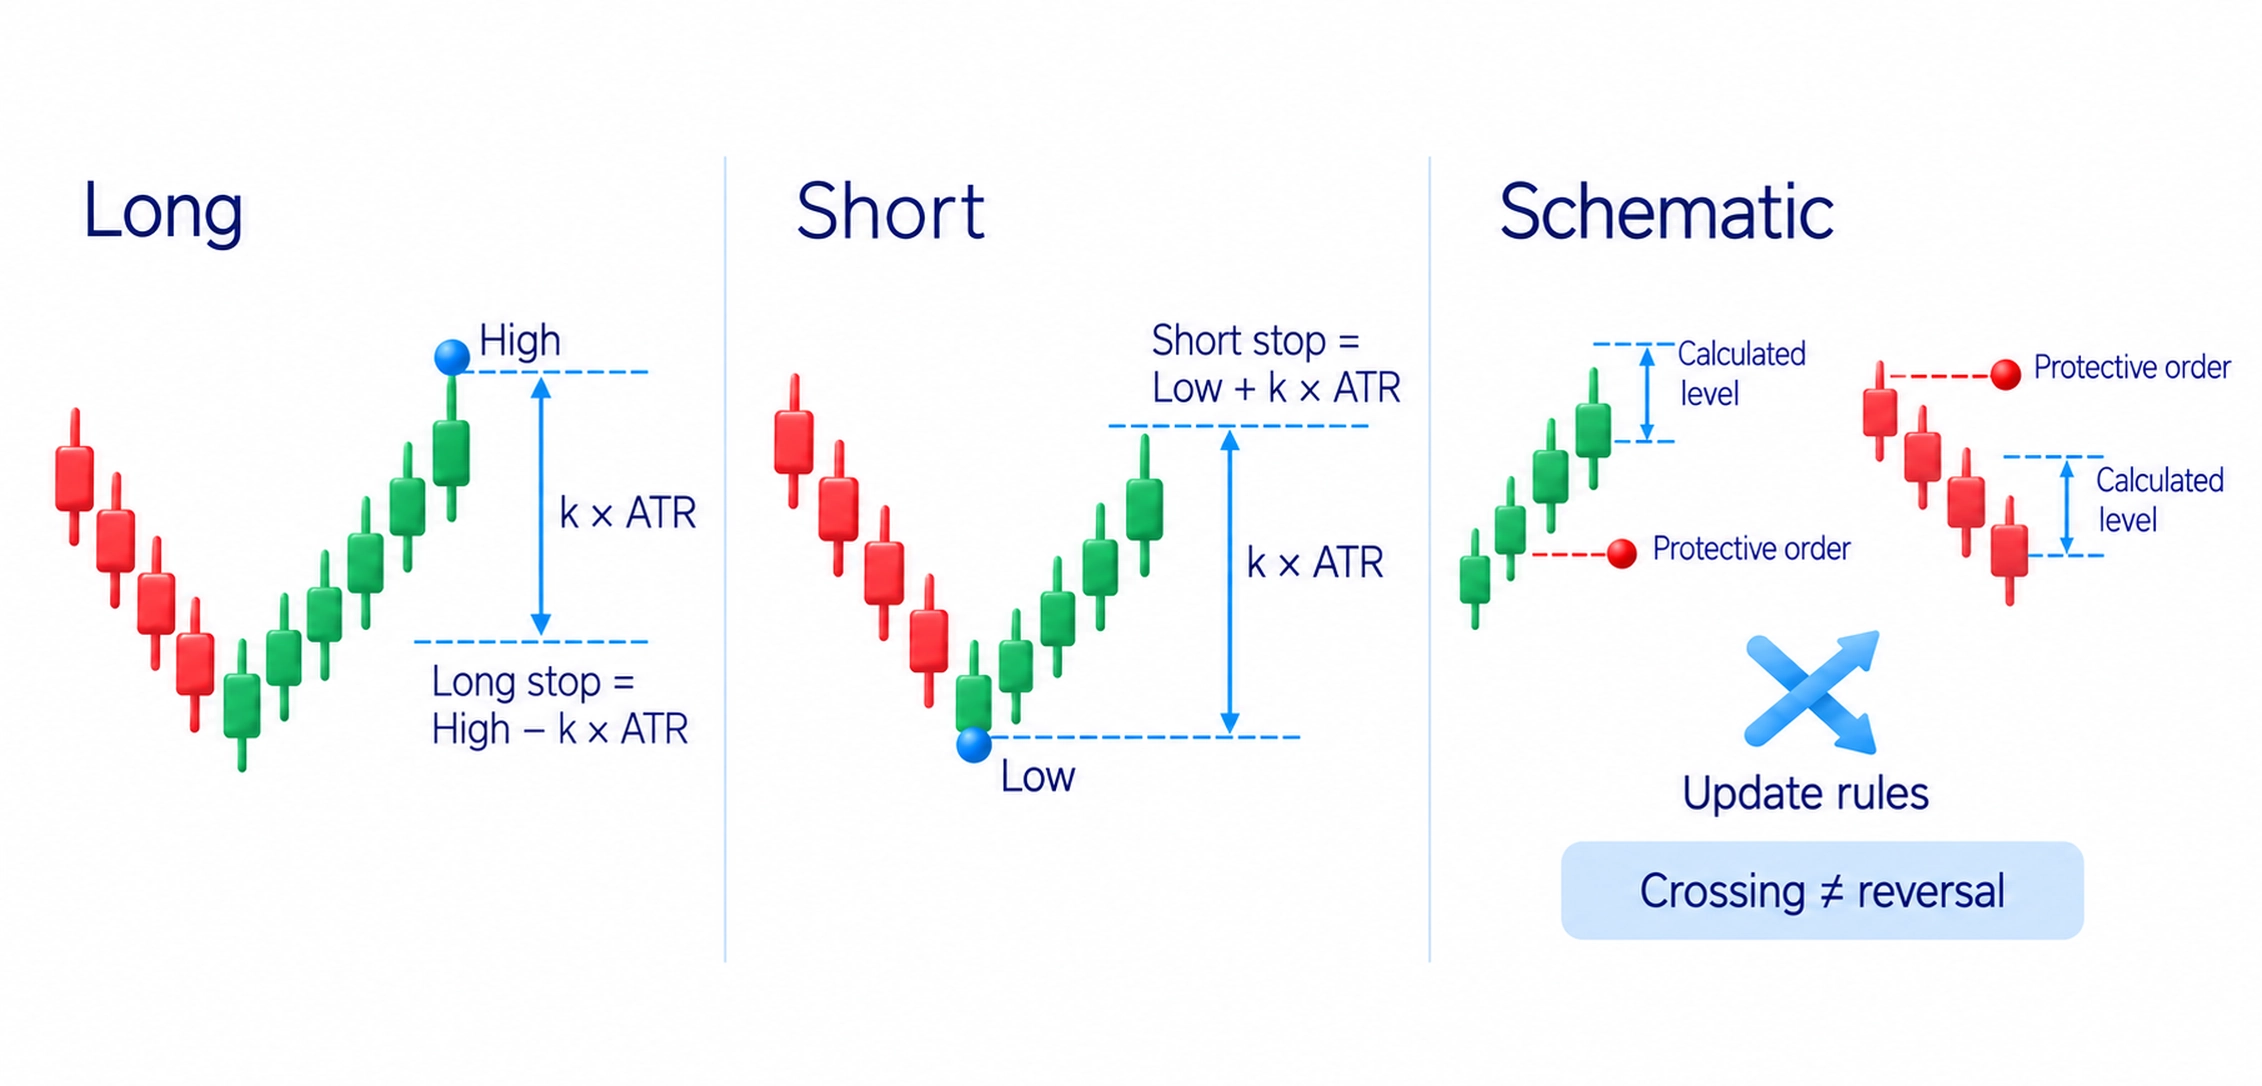
Chandelier Exit is an example of an ATR-based exit line. For a long position, one opened to benefit from a rise, it subtracts a multiple of ATR from the highest price in a selected past period; for a short position, one opened to benefit from a fall, it adds that multiple to the lowest price. The period used for the high and low, ATR length and multiplier are settings to check. A line crossing is evaluated under the exit rule, not treated as proof of a reversal.
The calculated Chandelier line can rise or fall as the extreme prices and ATR change. A protective order has separate instructions: specify whether it may only tighten, when to update it and what triggers execution. An indicator line moving away from price does not authorize increasing the original loss budget.
How to check an ATR rule
Open an ordinary price chart and record the instrument, source, timeframe, length and smoothing method. On one completed bar, compare the three TR distances, then check the ATR update. If it differs from the platform, verify settings and history before altering the formula.
Mark a quiet stretch and the next expansion. Check whether price rose, fell or changed direction during each. This separates the size of fluctuations from their direction and prevents you from treating every ATR increase as a buy signal.
If ATR is part of an exit rule, write the invalidation condition, the distance rule and the response to higher volatility before entry. Test the same instructions on both successful and unsuccessful cases. The planned money risk remains the constraint; a moving indicator should not quietly rewrite it.
Frequently asked questions
ATR averages recent true ranges, including gaps relative to the previous close. It expresses the size of fluctuations in price units, not the direction of the next move.
The current high-low range can miss a jump from the previous close. True range (TR) compares that range with the distances from the previous close to the current high and low, then selects the largest.
First define the price change that invalidates the trade, then compare the exit distance with ATR. If a wider distance is necessary before entry, reduce quantity to fit the same money risk. No multiplier guarantees that the stop will stay untouched.
No. Large ranges can accompany continuation, a reversal or broad sideways fluctuations. In my approach, an extreme reading prompts a review of the exit; it is not a ready-made instruction to trade against the trend.
It means the smoothed true range is increasing. Judge the direction and whether a breakout holds from price itself: ATR cannot distinguish a lasting breakout from a failed one.
It is ATR divided by the closing price and multiplied by 100. With consistent settings, this helps compare ranges relative to price. It is not a probability or promised return.
Chandelier Exit places a calculated line a multiple of ATR below a period high for a buying position or above a period low for a position opened to benefit from a fall. The line can move in either direction; the actual protective order needs separately defined update and execution rules.
About the author
Igor Arapov, a practising trader since 2013 and author of the ArapovTrade library. ORCID: 0009-0003-0430-778X.




