Elliott wave analysis labels price movement as directional sections and pullbacks within a larger structure. A proposed count helps describe where a move might fit. To read it usefully, distinguish the model’s rules from its optional guidelines and identify the price condition that would make the count invalid.
What Elliott Wave Theory means
Ralph Nelson Elliott developed the method while studying stock-market patterns in the 1930s. The theory connects recurring price structures with crowd psychology. A chart shape alone does not establish that all participants shared a particular emotion, nor does assigning a label prove what price will do next.
A wave is a selected section of movement between price turns. It can belong to a larger wave while containing smaller ones. That place in the hierarchy is called its degree. Compare waves at the same degree: a small pullback inside wave three is not the whole second wave of the larger pattern.
A chart interval is the time covered by one bar, the individual period on the chart. Wave degree is a position in the proposed hierarchy, not a fixed chart interval. Switching from hourly to daily bars does not automatically turn each hourly pivot into a larger-degree wave. The chart-reading guide explains highs, lows and bars before their interpretation as a pattern.
The basic teaching model combines a five-wave directional phase with a three-wave correction labelled A, B and C. In an upward cycle, the first phase advances and the correction gives back part of that advance; a downward cycle reverses the directions. This is a starting model, not a requirement to find exactly eight simple segments in every chart.
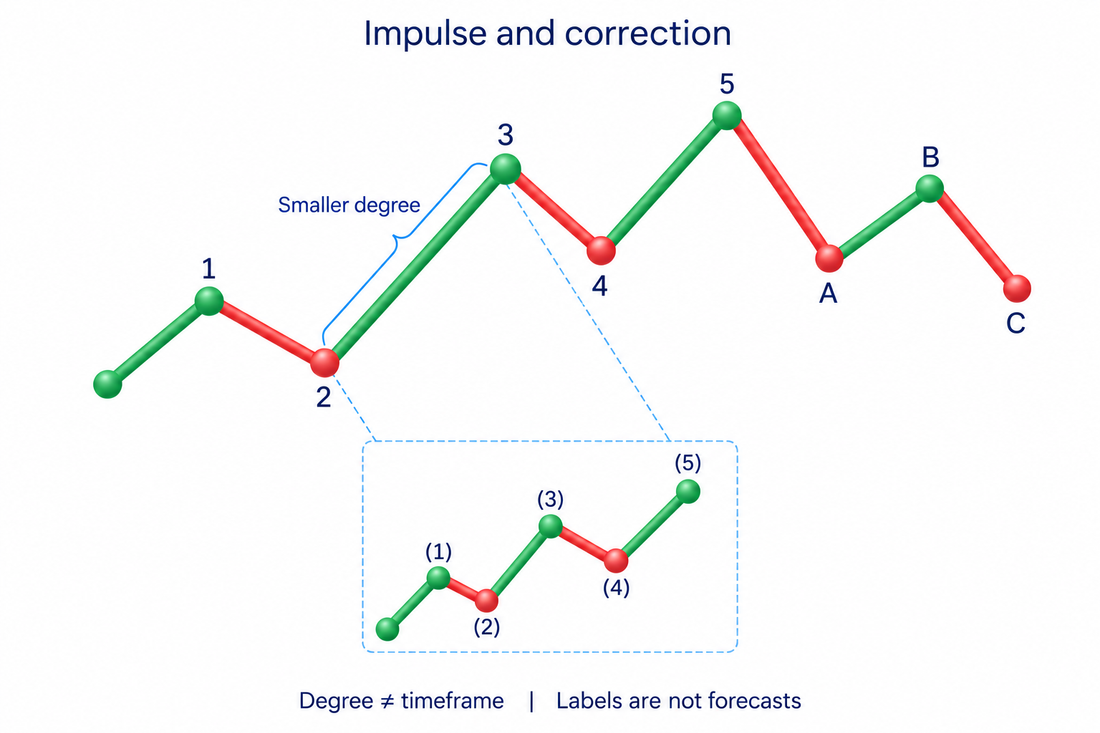
The five waves of an impulse
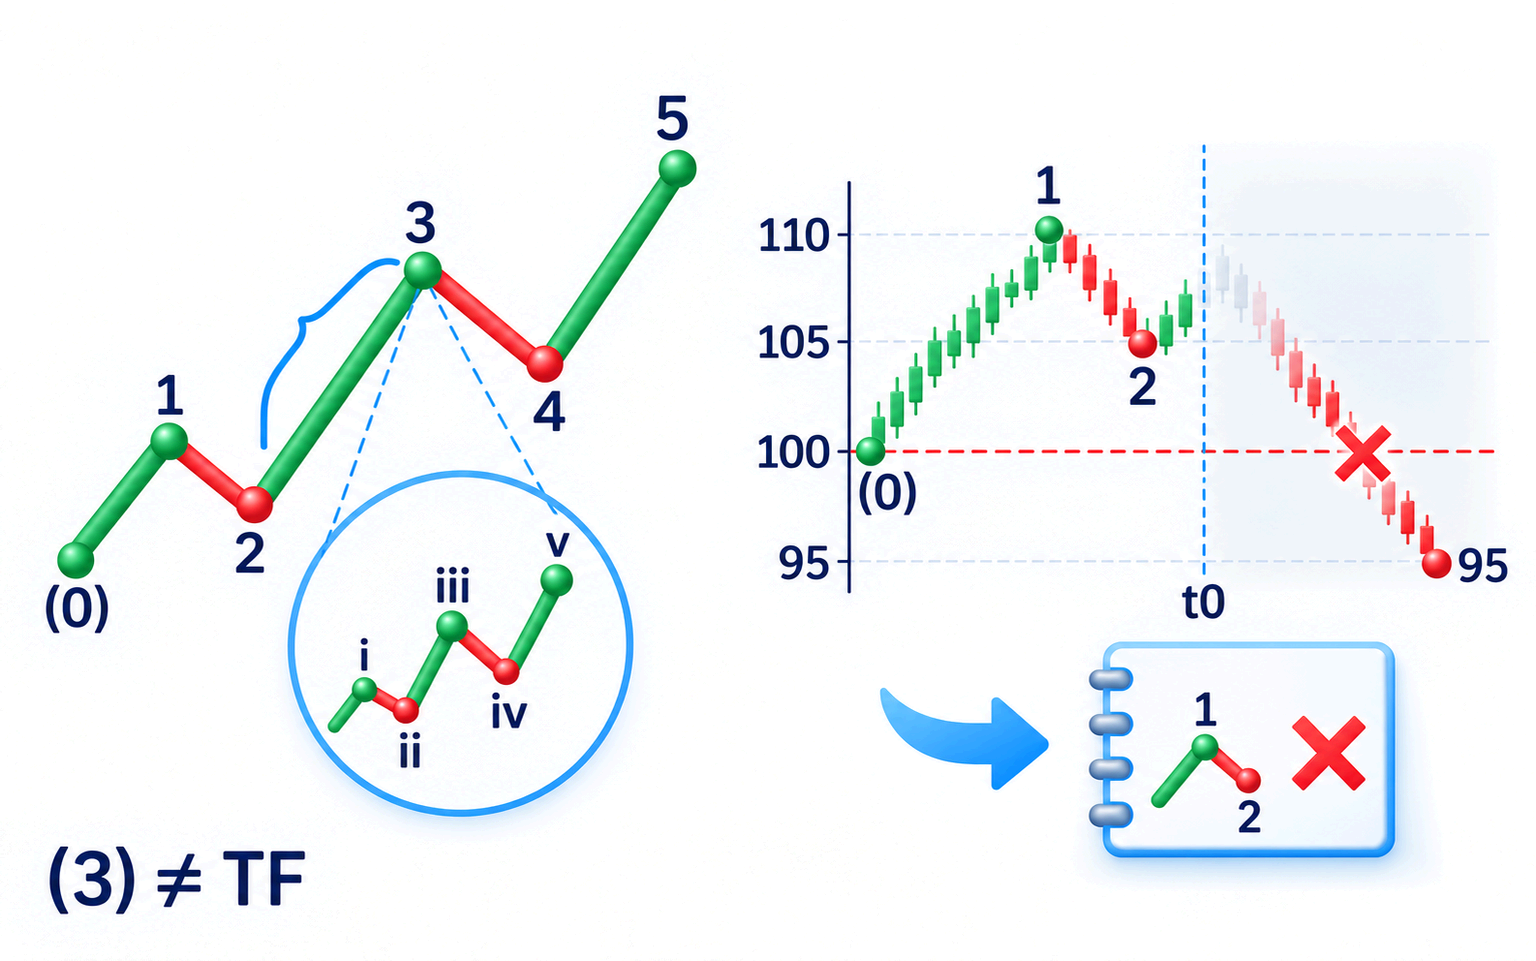
An ordinary impulse has five waves. Waves one, three and five move in the impulse’s direction; two and four pull back. Therefore, a five-wave upward impulse includes falling sections. Five waves up does not mean five uninterrupted rises.
Its usual subdivision is written 5–3–5–3–5. Those numbers describe the smaller structures within each wave. The directional waves have motive structure, which advances the larger movement, while the intervening waves are corrective. Here, a “three” is shorthand for a correction; it may contain more than three obvious line segments.
Wave three need not be the longest. One directional wave can extend, containing additional visible subdivisions. A fifth can also end without reaching the end of wave three; this is called a truncated fifth. Such variants need suitable internal structure. They are not excuses to preserve any count that price has contradicted.
Descriptions such as an uncertain first wave or a euphoric fifth are interpretations of crowd behaviour. They do not replace the price rules. Rising trading volume, meaning a larger quantity traded in the selected data, does not certify wave three, and falling volume does not prove that wave five has ended. The volume-analysis guide explains what recorded trading activity actually measures.
Three rules for checking an impulse
For an ordinary upward impulse, check the pullback boundaries and the lengths of the directional waves. In a simple linear-price comparison, length is the difference between the start and end prices. It is not the number of bars or how long the movement took.
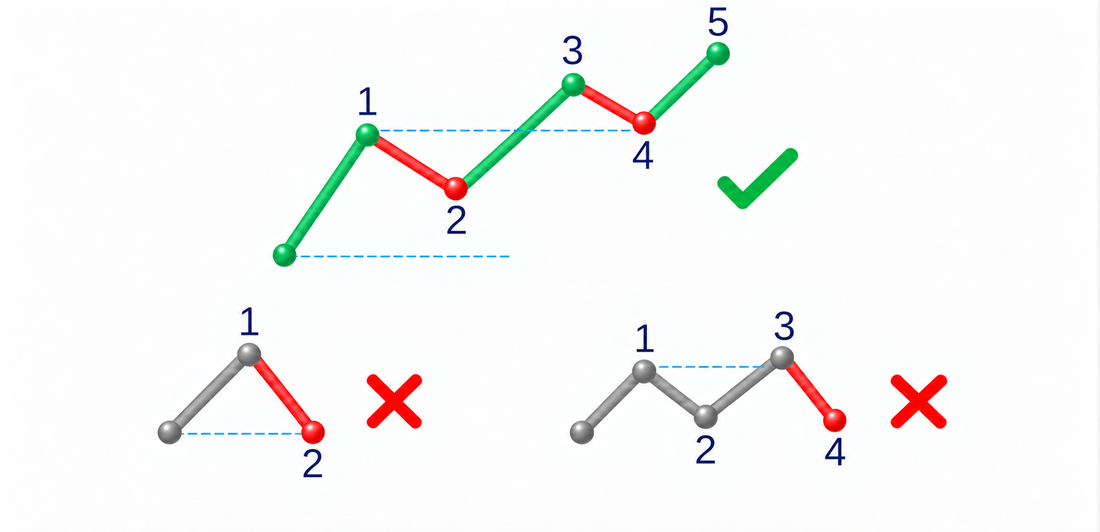
- Wave two does not retrace the whole of wave one. In an upward impulse, its low remains above the start of one.
- Wave three is not the shortest among one, three and five of the same degree. Compare those directional waves, not waves two and four.
- Wave four does not enter wave one’s price territory. In an ordinary upward impulse, its pullback remains above wave one’s high.
Reverse the checks for a downward impulse: wave two stays below the start of wave one, and wave four stays below wave one’s price territory. A broken rule invalidates that proposed ordinary-impulse count. It does not require price to reverse immediately.
The theory also includes a diagonal, a motive pattern that often looks like a wedge. Its first and fourth waves can overlap, unlike an ordinary impulse. You cannot apply the ordinary no-overlap rule to every five-part pattern. Equally, calling a failed impulse a diagonal is insufficient: check the proposed diagonal’s place in the larger structure and its subdivisions.
Why corrections are not always three simple waves
A correction moves against a trend of a larger degree. Wave C within it can itself form a forceful five-wave impulse, even though the whole correction is a pullback of the larger trend. Direction and structural role must be considered together.
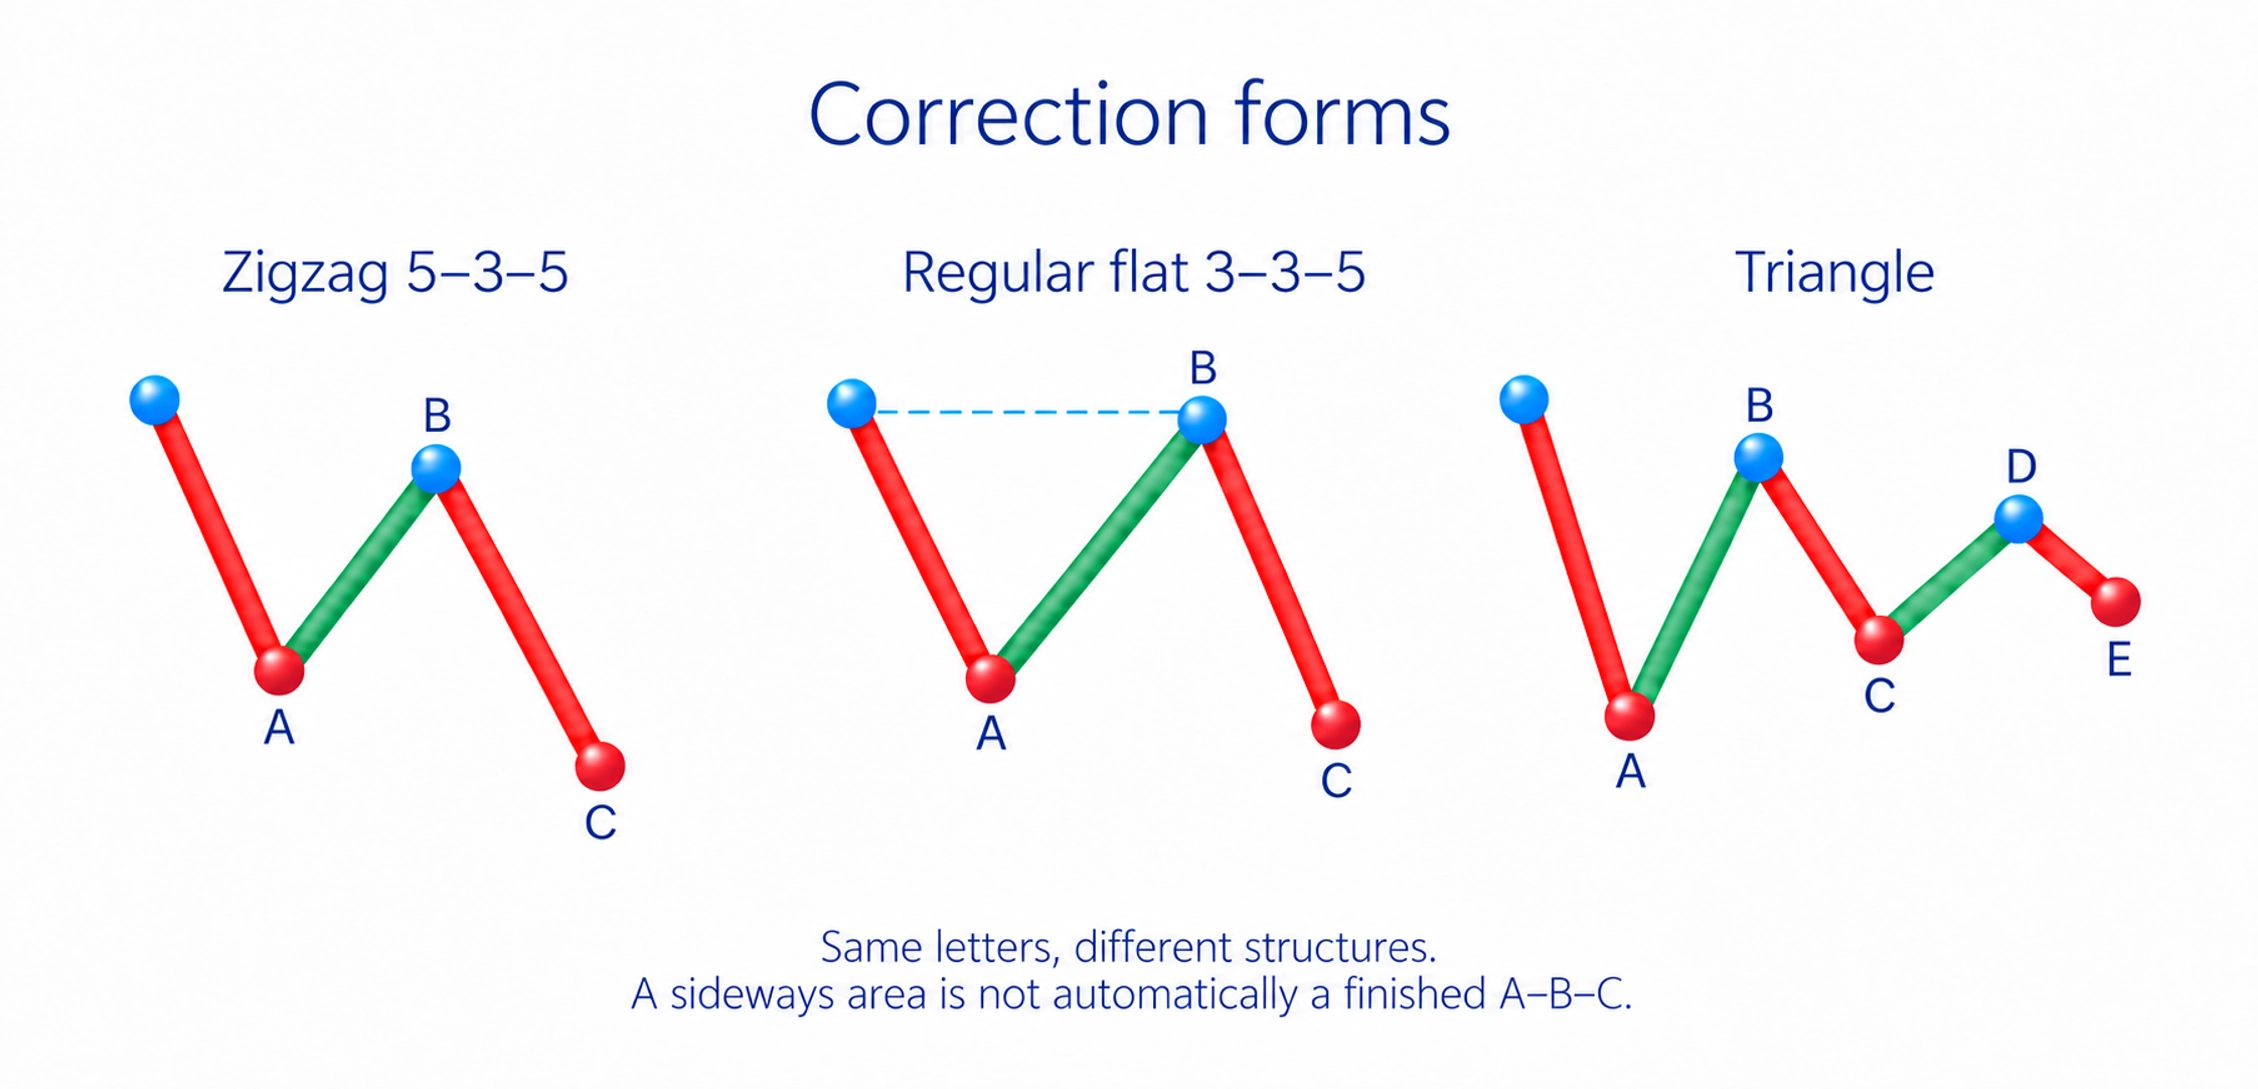
A zigzag is labelled A–B–C with a 5–3–5 subdivision: movement A, a return B and continuation C. A flat has a 3–3–5 subdivision; in its regular form, B returns near the start of A. Other flat forms can take B beyond that start. Identical letters do not mean identical internal rules.
An Elliott triangle contains five overlapping legs labelled A–B–C–D–E, not three. Corrections can also combine patterns linked by an intervening corrective wave. For a beginner, the essential point is that a sideways area is not automatically a finished A–B–C. Identify its internal form rather than forcing the basic model onto it.
When subdivisions are unclear or several counts remain plausible, record the uncertainty. Adding more letters does not by itself make the interpretation more precise. Identify the visible turns and the next observation that would distinguish the alternatives.
A wave-counting example
Consider a teaching sequence quoted in hypothetical price points on a linear scale. It begins at 100, and the proposed wave endpoints are 110, 105, 125, 118 and 130. Assume that the intervening subdivisions fit the model; in a real chart, that assumption needs a separate check.
Wave one measures 110 − 100 = 10 points, wave three 125 − 105 = 20 points and wave five 130 − 118 = 12 points. Three is not the shortest. Wave two ends at 105, above the start at 100; four ends at 118, above the first peak at 110. The proposed sequence meets those three ordinary upward-impulse checks.
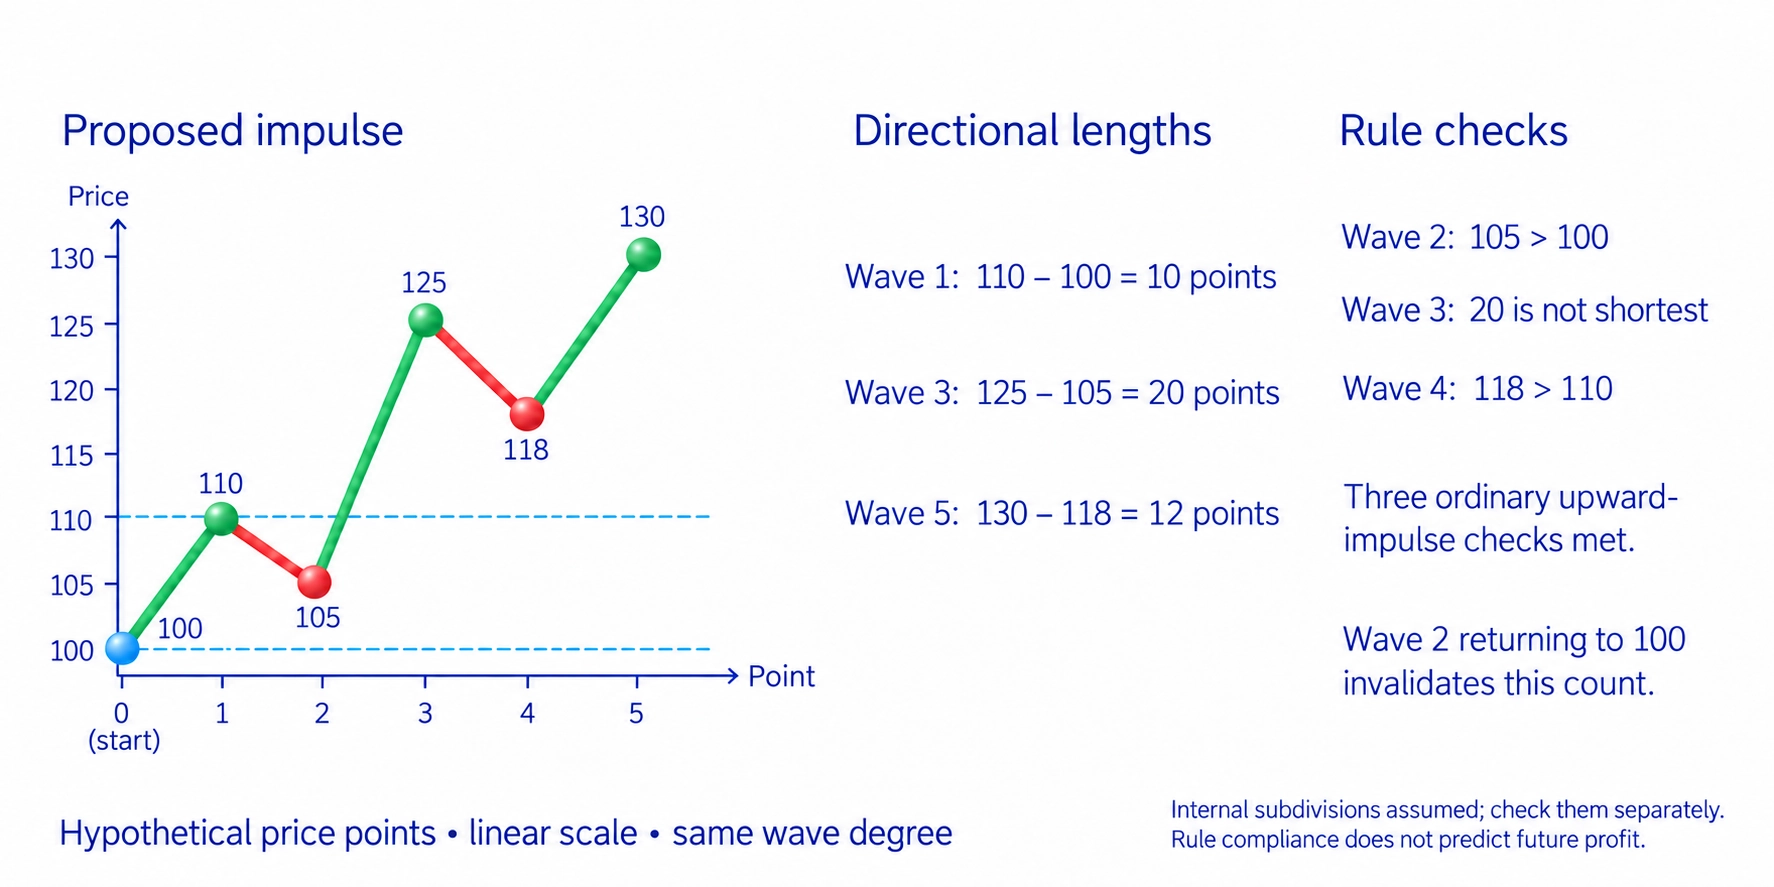
That result establishes compliance with selected structural rules, not a future profit or an exact next pullback price. If the proposed second wave returned to 100, the original count would fail its retracement rule. If price continued rising after the labelled fifth, recheck whether the fifth had actually finished rather than defending the old number against new data.
Fibonacci proportions provide additional references for retracement depth and relationships between wave lengths. Values such as 38.2%, 61.8% and 161.8% describe ratios of selected movements, not forecast probabilities. Reaching a ratio is not an obligation imposed on the market. The Fibonacci-level guide explains how the prices are calculated.
Avoiding hindsight in wave counts
The hardest decisions occur at the last bars currently available. A turn might end a correction or form only an intermediate part of it. Different starting points, degrees and choices of smaller pullbacks can produce different counts of the same chart.
Automatic labels do not remove that uncertainty. A ZigZag tool connects turns according to a specified price-change threshold, and its latest segment can change. Automated Elliott tools also use selected pivots and pattern settings, updating counts as new data arrive. A neatly numbered final chart is not independent proof that the same structure was known beforehand.
Reveal historical bars one step at a time without viewing future prices. Record the current count, why its starting point was chosen and the price that would invalidate it. Keep invalidated counts as part of the record. Renumbering the entire history after every outcome cannot show what was actually known before the move.
My course’s section on market phases starts from visible highs, lows and range boundaries. It distinguishes rising or falling structure, then connects the active direction with buying near support or selling near resistance. That is the sequence used in my method. It is not an instruction to buy a third Elliott wave or treat a wave number as proof of a trend.
The Wyckoff-method guide develops the relationship between price structure and trading activity. It does not turn those observations into a flawless forecast. My optional video on limitations of chart patterns discusses the uncertainty of graphical formations generally; it is not a dedicated Elliott-wave lesson.
Before using a wave scenario, identify the rules it meets, the movement that would invalidate the count and the trade condition required beyond its number. The trading-system guide addresses entry and exit rules; the risk-management guide addresses the permitted money loss. A wave label does not supply those decisions.
Frequently asked questions
It is a way of labelling directional movement and pullbacks within a proposed hierarchy. The basic model has a five-wave phase followed by A–B–C, but corrections can take more complex forms. A count is an interpretation of structure, not a guaranteed future sequence.
An ordinary impulse advances in its direction through five waves, including two internal pullbacks. A correction opposes a larger movement; one section within that correction can itself have impulse structure. Its place within the larger pattern and the role of the section therefore matter.
No. Wave three must not be the shortest among one, three and five of the same degree. Another directional wave can be the longest. Compare price lengths on the chosen basis rather than counting bars.
Analysts can choose different starts, degrees and boundaries of an unfinished correction. Test each proposed count against its rules and a predefined invalidation condition. Relabelling after the outcome alone does not establish that the earlier interpretation was useful.
No. A Fibonacci percentage describes a relationship between selected price distances. It does not give the chance that a target will be reached or replace checking the wave structure.
About the author
Igor Arapov, practising trader since 2013 and author of the ArapovTrade library. ORCID: 0009-0003-0430-778X.




