Fibonacci retracement levels mark fractions of a selected price movement. The drawing turns the distance between two prices into percentage reference points. It helps identify prices to observe during a pullback; it does not determine where that pullback must end.
A retracement is movement back against an earlier rise or fall. If price gives back half of an earlier rise, the retracement is 50%. That means half of the measured movement, not a 50% fall in the asset’s price. Keep that denominator clear before drawing the levels.
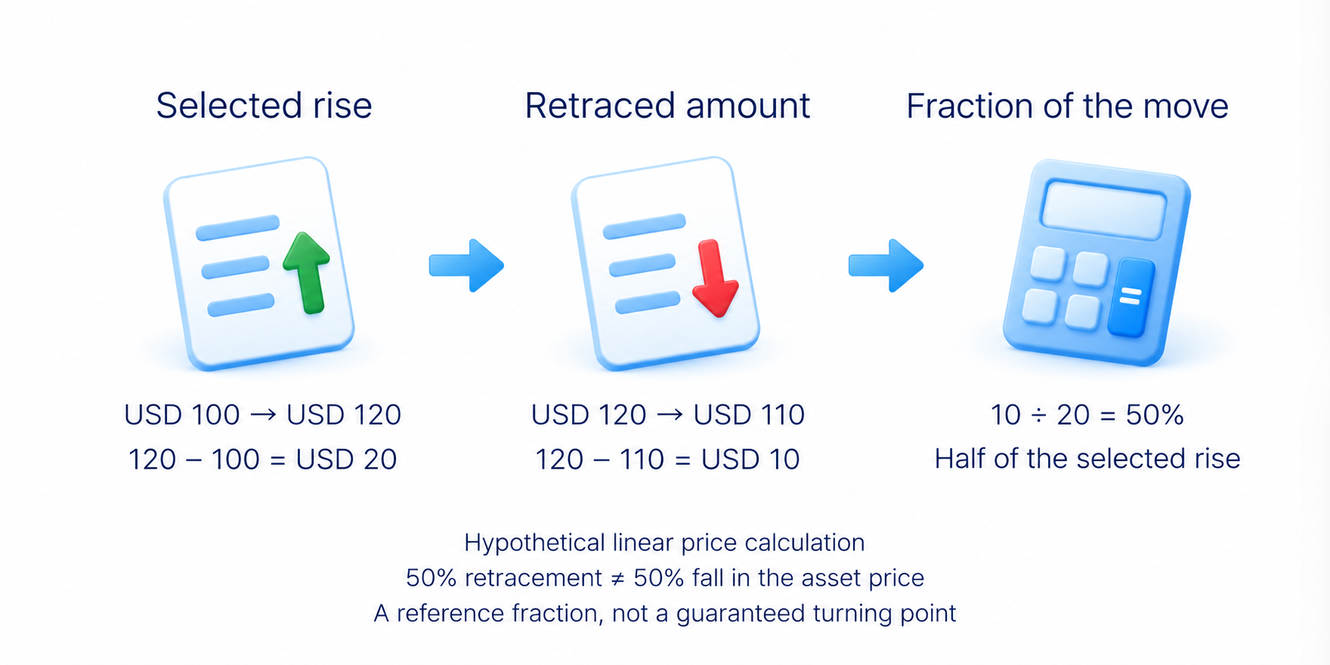
What 38.2%, 50% and 61.8% mean
In the Fibonacci sequence, each number is the sum of the previous two: 0, 1, 1, 2, 3, 5, 8 and so on. Ratios of sufficiently large numbers approach particular values. Dividing a number by the next approaches 0.618; dividing it by the number two places later approaches 0.382. These relationships underlie the 61.8% and 38.2% marks.
The 50% mark is the midpoint of the move, not one of those Fibonacci ratios. Tools can also include 23.6% and 78.6%; the latter is associated with the square root of 0.618. The displayed set depends on the platform and settings. A familiar label does not establish a particular likelihood of a reversal.
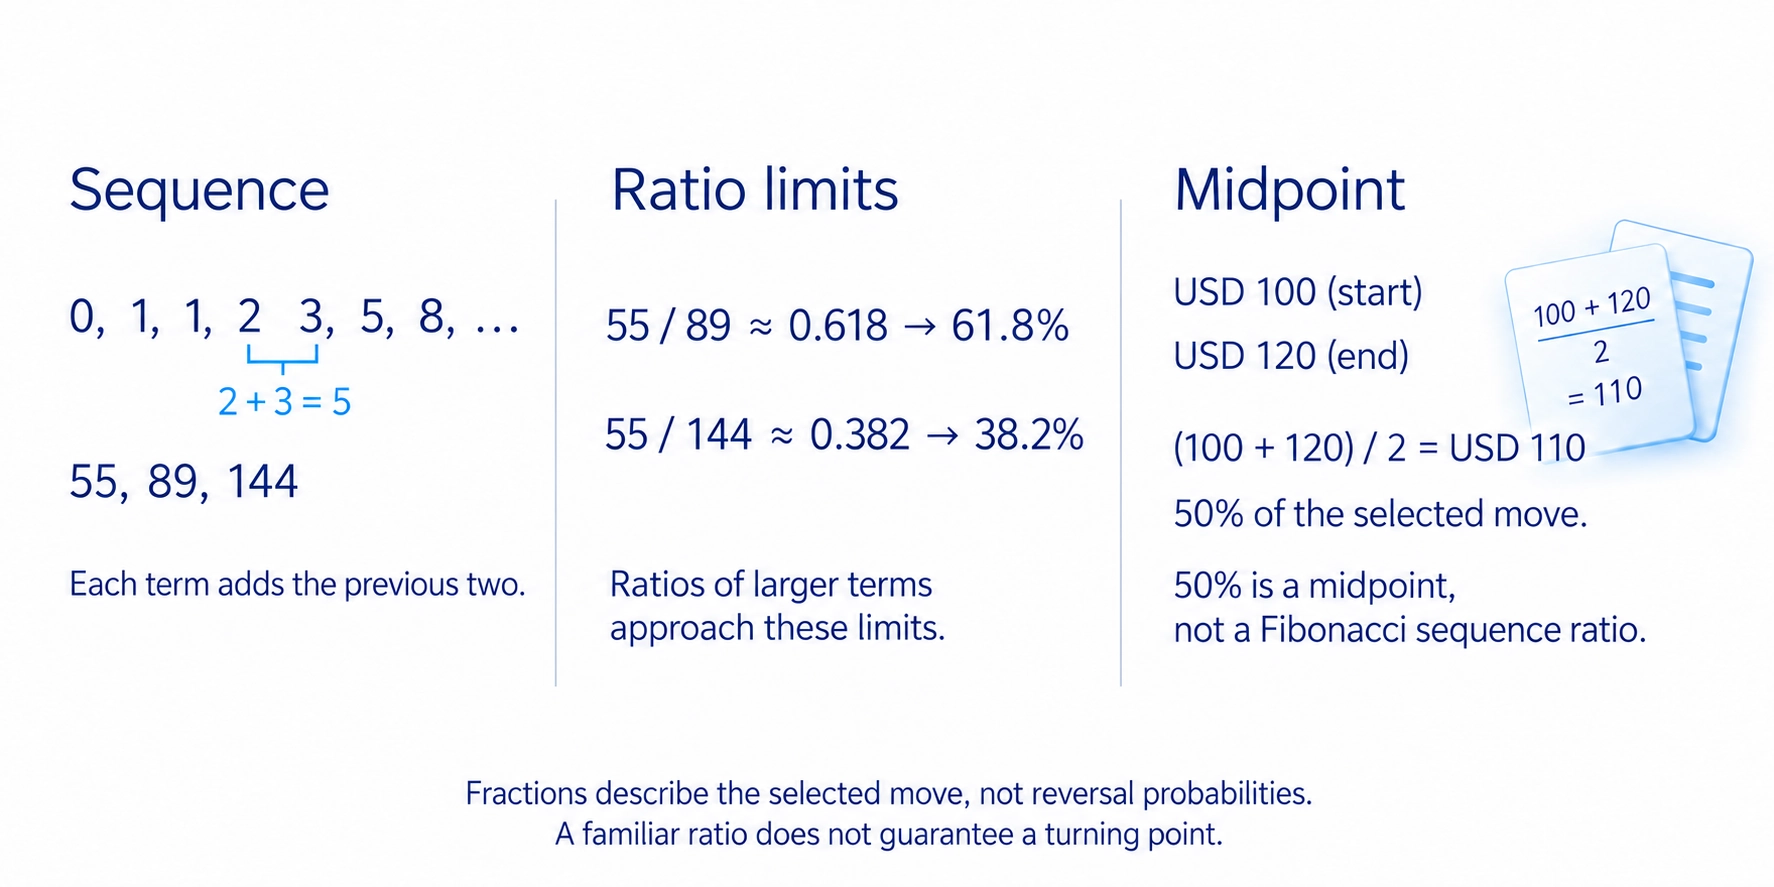
The percentages describe the geometry of the pullback. A shallow retracement gives back a smaller part of the move; a deep one gives back more. Neither percentage measures future demand. Calling 61.8% the strongest level or the best entry requires evidence from a defined rule and data, not the ratio alone.
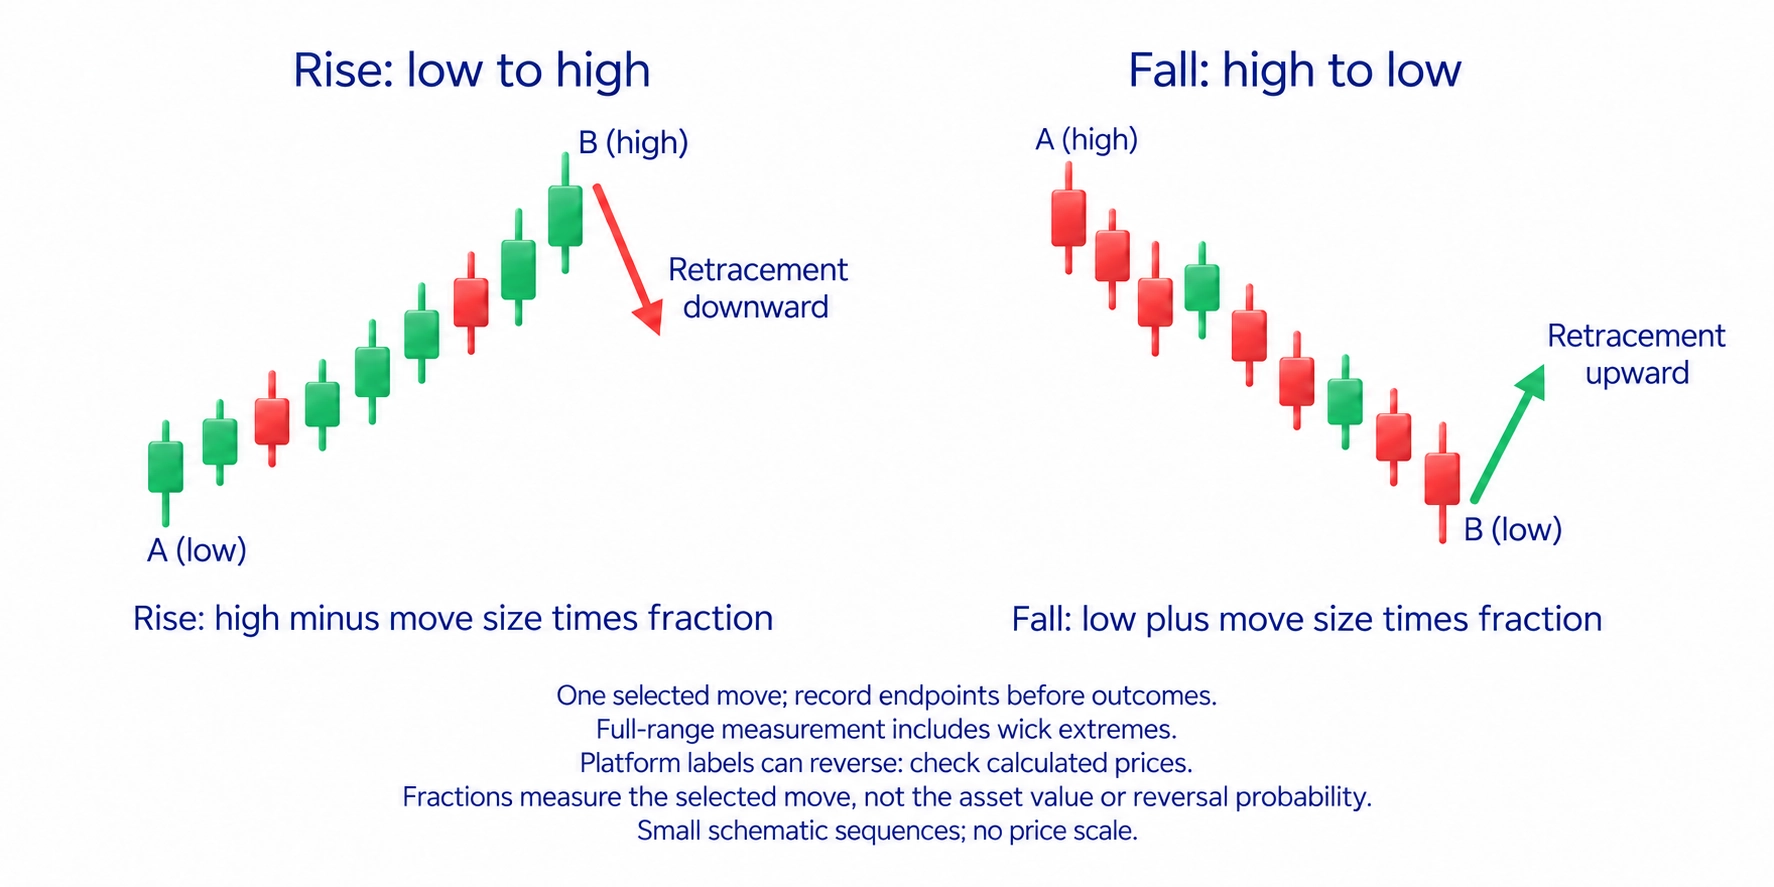
Drawing a Fibonacci retracement
First choose the movement whose retracement you want to measure. For a rise, identify its starting low and ending high; for a fall, its starting high and ending low. Use one recognisable movement. Combining unrelated moves because a resulting line happens to match a later turn fits the drawing to an outcome already known.
In TradingView, choose Fibonacci Retracement and mark the two endpoints. If you are measuring the full recorded range, include the candle highs and lows, including the thin lines that mark those extremes. If a defined method uses closing prices instead, apply that choice consistently. Ignoring those thin lines is not inherently more accurate.
Check the endpoint prices and where the percentage labels appear. Platforms can reverse the drawing, placing zero at either end. Compare the calculated price of the retracement rather than relying on the screen position of a label. The chart-reading guide explains the underlying candle prices and chart periods.
If the ending high is still rising, the measured distance is changing. A new high produces new retracement prices. That is a change in inputs, not an improvement in predictive ability. Decide when an endpoint becomes fixed and what would justify replacing the drawing before comparing outcomes.
A retracement and extension example
Consider a hypothetical share-price rise from USD 100 to USD 120. The move covers USD 20 per share. On a linear price calculation, a retracement after a rise is the ending high minus the movement’s size multiplied by the fraction retraced.
The 38.2% price is 120 − 20 × 0.382 = USD 112.36. The midpoint is USD 110, and the 61.8% price is USD 107.64. All three refer to the same rise from USD 100 to USD 120. None of these percentages is a calculated probability that price will reverse there.
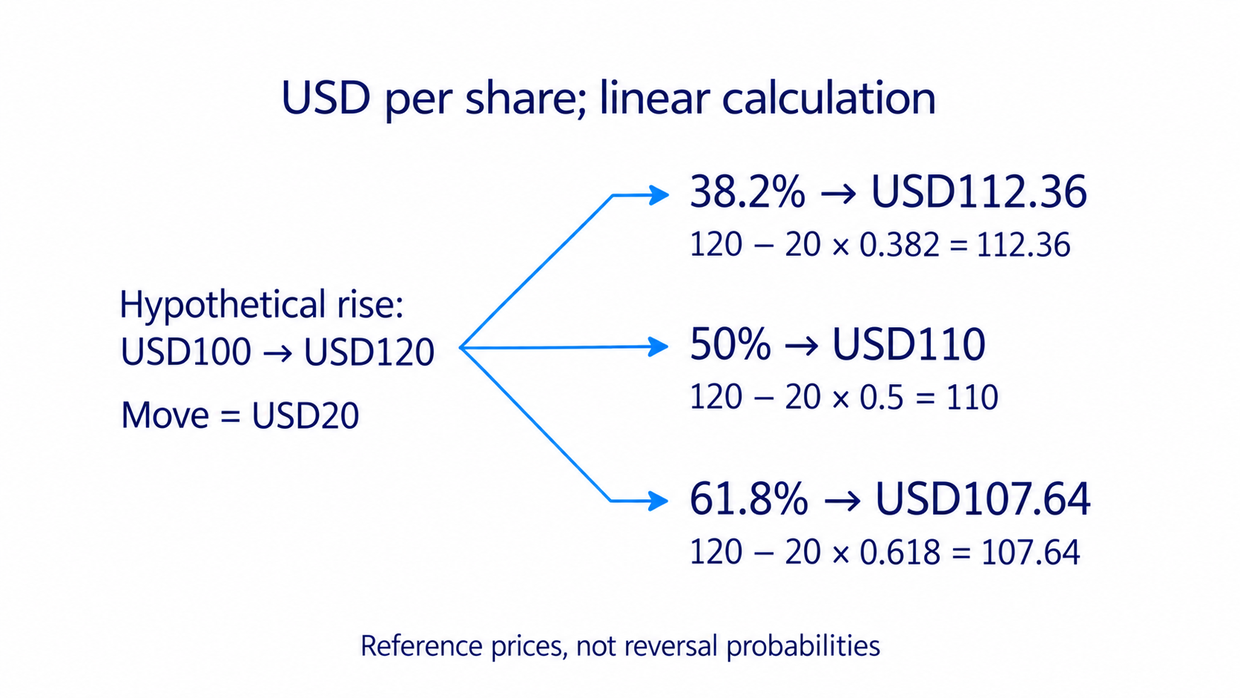
After a decline, measure the retracement upward from its ending low: add the chosen fraction of the decline’s size. The direction changes, not what the fraction means. Some tools offer a separate calculation for logarithmic charts, where equal distances represent proportional changes. The arithmetic above is the linear calculation.
Extensions provide projected price references for a possible continuation. Distinguish extending a two-point drawing from a three-point projection. A two-point drawing continues its existing scale outside the endpoints. A three-point tool takes the move from A to B and projects a chosen multiple of its length from a third point, C.
Continue the same teaching example: A is USD 100, B is USD 120 and the pullback ends at C, USD 110. A three-point upward projection at 1.618 is 110 + (120 − 100) × 1.618 = USD 142.36. The projection starts at C. Starting the same multiple from A would produce a different price, so “161.8%” alone is not enough to compare two drawings.
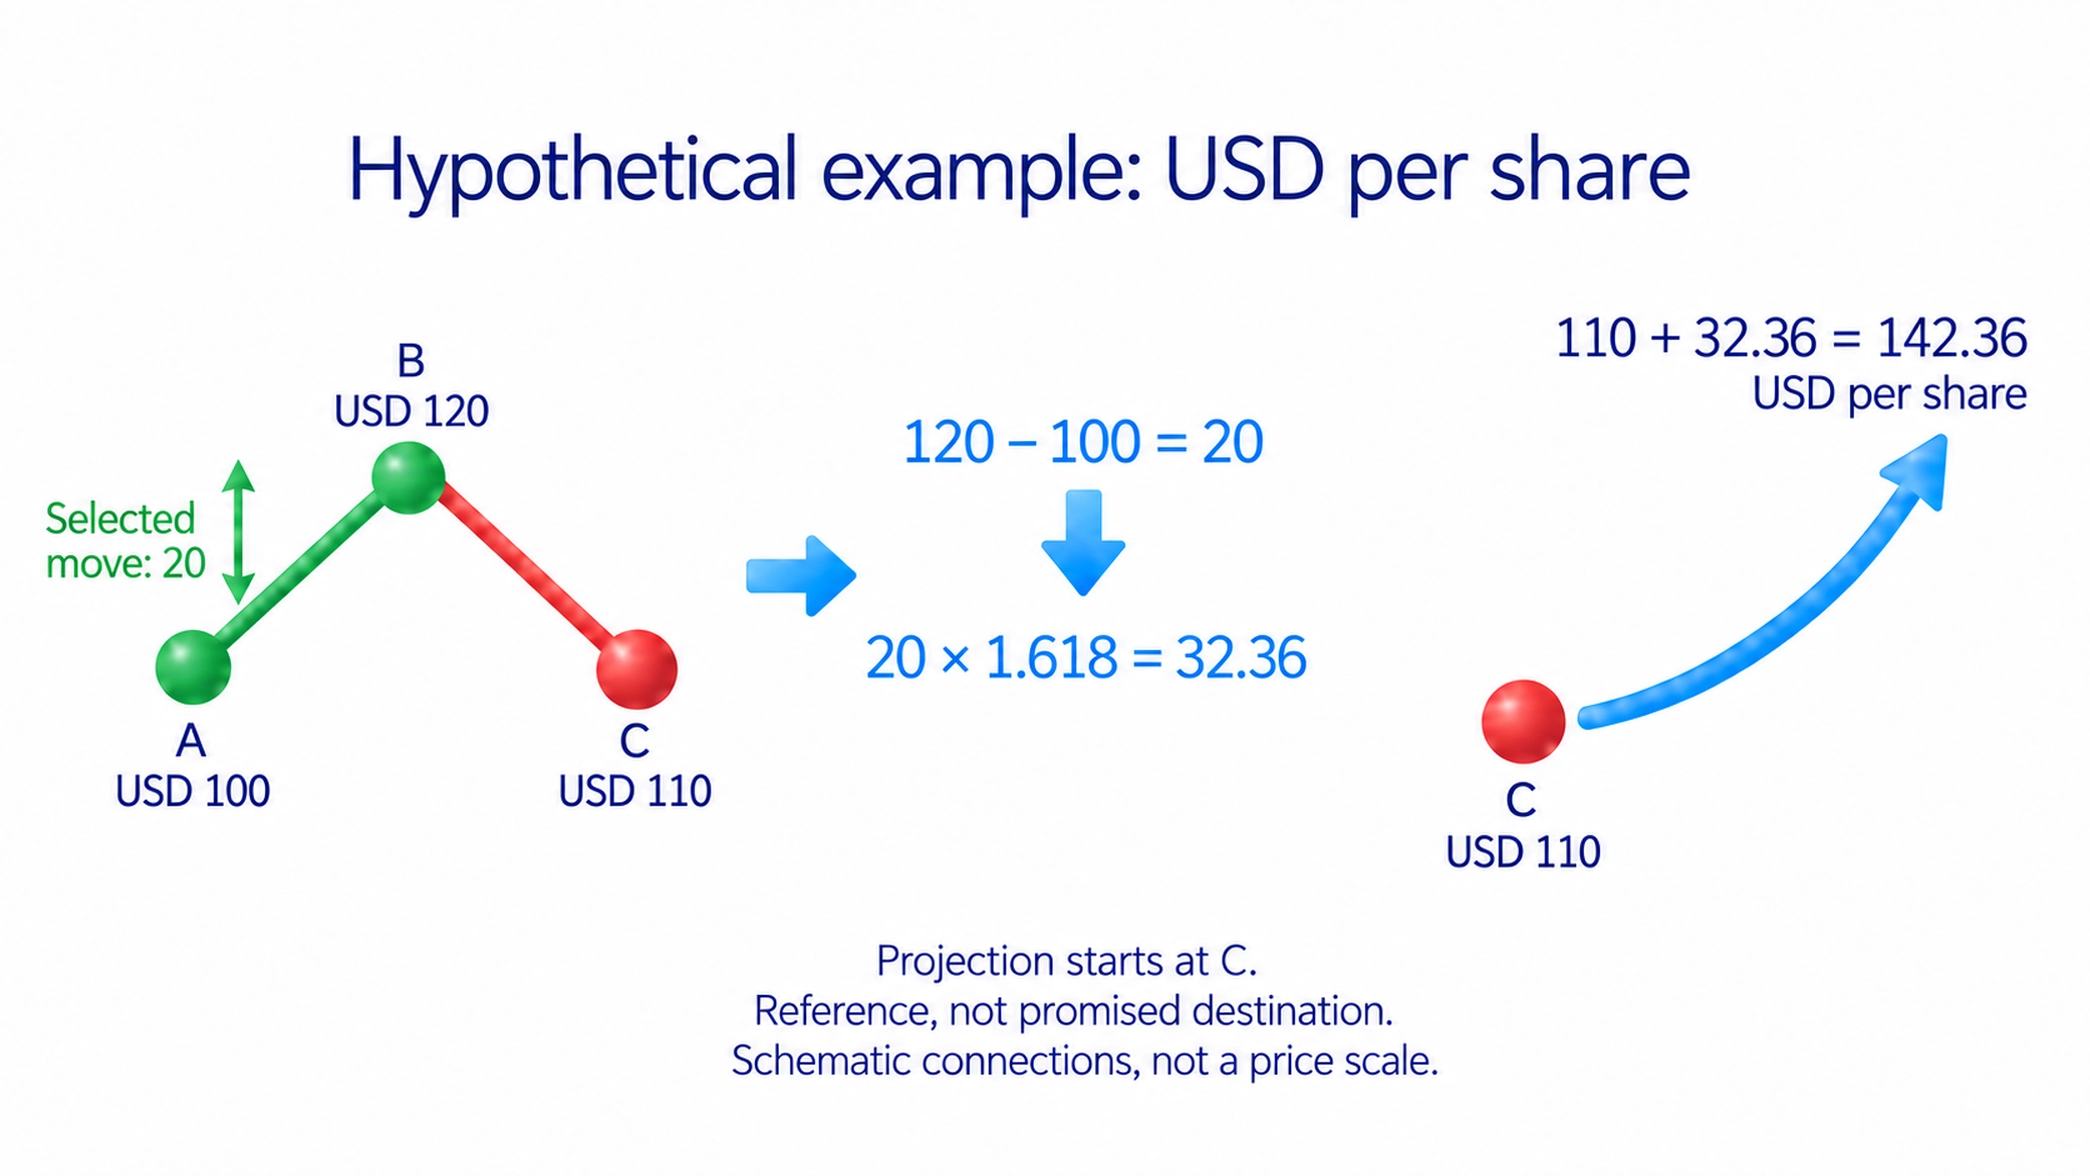
A projection is a reference, not a promised destination. A multiplier below one, or a different position for C, can leave the projected level inside the old range. Check all three prices, the direction and the calculation method before using it. The depth of a pullback and the projected length of another move are different measurements.
Why price crosses Fibonacci levels
The drawing comes from past prices. Future price depends on arriving orders and their execution. Opposing buying or selling can appear near a mark, but the formula does not measure how much is available there. Popularity does not prove that orders placed at a Fibonacci ratio caused a particular reversal.
When a calculated mark overlaps a previous support area, two references occupy the same area. That does not let you multiply a probability of success: both may come from the same price movement. A touch also does not identify a participant or prove that someone intended to trigger other traders’ stops.
On a historical chart, it is easy to choose endpoints that pass through a reversal already visible. Save the drawing before the outcome, then retain every qualifying approach, including prices that pass through without stopping. Moving the points after each failure conceals cases the rule did not explain.
Elliott wave analysis uses proportions within a separate set of pattern rules. Adding a wave label to a Fibonacci drawing does not make the selected endpoints a proven forecast. Use the Elliott-wave guide for that separate method rather than treating its terminology as additional evidence for this drawing.
Chart intervals and other Fibonacci tools
A chart interval specifies the period covered by a candle. Hourly and daily charts can lead you to select different movements, so their retracement prices need not match. A longer interval describes a longer section of history; it does not establish that every mark on it is stronger. Decide which movement and trading horizon the drawing is meant to describe.
An automatic retracement chooses its points using the platform’s rules. TradingView’s Depth and Deviation settings affect that selection. The latest point can change while the movement develops. A completed historical drawing must not be treated as if all of its final coordinates were available earlier.
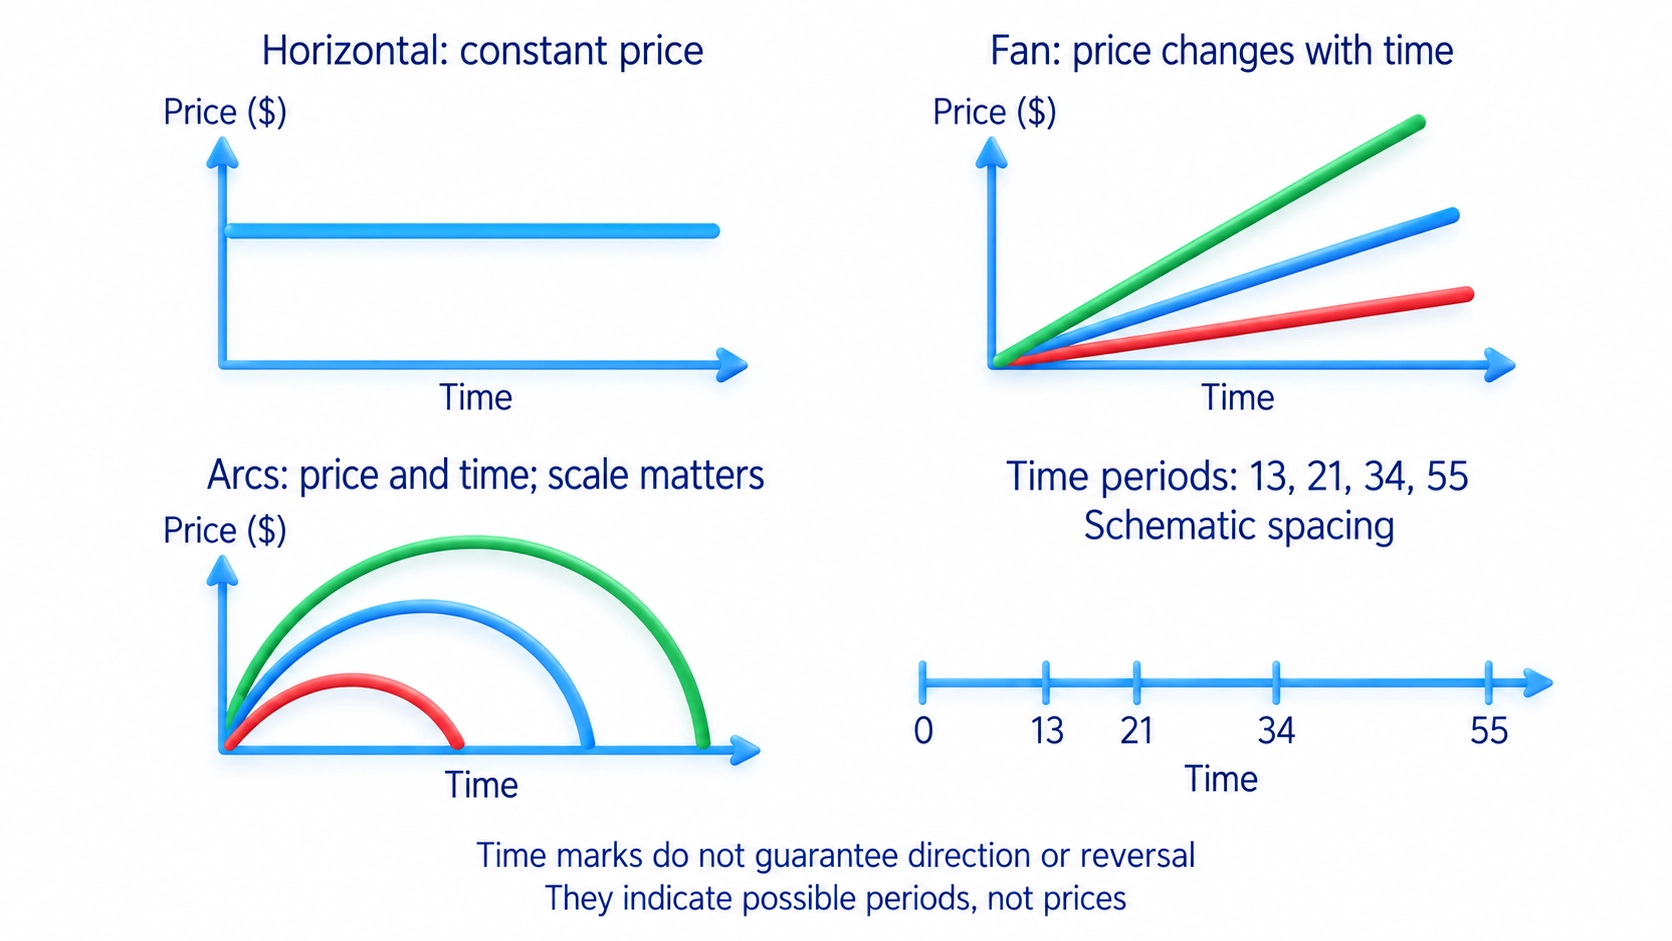
Fibonacci fans draw sloping rays through retracement points, so their price changes with time. Arcs use fractions of a baseline connecting price and time; their appearance depends on the chart’s scale. Neither is interchangeable with a constant horizontal retracement price. Identify which drawing you are using before reading its intersections.
Fibonacci time zones mark intervals based on the sequence, such as 13, 21, 34 or 55 periods from a selected start or base interval. They mark time rather than price. They do not determine the next movement’s direction or guarantee a reversal on a marked date. Check their time coordinates separately from a price retracement.
Using the drawing with price and volume
In my course’s section on working with levels, I examine a large rising bar followed by smaller price ranges and a break below local supports. The sequence compares trading activity with the progress of price. The chart shows price and volume; the explanation of large participants’ actions belongs to the interpretation used in my method.
That is a price-reaction example, not a compulsory Fibonacci entry rule. For an additional retracement drawing, choose the move and calculate the reference area, then observe whether price stops, returns after crossing it or continues through. Trading volume, the quantity traded in the selected data source, must be read with the price response. A large quantity alone does not confirm a reversal.
The optional video on drawing price levels explains price references built from earlier turns; it does not provide a separate trading strategy based on Fibonacci ratios. The written calculation and endpoint checks above can be followed without watching the video.
Before testing, record the endpoints, scale, ratios and time when the drawing was fixed. Set the entry condition and the condition that cancels the idea separately. If price crosses the mark without the required reaction, that case did not meet your rule. Do not move the drawing merely to preserve the expected result. Evaluate a predefined rule rather than attractive historical coincidences.
Frequently asked questions
They mark fractions of one selected move. A 61.8% retracement gives back that fraction of the move’s size, not necessarily 61.8% of the asset’s value. It is a price reference, not a guaranteed turning point.
There is no universally best level. The 38.2%, 50% and 61.8% marks describe different pullback depths; 50% is the midpoint, not a Fibonacci sequence ratio. Test a level with a specified price condition rather than ranking it by its label alone.
Choose the start and end of one movement: low to high for a rise, high to low for a fall. Check the endpoint prices, label direction and calculation method. Keep the chosen points recorded before the outcome instead of moving them to match a later turn.
The drawing does not supply a complete trade plan. It marks prices to observe; entry, exit and cancellation conditions need separate rules. Touching a line is not evidence that a reversal has occurred.
Opposing buying or selling may appear near a calculated price. The ratio does not measure it, and a turn near the line does not establish the cause. Include reactions and uninterrupted crossings when testing a predefined condition.
About the author
Igor Arapov, practising trader since 2013 and author of the ArapovTrade library. ORCID: 0009-0003-0430-778X.




