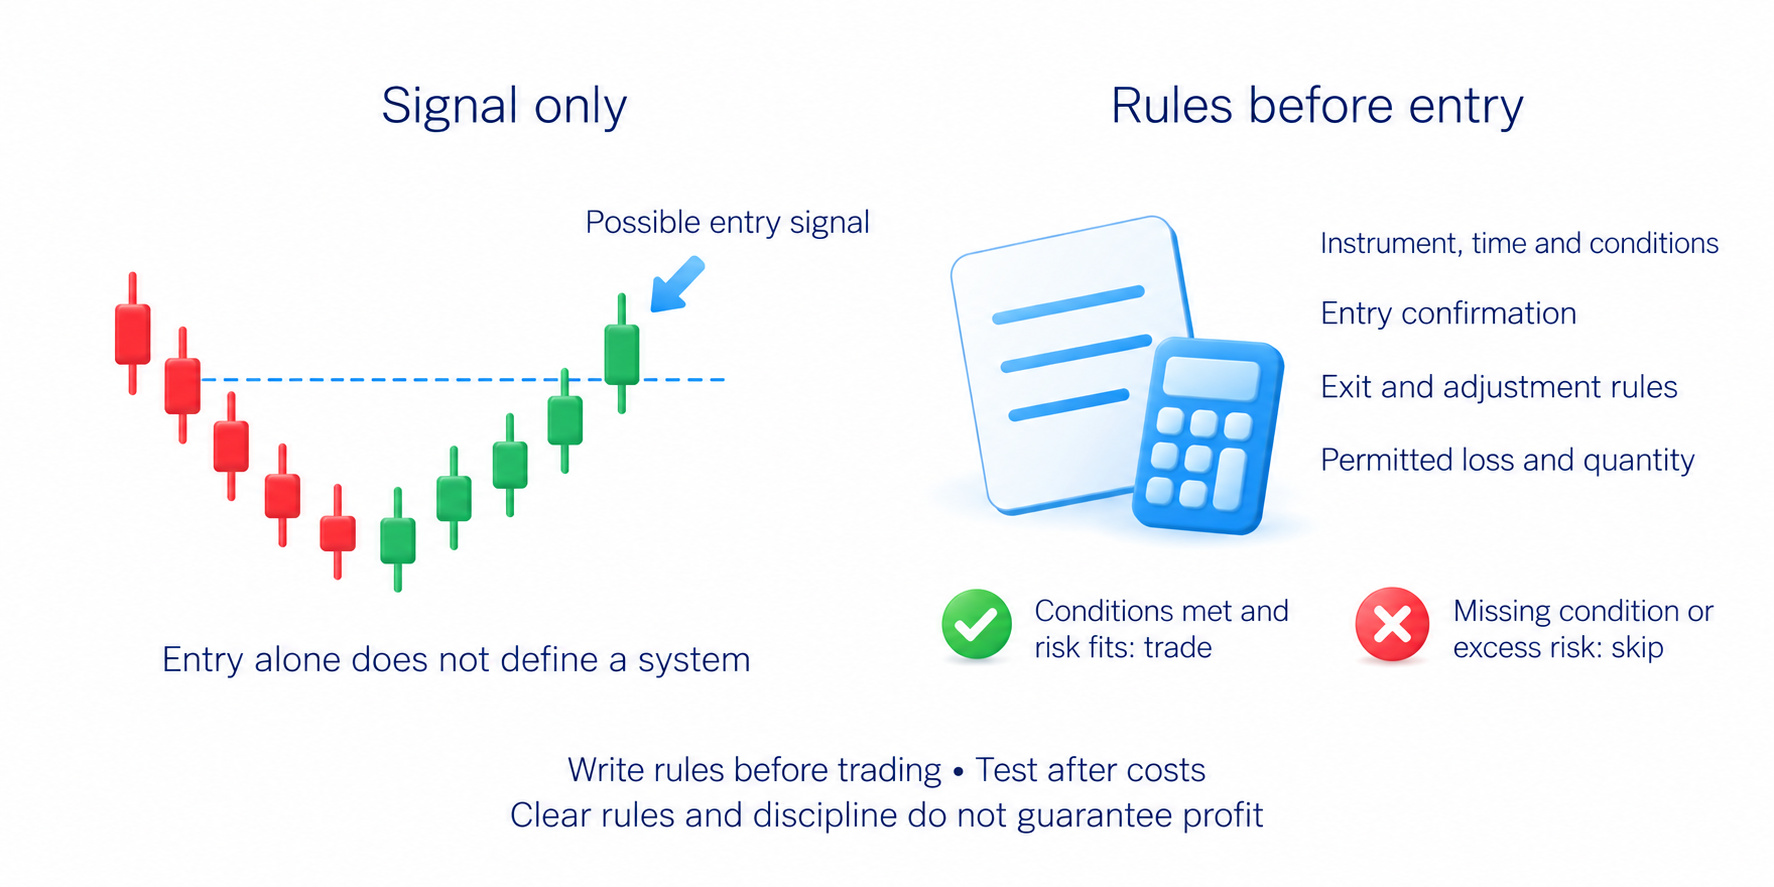
A trading system is a set of rules written before trading: when to enter, how to exit and how much to risk. It lets you repeat a method and examine its results. An entry signal alone is not a system. A price breaking a level does not tell you how much to buy, when to leave or when to skip the trade.
This guide explains how to turn a method into usable rules, test them on historical and new data, and distinguish a weakness in the method from a failure to follow it. If the mechanics of trading are new to you, begin with the beginner's trading guide.
What should a trading system include?
A system answers four questions: under what conditions should you trade, what permits entry, how should you exit and how much can you lose? The answers must be available before a trade. “I buy when the market looks strong” leaves the decision open to your mood.
- Trading conditions: the instrument, trading hours, chart interval and market conditions the method is designed for. A trend-following method does not necessarily suit a sideways market.
- Entry condition: the event you need to observe and the confirmation required. Write down what must happen before an entry is allowed.
- Exit rules: what invalidates the reason for entry, where the protective stop, an instruction for leaving if price moves against the trade, belongs and how you take profit. Changes to an open position also need a specified condition.
- Risk limits and reasons to skip: the permitted loss, position size (the quantity to trade) and restrictions on simultaneous trades. No valid entry or too much risk means no trade.
Check how the instructions will work on your platform. Different order types provide different control over price and execution. A stop does not guarantee a fill at its trigger price. Execution and costs therefore affect the results of the system.
Risk is part of the method, not something to add after a profitable run. The risk-management guide explains the size calculation. Here, the task is to write the limit beforehand and apply it consistently to the trades being tested.
Mechanical and discretionary systems
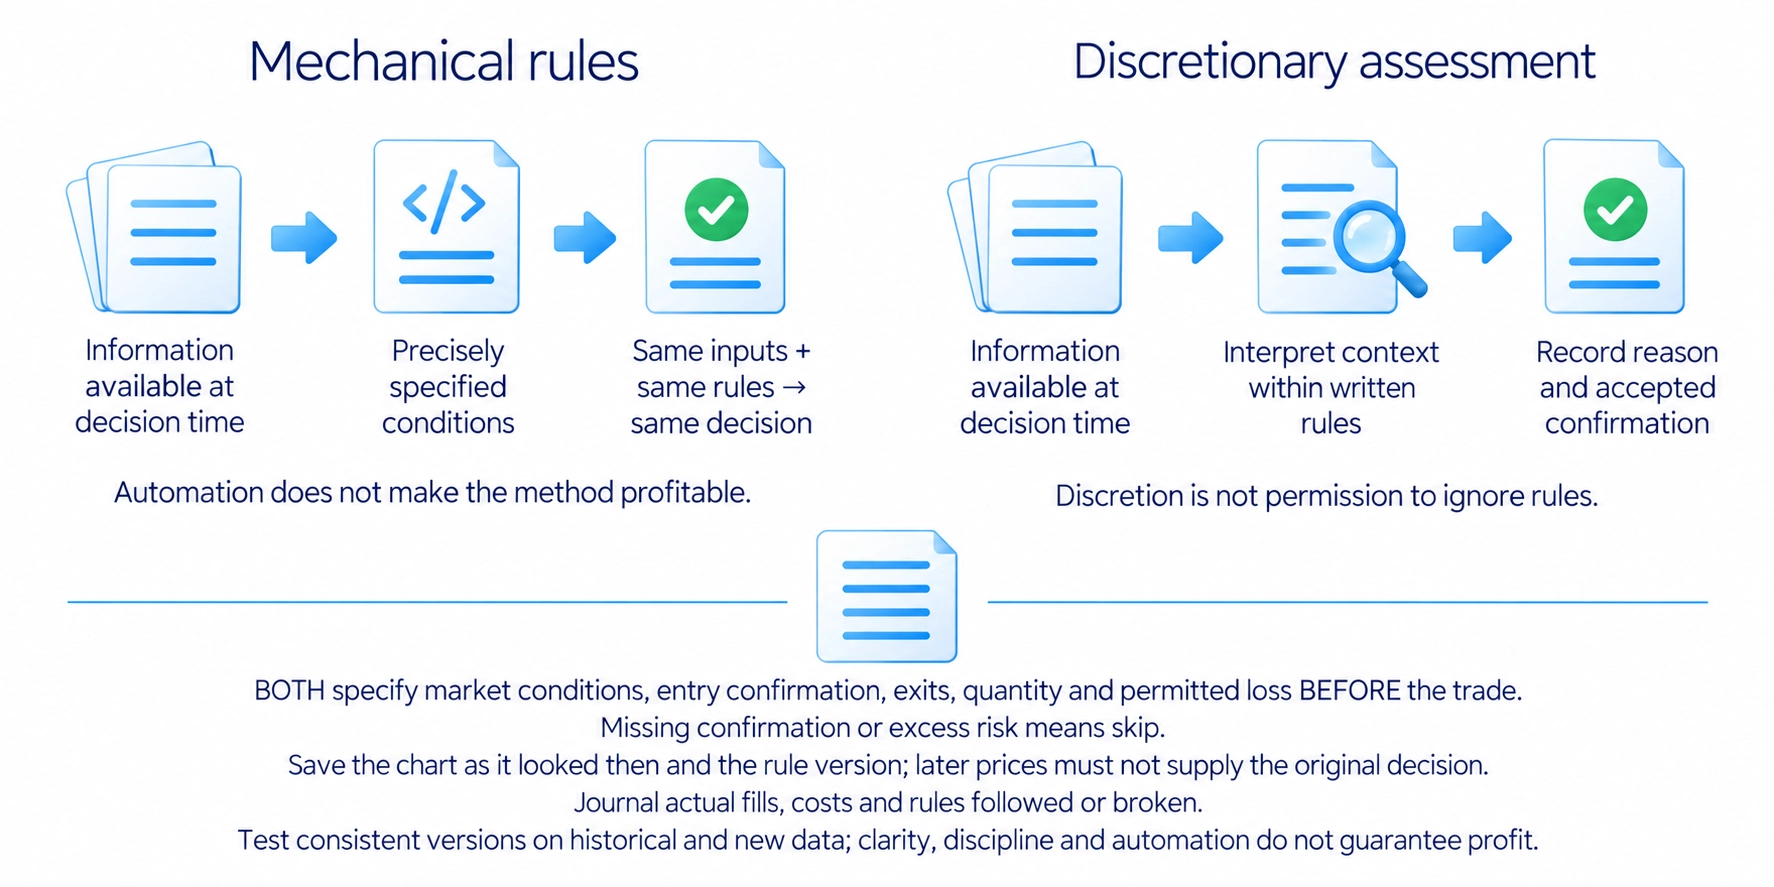
A mechanical system specifies conditions precisely enough for the same inputs to produce the same decision. A program can test such rules and, with a suitable implementation, execute them. Automation does not make the method profitable.
In a discretionary system, a person interprets some of the chart information. Rules still apply: what to look for, what confirmation to accept and when not to enter. The difference concerns how the situation is assessed, rather than whether rules are followed.
In my course, I assess price, trading volume (the quantity traded in the selected data source) and the sequence of market events. To test this kind of approach, save the chart as it looked before entry and record the reason for the decision. Otherwise, once the later move is visible, a signal can seem obvious even though it was not complete at the time.
How a trading plan applies the system
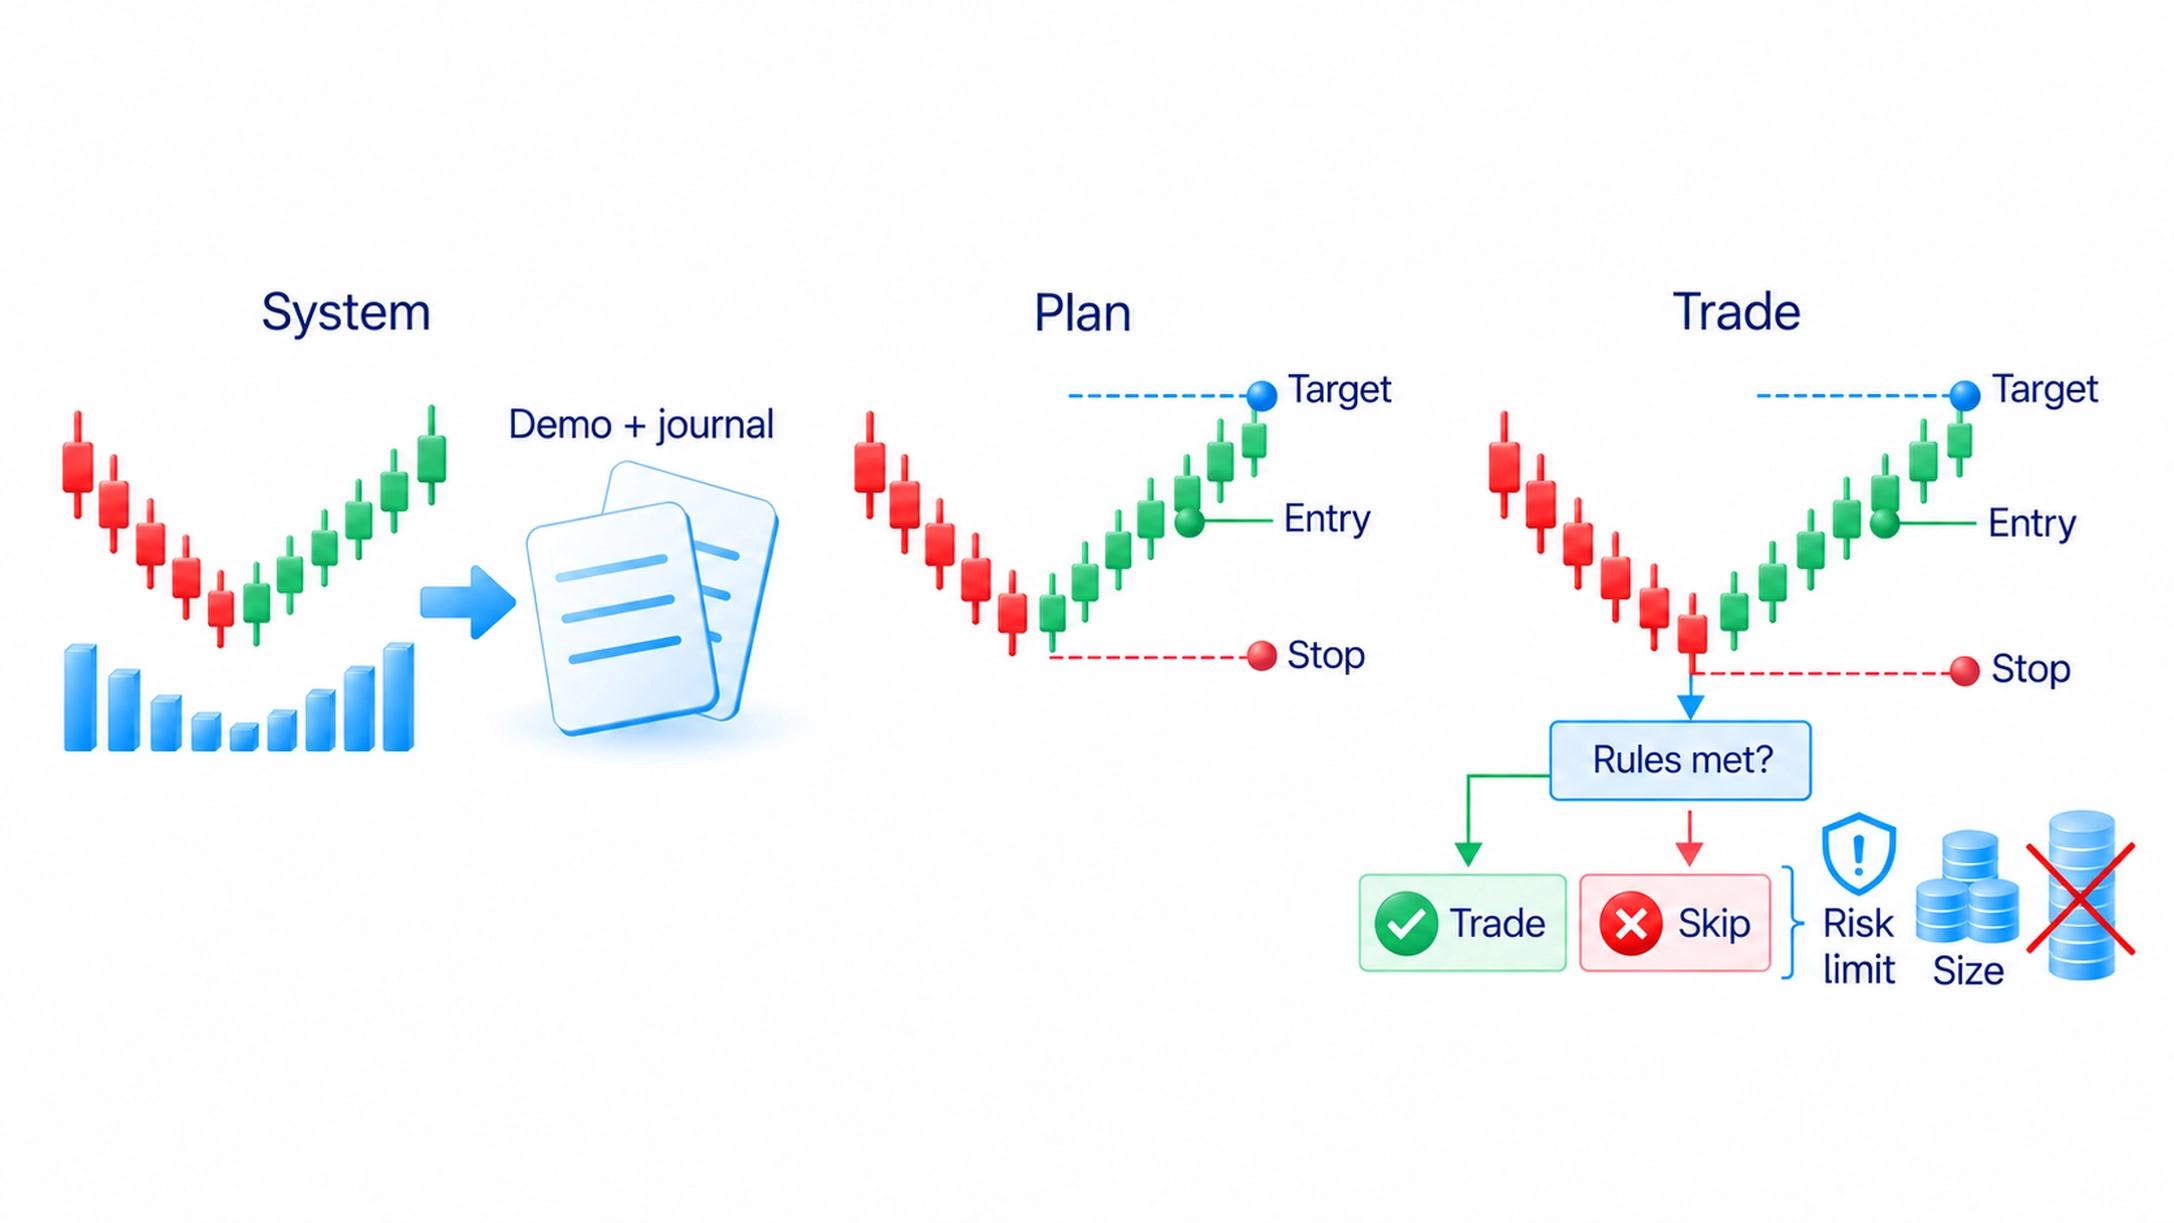
The system describes a repeatable method. A trading plan specifies how you will use it: the chosen instruments and hours, permitted trades and conditions for stopping work. The plan for an individual trade records actual entry, stop and target prices, quantity and the reason for entry.
Some parts of the system and plan overlap. Consistency matters more than the name of the document. If the system prohibits increasing risk after entry, an individual trade plan cannot override that rule because a signal seems particularly strong.
Record management conditions too: what permits a stop adjustment, a partial exit or closing before the target. If a decision was not planned, record it as a change rather than pretending it was part of the original method. The trade-management guide explains the available exit controls.
A plan should help you make decisions, rather than contain everything you know about markets. Keep the conditions that change an action: enter, skip, adjust or close. The trading-psychology guide explains emotional reasons for breaking rules. For evaluating the system, first identify and record which rules were followed.
How the course turns observations into a trade
My approach uses price and trading volume. Richard Wyckoff's method provides a way to interpret the movement; the trading system turns observations into a sequence of decisions. High volume alone is not permission to trade.
In the course's buying examples, the decline first stops and a range forms, with price moving between marked upper and lower boundaries. Price then breaks above the upper boundary. I wait for a pullback that holds above the broken area and forms a higher low.
A higher low means the pullback stops above the previous low. I then check for renewed upward movement and the accompanying volume. These are successive conditions, not alternative reasons to buy on a single sign. The selling example reverses the sequence.
If a required confirmation is missing, this model has not provided an entry. After confirmation, the protective exit, target and permitted quantity must still be checked. Confidence in interpreting the chart does not override the risk limit.
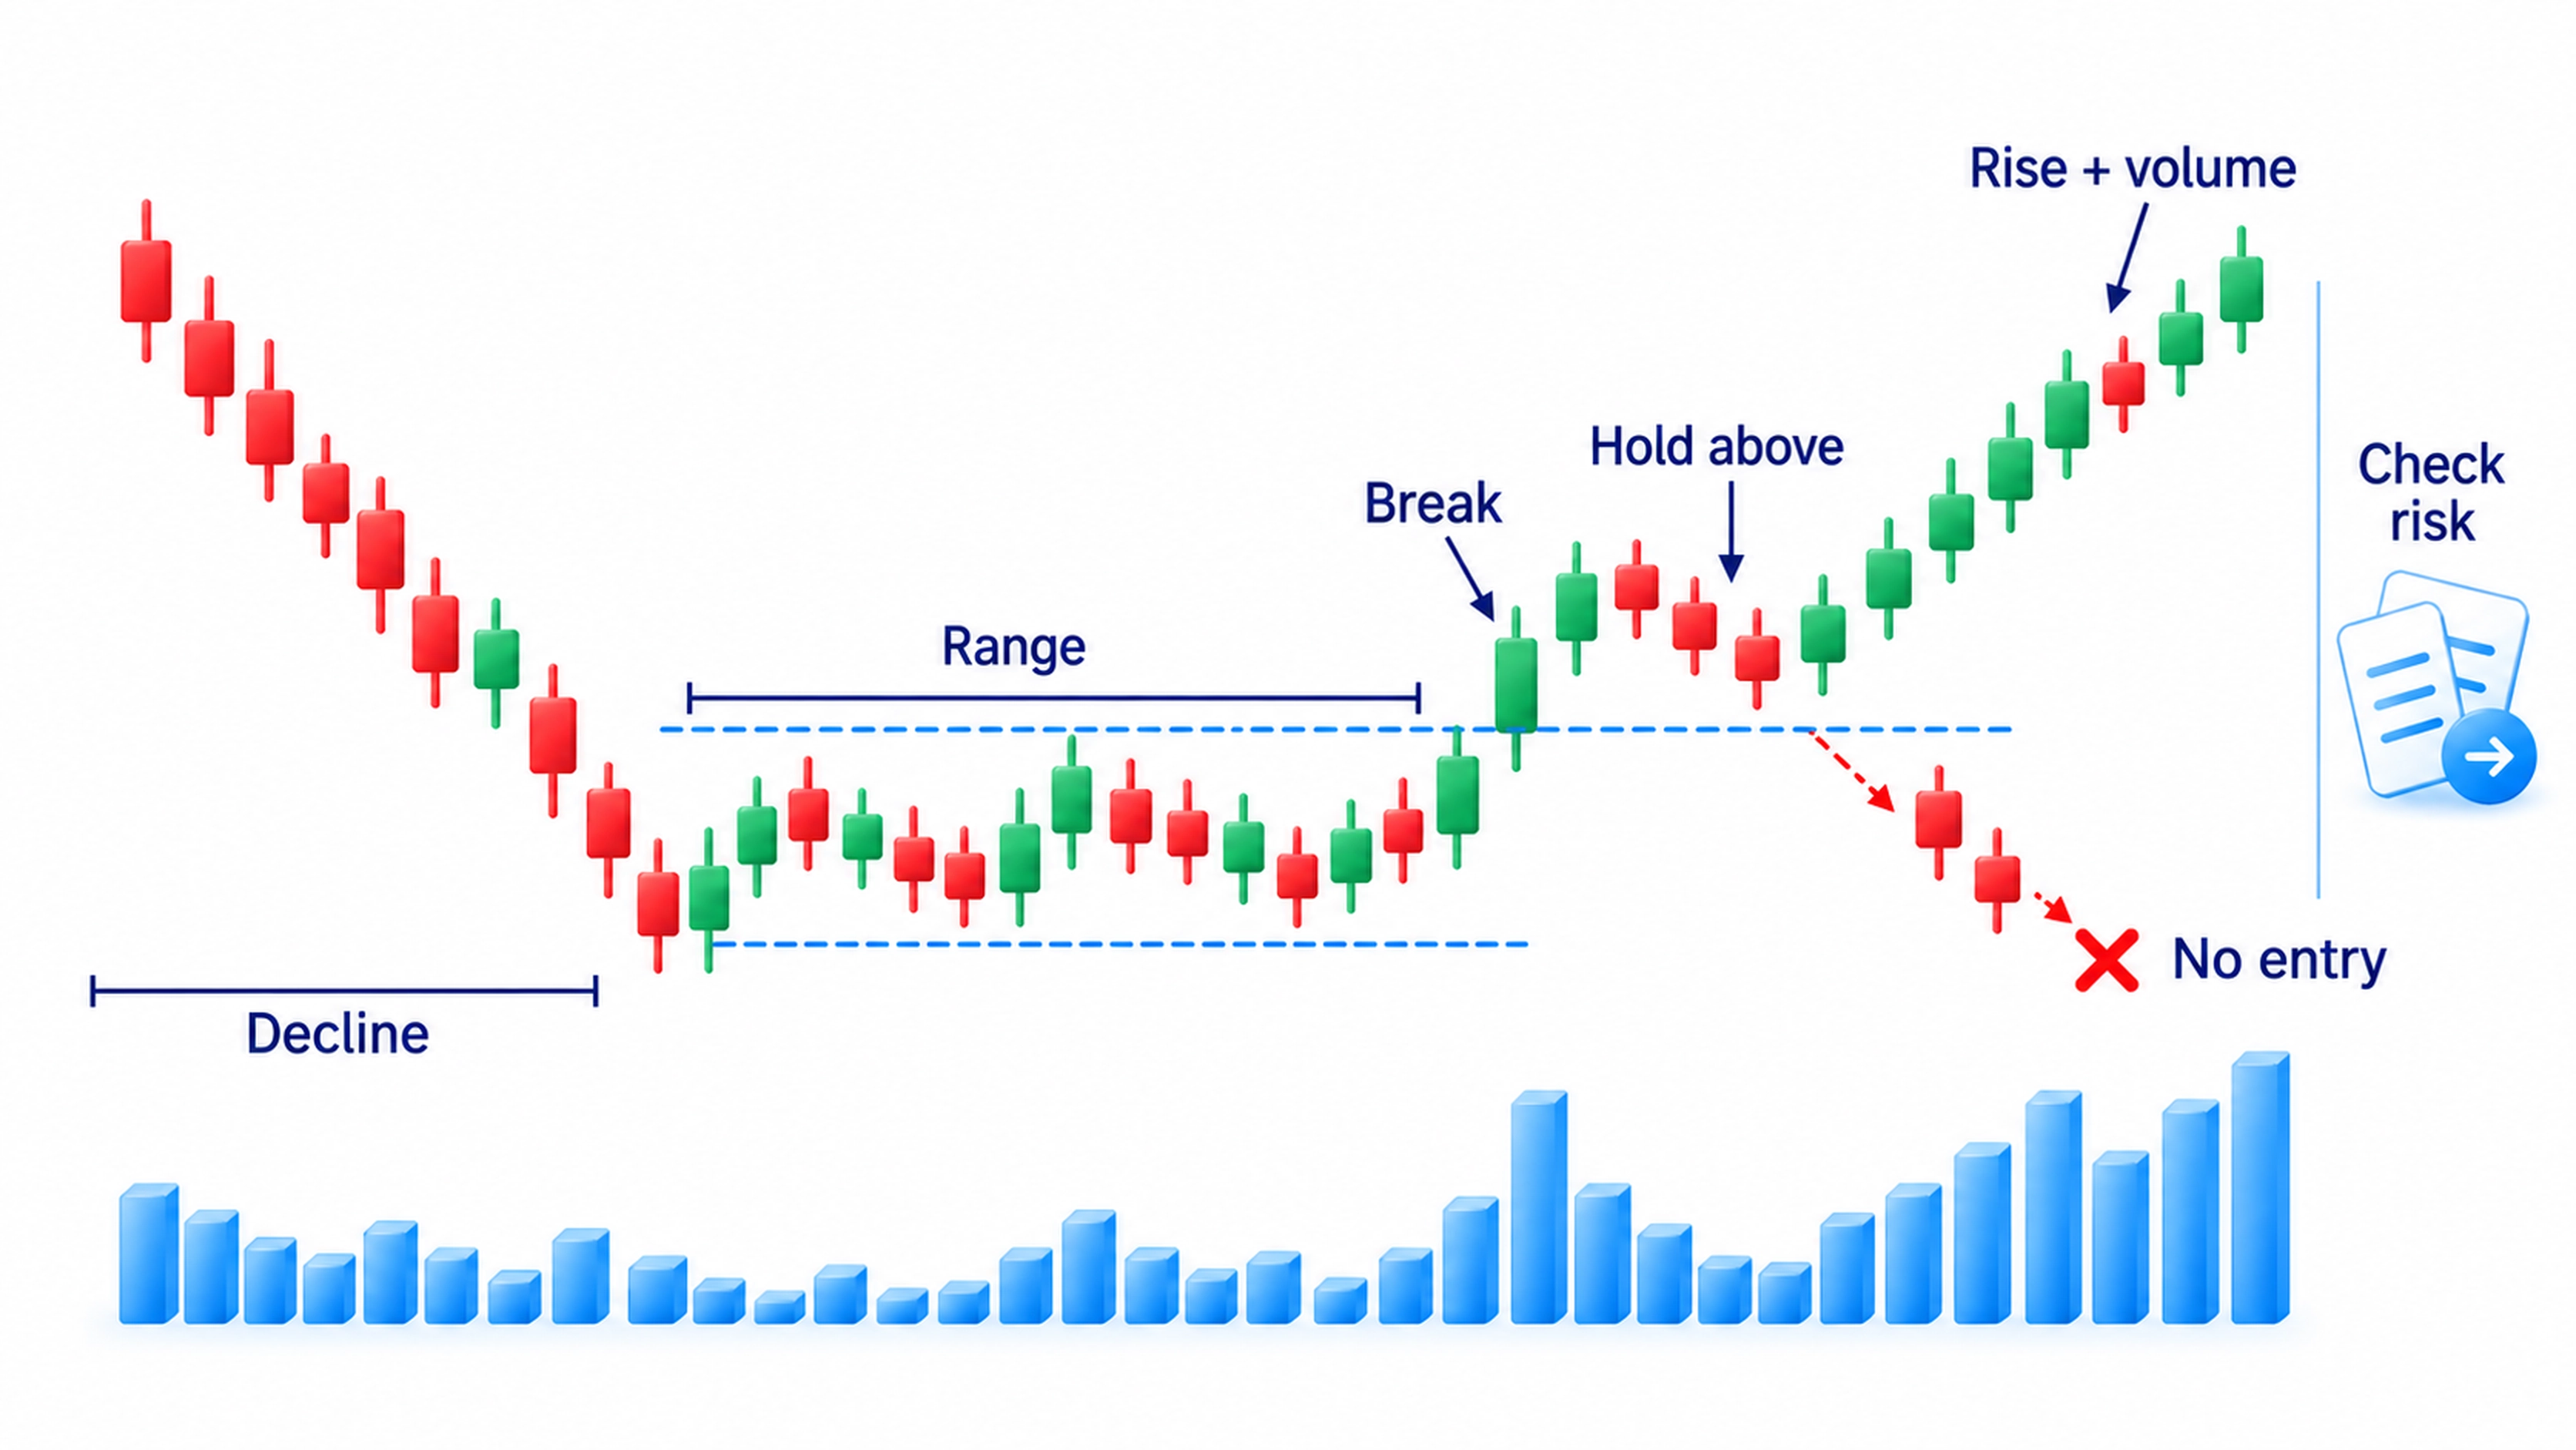
The trading-system section of the course shows the sequence on euro and Japanese-yen futures charts, with examples of changes in both directions. These selected charts connect the rule to a particular situation; they do not prove future profitability. The optional discussion of trading-system rules adds the author's explanation of why decisions need a plan.
Backtesting: checking rules on historical data
A backtest estimates what the written rules would have produced on past data. It helps reveal weaknesses before real money is exposed. A positive historical result is a reason to investigate further, not a guarantee of future income.
For a manual test, advance the chart one candle at a time and decide using only information available then. A candle records the prices within one chart interval. Save every qualifying signal, including losing trades, and the reasons for skipped entries. Selecting only periods where the later result looks good distorts the test.
For an automated test, the program applies the conditions you have coded. Check that those conditions represent your method. A human assessment of context cannot silently be replaced with an unrelated formula. Also check which prices the program uses for simulated fills.
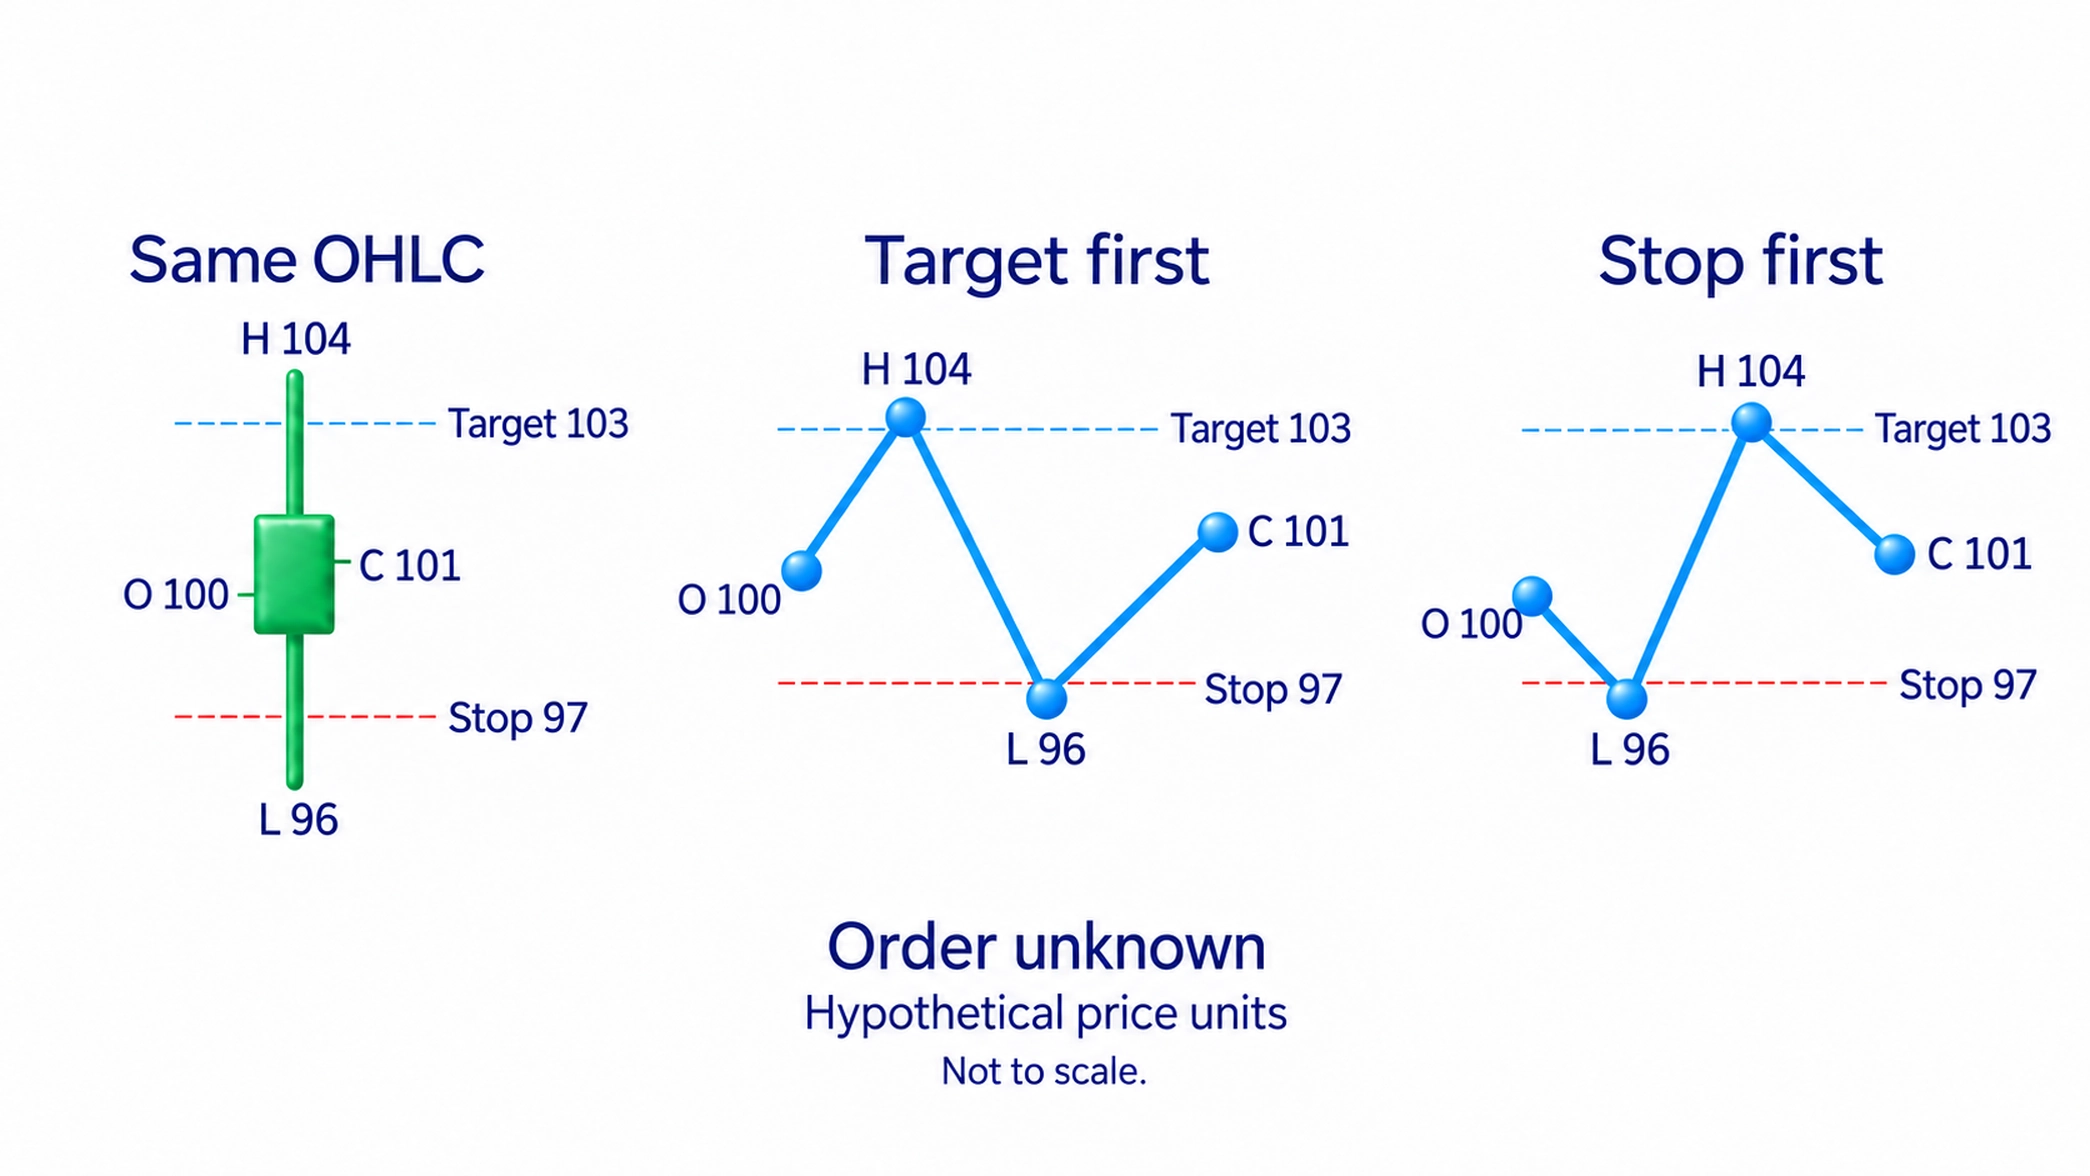
Using future information is a serious error. The day's eventual low is not known in the morning. If one historical candle contains both the stop and target prices, the candle alone may not show which was reached first. Use more detailed data or record an explicit assumption. Do not count the more favourable outcome as an established fact.
Include commissions, the bid–ask spread and slippage. The spread is the gap between the available buying and selling quotes; slippage is the difference between an expected and an actual fill. If the fill prices already include the spread, do not subtract it again. For positions held overnight, include applicable financing or holding charges.
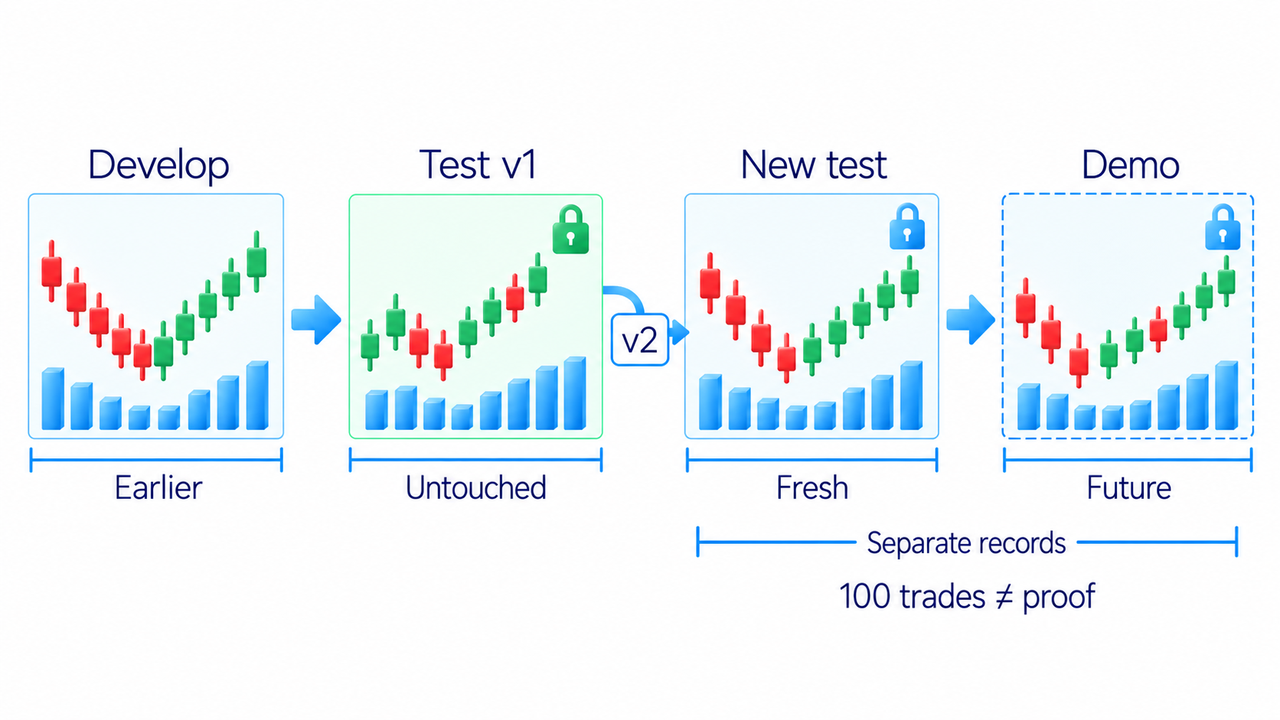
Overfitting means repeatedly adjusting rules to improve a result already seen. Reserve an earlier period for development and a later period for testing without adjustments. Once you change the rules after seeing the later results, that period is no longer an independent test of those changes.
Compare different market conditions. A method may suit only certain kinds of movement, and that restriction should be recorded. But you must be able to recognise the condition before entry. Explaining every loss afterwards as “the wrong market” makes the rules impossible to test fairly.
Forward testing: apply the rules to new events
A forward test applies a fixed version of the rules as new events occur. Starting on a demo account using virtual money lets you record decisions as signals appear. This checks whether you can recognise entries in time, follow the plan and repeat the method without knowing the future.
My course uses an initial series of at least 100 demo trades as a learning task. The purpose is to build a set of records for review. It is not a universal number that proves profitability. Even a positive series can reflect chance or only one set of market conditions.
Do not alter the rules after every loss within the chosen series. If you find a significant error and change the method, label the new version and collect its results separately. Mixing different versions hides how each actually performed.
A demo account tests the application of rules, but it does not fully reproduce live execution or the reaction to losing your own money. Moving to real trading requires a separate decision about affordable risk. Completing a demo series does not itself make that step safe.
What to record in a trading journal
A trading journal connects a rule with the trade actually taken. Without the entry reason, you cannot distinguish the method's results from unrelated decisions. Start the record before opening the position and finish it after closing.
- Date, time, instrument, direction and version of the rules.
- The chart before entry and the exact condition permitting the trade.
- Planned entry, stop, target, quantity and money at risk.
- Actual fills, costs, result and changes to the position.
- Rules followed or broken, and any emotional state that affected the decision.
Keep impulsive trades in the record. Mark them as outside the system and calculate their effect on the account separately. This lets you assess both the chosen method and whether you followed it.
Review the journal weekly or after a series selected in advance. Look for recurring errors; reviewing a small group does not mean the strategy needs to be rebuilt after every group. Evaluating the method requires a comparable set of trades under the same version of the rules.
How to evaluate results and decide what to change
Calculate the total result after costs, the average result per trade and the largest fall in account value from an earlier peak. That peak-to-trough fall is called drawdown. Also check losing streaks and whether one unusual trade provided most of the positive total.
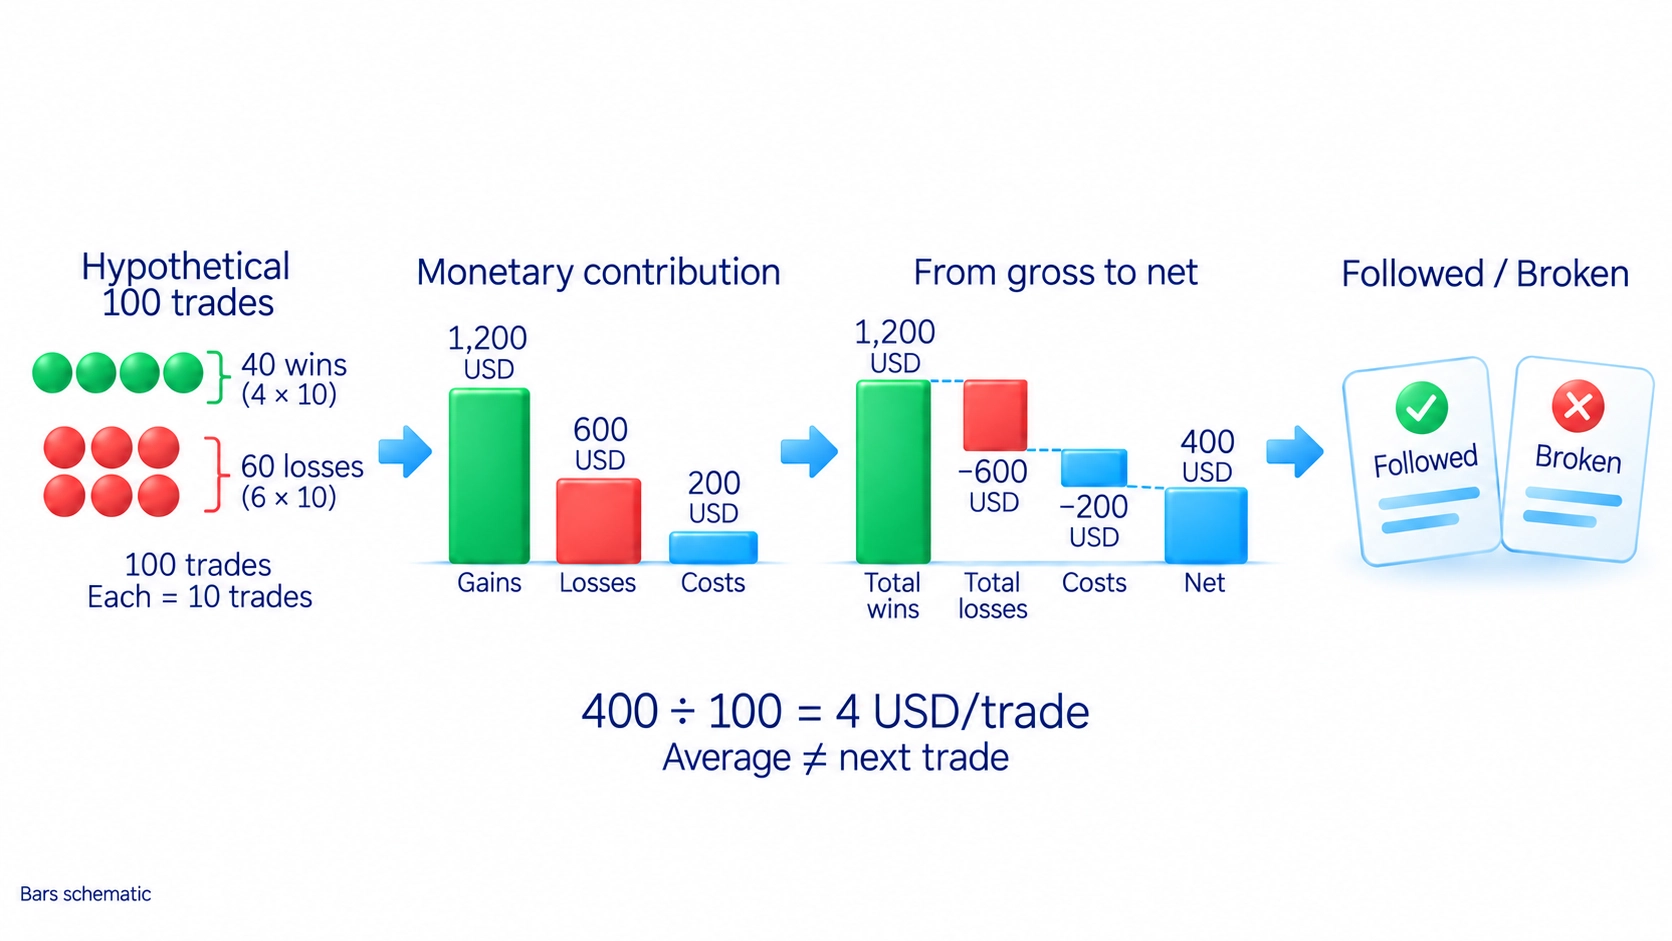
The average result is the net total divided by the number of trades. In one hypothetical series, 40 winning trades average $30 each and 60 losing trades average a $10 loss. Before costs, the total is 40 × $30 − 60 × $10 = $600. With total costs of $200, the net result is $400. Across 100 trades, that is $400 ÷ 100 = $4 per trade.
The example shows why the winning percentage alone is insufficient: gain sizes, loss sizes and costs also matter. The $4 describes this hypothetical series. It is not the expected result of the next trade or proof of a future average.
Then compare trades that followed the rules with those that broke them. If losses mainly came from larger-than-planned quantities, missing stops or early exits, address execution of the rules first. If the rules were followed but the result is negative, examine the method, its costs and the conditions in which it was used.
Before making a change, state one testable reason. For example, entry might be permitted before the model's confirmation is complete. Correct that condition and test the new version on data not used to make the adjustment. Do not add a filter solely because it removes a few losing trades whose outcomes you already know.
For me, being able to follow the rules consistently matters when choosing a system. Simplicity still needs testing: a clear method executed with discipline can lose money. The useful learning result is being able to name the entry conditions, repeat the decision and explain the outcome from records, rather than from how the last trade felt.
Frequently asked questions
It is a set of rules written in advance: when to enter, how to exit and how much to risk. It lets you repeat a method and test its results. Having rules does not guarantee a profit.
The system describes a repeatable method. The plan specifies its use: instruments, hours, limits and actions. An individual trade plan records entry, the planned loss exit, the planned profit exit, quantity and the reason for the decision. Both documents account for risk.
Test the rules on historical data with costs, on a separate period without readjustment, and on newly arriving data, for example in a demo account using virtual money. Record each entry reason and any broken rules. The course's initial 100 demo trades are a learning task, not proof of profitability.
In a historical test, it means adjusting rules to improve outcomes already known, without establishing that they will work on new data. Keep a separate test period. If its results lead to further changes, those changes need a new independent test.
It connects the rules with actual actions. Record the entry reason, planned and actual trade details, costs, result and any rule violations. This helps distinguish a weakness in the method from an error in applying it.
Look for understandable conditions suited to the chosen market and results checked after costs. In my approach, the rules must also be practical to follow consistently. Complexity or simplicity alone does not prove an advantage.
About the author
Igor Arapov, a practising trader since 2013 and the author of the ArapovTrade library. ORCID: 0009-0003-0430-778X.




