Bollinger Bands are three lines that show a recent average price and the spread of prices around it. Wider bands mean greater variation in the selected data; narrower bands mean less. They help you compare expansion and contraction, but touching an outer line is not an instruction to buy or sell.
How Bollinger Bands are calculated
John Bollinger developed the indicator in the early 1980s. In its classic form, the middle line is a simple moving average, or SMA: the sum of the selected prices divided by their number. The usual source is the closing price, with a length of 20 bars. A bar represents one chart period, such as an hour or a day.
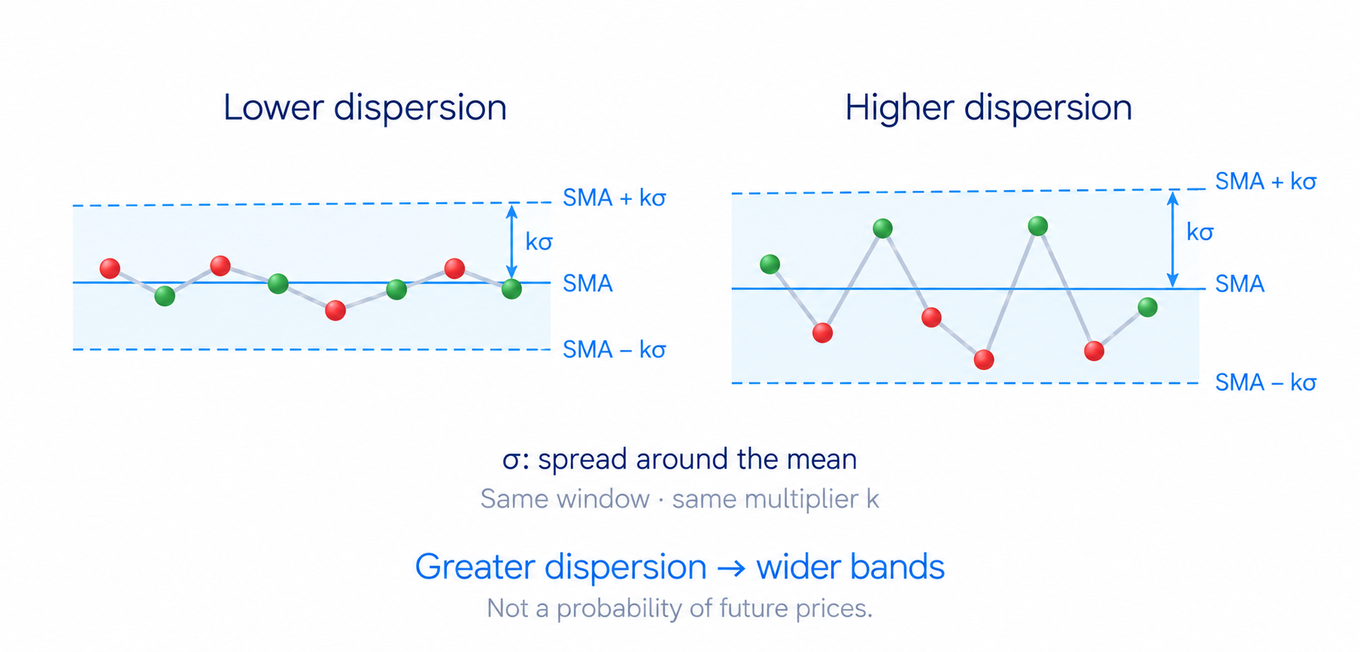
The outer lines sit a specified number of standard deviations above and below that average. Standard deviation measures how widely the selected prices are spread around their mean. Greater differences from the mean produce a larger value and a wider distance between the bands.
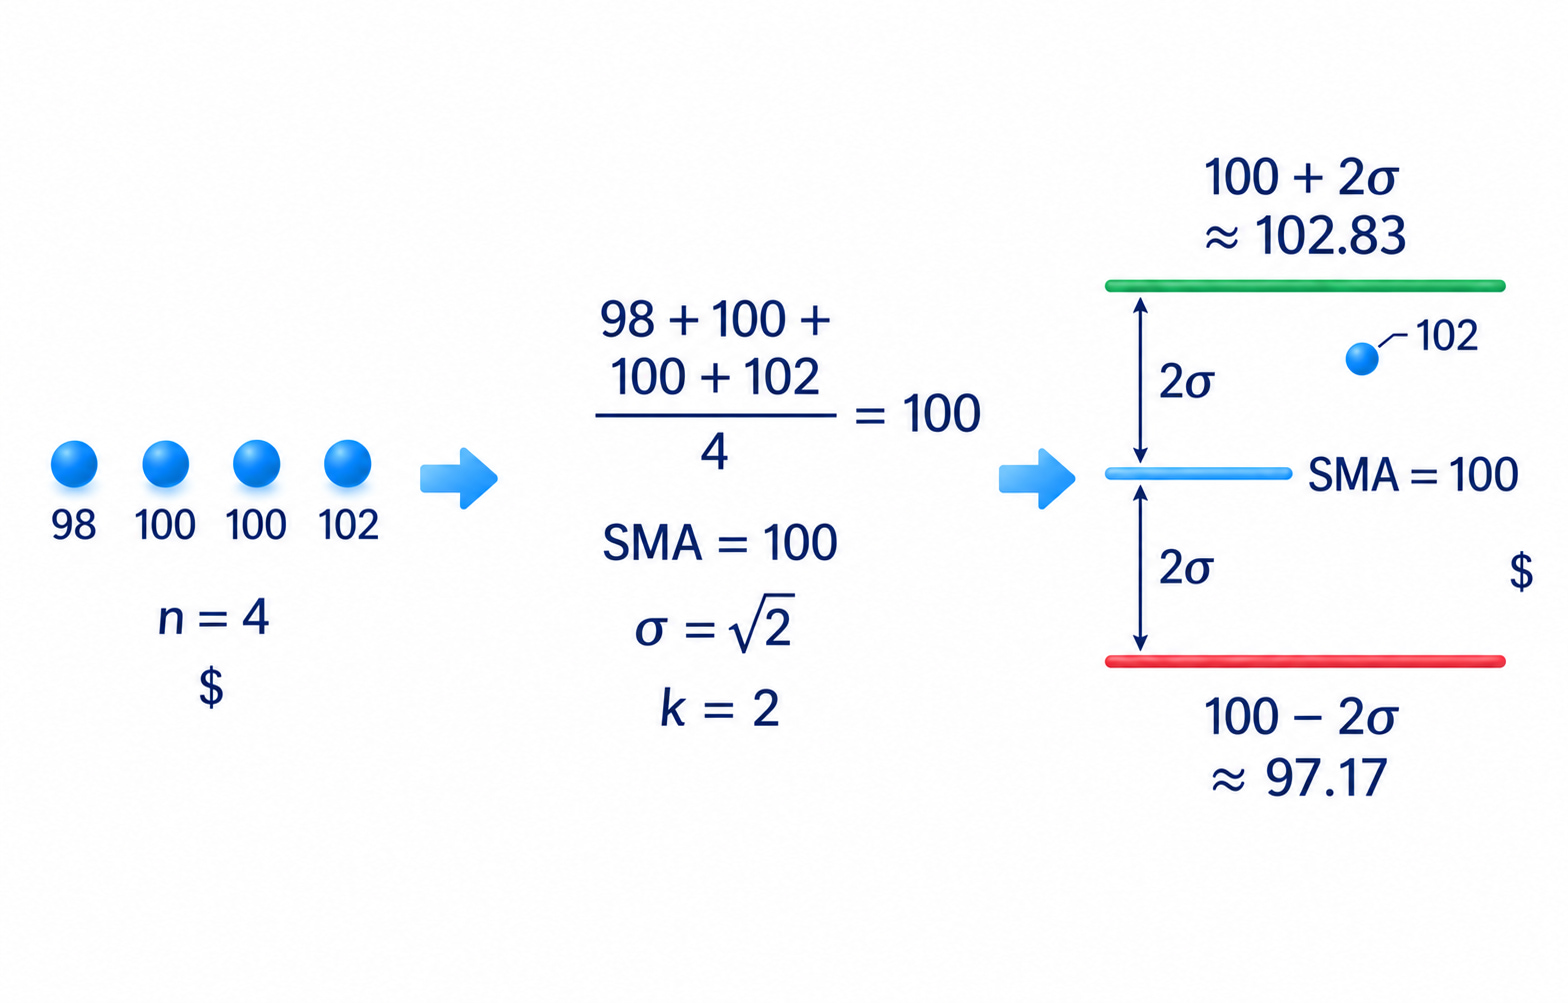
For the classic calculation, find the mean first. Subtract it from each price, square each difference, add the squares and divide by the number of prices. The square root of that result is the standard deviation. The average and deviation use the same window of data.
The upper band equals the average plus standard deviation multiplied by the chosen factor. The lower band subtracts the same amount. The familiar settings 20 and 2 mean 20 bars and two standard deviations. They are defaults, not the best settings for every market or task.
Bollinger Bands calculation example
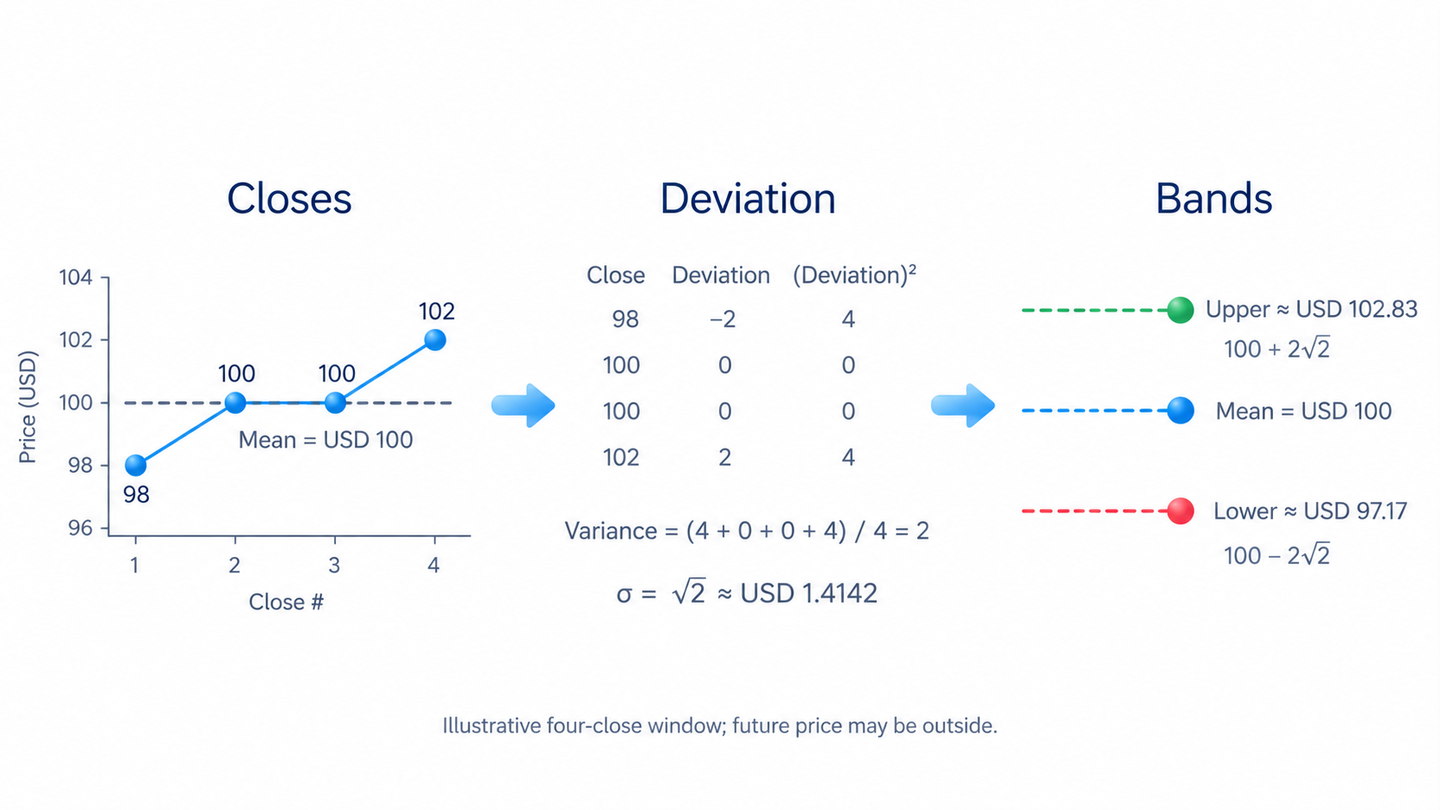
Take an illustrative share with four consecutive closes in US dollars: 98, 100, 100 and 102. The short window keeps the arithmetic easy to follow. The mean is USD 100. Squared differences are 4, 0, 0 and 4; their average is 2, so standard deviation is √2, about USD 1.4142.
With a factor of 2, the upper band is 100 + 2 × √2, about USD 102.83, and the lower band is 100 − 2 × √2, about USD 97.17. These are values calculated from the given closes. The next bar is not required to stay between them, and being near the upper line does not establish that the share is overpriced.
Two standard deviations do not promise that 95% of future prices will remain inside the bands. Market prices need not follow the statistical model behind that assumption. Bollinger explicitly warns against making statistical assumptions from the bands: the multiplier sets a distance, not a probability of the next outcome.
Setting up the indicator
The length counts bars. Twenty daily closes and twenty hourly closes form different sequences. Compare band widths only when you understand their settings and time basis. The chart-reading guide explains the price fields and chart periods behind this comparison.
Check the price source, average type and deviation multiplier. Changing the source or average method can change the lines. Increasing the multiplier with the same data widens the bands; reducing it narrows them. Changing the length changes both the mean and the spread, so a longer length does not always produce wider bands.
When comparing platforms, check whether standard deviation divides the sum of squares by the number of values or by that number minus one. These conventions produce different results. Our example divides by the number of prices. A difference caused by calculation settings is not a new market signal.
On an unfinished bar, the latest price and the bands can still change. A touch or move outside visible during the bar may disappear by its close. If a rule uses closing values, check the completed bar. Moving the plotted lines forward or backward with an offset does not add future data.
Touches of the upper and lower bands
Price near the upper band is high relative to its recent mean; near the lower band it is low relative to that mean. This is a comparison within the calculation, not an estimate of underlying value. A touch of the upper edge therefore does not require a sale, or a touch of the lower edge a purchase.
During a sustained rise, price can repeatedly touch the upper band or close above it. Falling markets can do the same near the lower band. This is called walking the bands. Trading against every touch may mean repeatedly expecting a reversal that has not happened.
A return from an edge while price moves sideways differs from repeated new highs or lows in a trend. Describe price movement first, then its location within the bands. If you expected a return but price continues along the edge, that expectation has not been confirmed. Another touch does not repair the failed assumption.
What a Bollinger squeeze means
A squeeze means the spread of prices in the selected window has become smaller. Judge narrowness against the same instrument's earlier readings with the same settings. A narrow-looking channel in one asset is not automatically as unusual as a similar-looking channel in another.
Expansion may follow a quiet period, but the bands set neither the timing nor the direction. A prolonged squeeze does not guarantee a powerful move. To describe a move as underway, observe a change in price rather than infer it solely from the narrow channel.
Distinguish crossing a calculated band from crossing the boundary of a price range. The indicator line moves with its calculation; a selected price high or low belongs to a particular part of the chart. A band crossing that does not pass the range boundary, or quickly returns, is not enough to establish continuation.
Widening also does not prove that a trend has ended. It can accompany a directional move or sharp back-and-forth fluctuations. The Average True Range (ATR) guide explains another measurement of price ranges. Its readings are not interchangeable with the spread of closing prices used by Bollinger Bands.
W-bottoms and M-tops
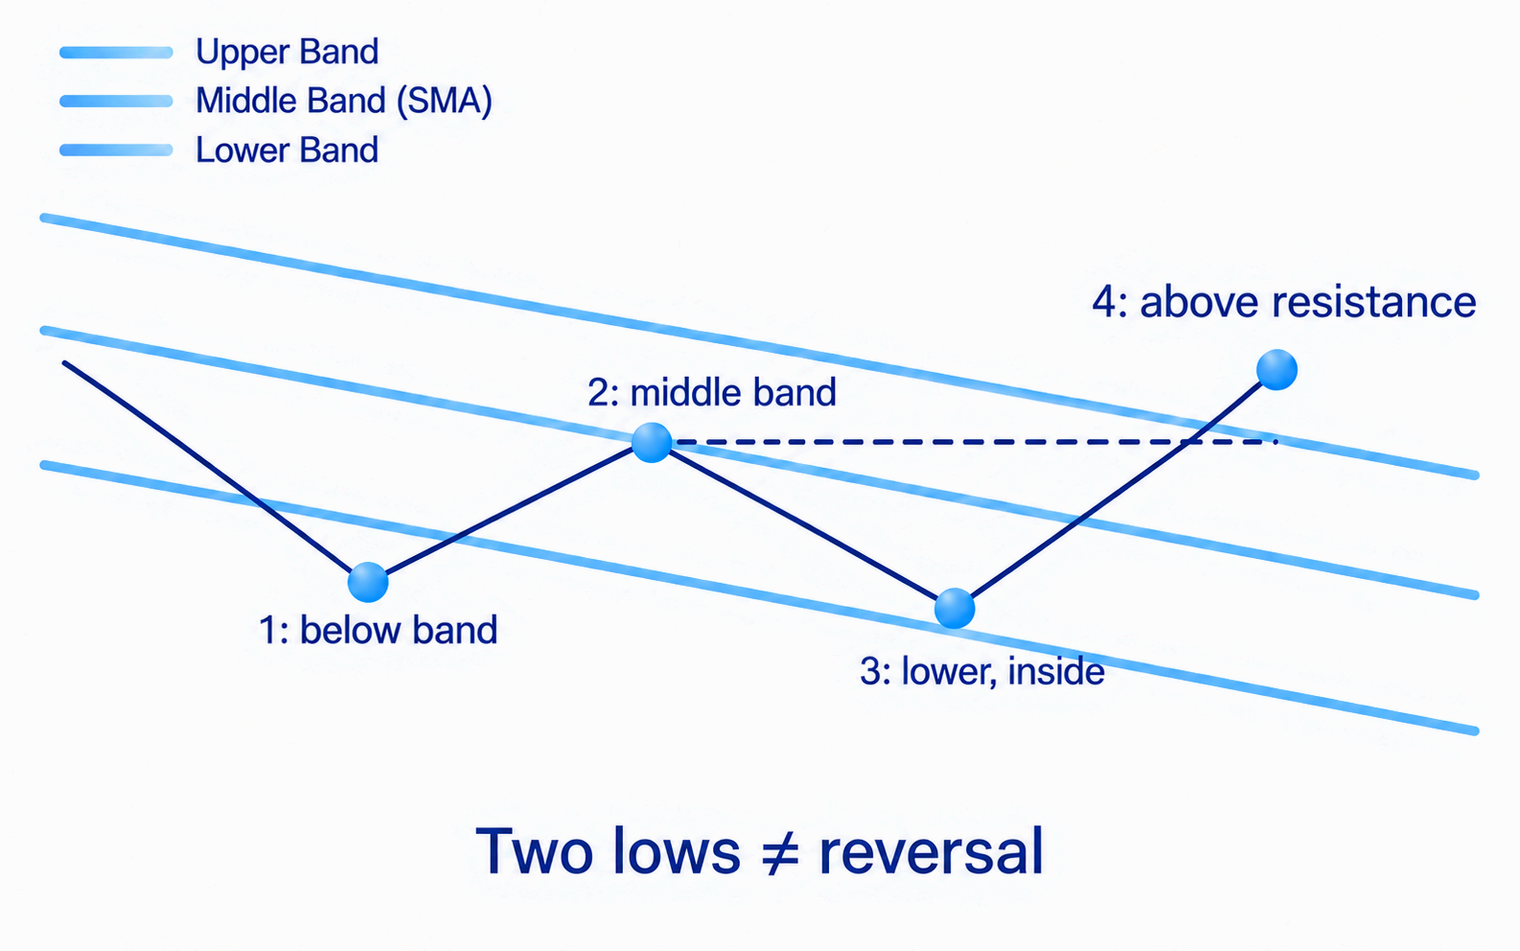
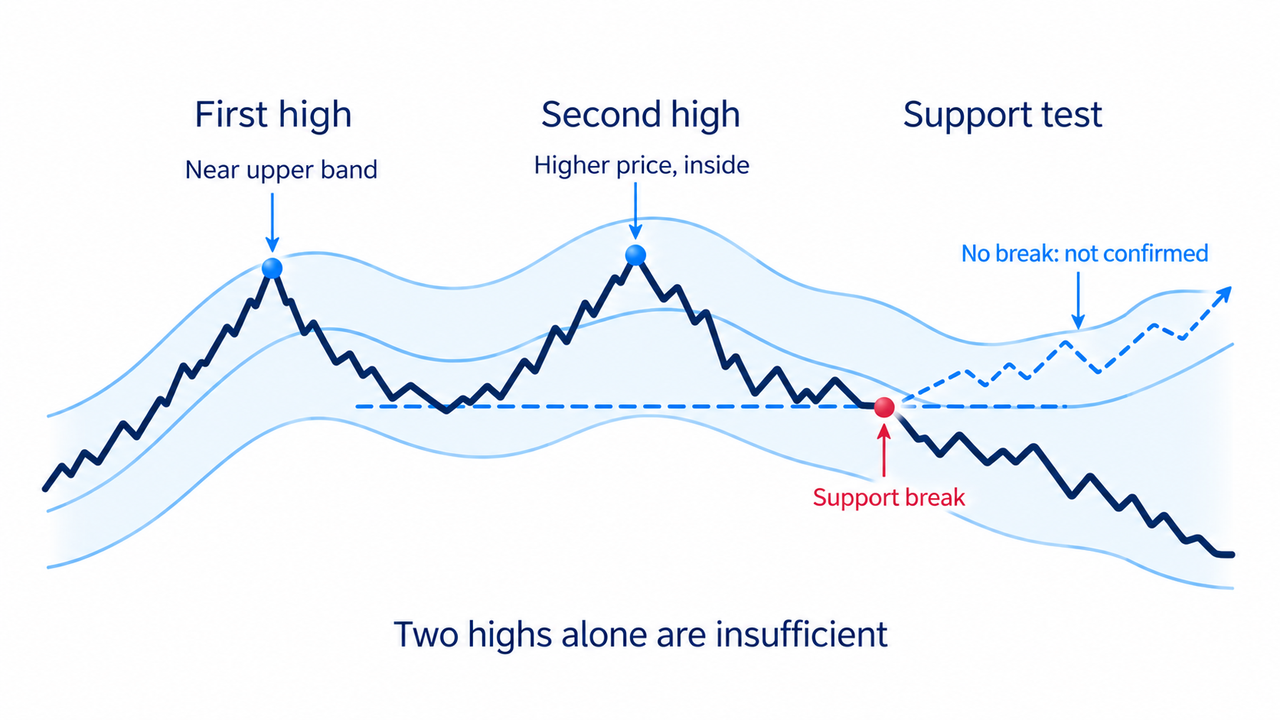
Bands let you compare successive lows or highs by both price and position relative to the changing channel. A W-bottom resembles a double bottom. In Bollinger's described version, the first decline reaches the lower band or passes it, then price rebounds toward the middle. The second decline can make a lower price low while its close remains inside the lower band.
Two lows alone do not complete this pattern. Check the subsequent upward movement and a break of the resistance formed between them. If the new decline continues, its different position relative to the band has not established a reversal. In a version evaluated on closes, a temporary move outside during the bar and a close outside are different conditions.
An M-top reverses the comparison. After an initial rise toward or above the upper band, price pulls back toward the middle and makes another attempt higher. Even a higher price high may fail to reach the new upper band. This can show weaker relative movement, not an automatic sell signal; a later break of support tests the proposed turn.
Choose the points and closing conditions before checking the outcome. Picking convenient highs or lows after seeing later bars, or changing the band settings to suit them, can make a pattern fit the desired conclusion. The sequence must be identifiable from information available at the time of the check.
Reading %B and BandWidth
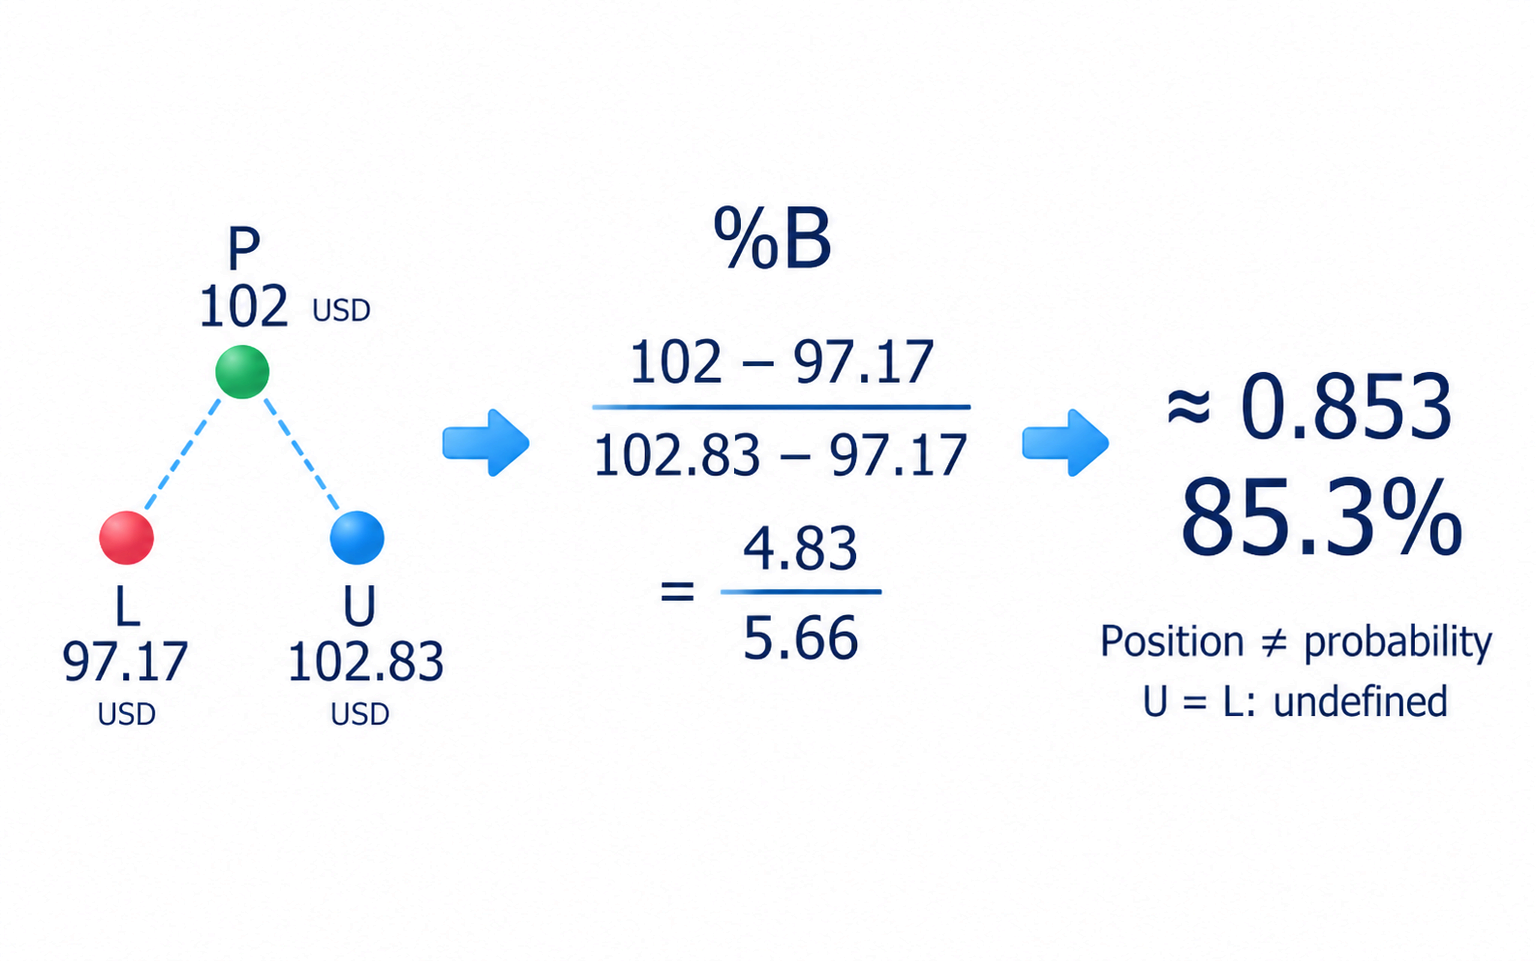
%B expresses price's position between the bands as a number: %B = (price − lower band) / (upper band − lower band). On this scale, 0 is the lower band, 1 the upper band and 0.5 the middle. Values below 0 or above 1 are possible and place price outside the corresponding edge.
Return to the same example. The last close is USD 102 and the bands are 100 ± 2 × √2. Then %B = (102 − (100 − 2 × √2)) / (4 × √2), about 0.854. Price is above the mean but below the upper band. This is a fraction of the channel width, not a trade probability; some displays show that fraction as 85.4%.
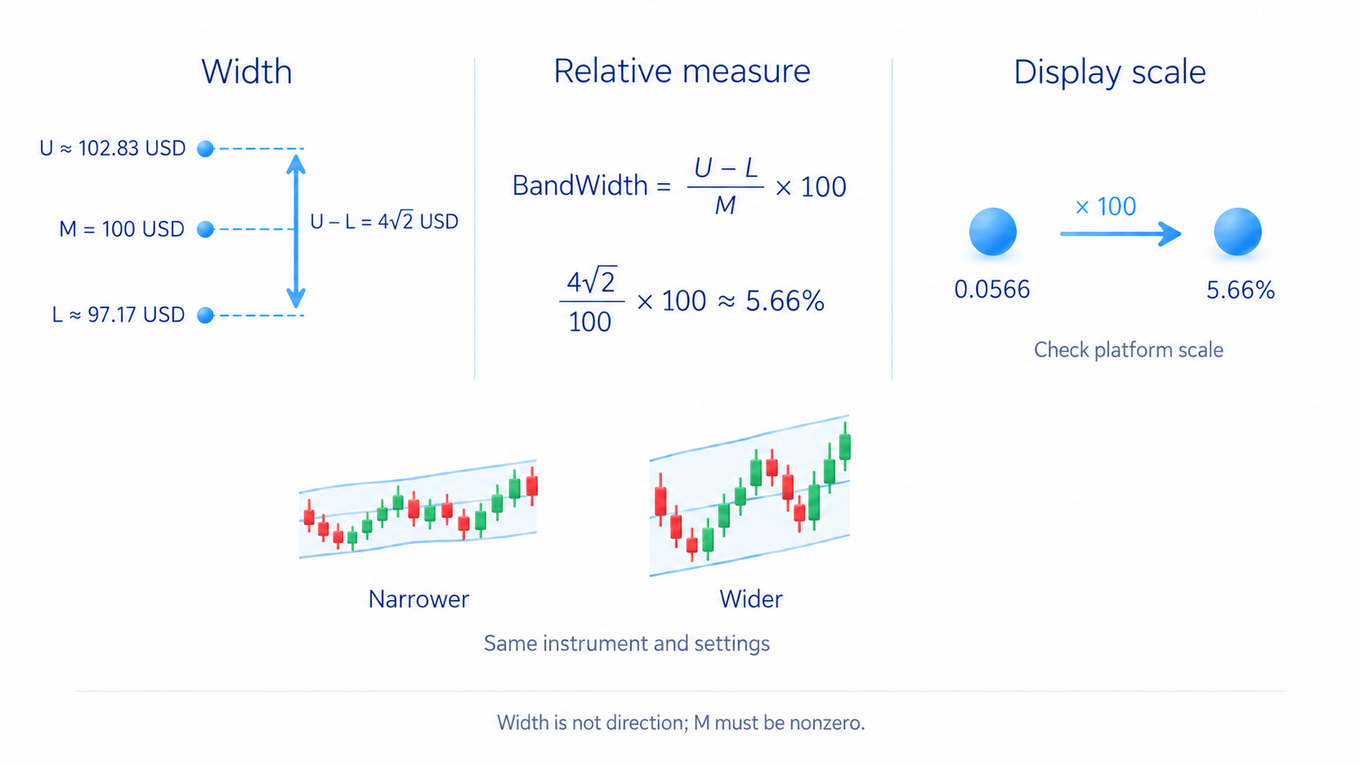
BandWidth measures relative band width. In percentage form it is (upper band − lower band) / middle band × 100. With the same data, 4 × √2 / 100 × 100 gives about 5.66%. A program may display the fraction without multiplying by 100, so check its scale before comparing readings.
Some squeeze tools compare Bollinger Bands with Keltner Channels, another calculated envelope. Common modern Keltner channels use an average with a distance based on ATR, rather than the spread of closing prices. A rule may call the squeeze on when both Bollinger Bands lie inside that envelope and off when they no longer do. Check the channel formula and settings: this is a chosen compression condition, not a prediction of direction or guaranteed breakout.
When both bands coincide, %B has a zero denominator and its within-channel position is undefined by that formula. BandWidth requires a nonzero middle band; its usual relative-width interpretation assumes a positive price. Neither measure determines direction: %B describes position and BandWidth describes width.
Testing a use of the bands
In my course, indicators are supporting tools studied after price structure, levels and how trading activity compares with price movement. With Bollinger Bands, first describe price movement, then test whether width or position adds a useful condition. This learning order appears in the course's section on indicators; it is not a separate personal Bollinger trading system.
Volume and price reaction add information missing from the bands. Trading volume is the quantity traded in the selected data source. A rise in volume shows activity, but does not guarantee continuation or identify the participants. Check whether price keeps its new position or the move outside is followed by a return, rather than assuming that high volume confirms every breakout.
The video on indicator lag explains why a price-based indicator responds to data already received. It offers optional practical context. It explains a general calculation principle, not a separate strategy using Bollinger Bands; the full written lesson does not require watching it.
To test a use of the bands, fix the length, source, multiplier and bar-reading time. Choose one condition, such as compression relative to earlier width readings or the described W-bottom sequence. Reveal the chart step by step without future bars, keeping failed patterns as well as confirmed ones. If the conclusion depends on changing settings or picking different points afterward, reconsider the rule itself.
Frequently asked questions
They show a recent average, the spread of prices around it and price's position relative to the outer bands. Greater standard deviation widens the bands, but does not determine the next move's direction.
No. During strong growth, price can keep moving along the upper edge. A touch describes relative position, not a confirmed reversal.
The selected window's prices have become less dispersed. Judge how unusual that is against the instrument's own earlier readings with the same settings. A squeeze sets no deadline, direction or guaranteed strength for the next move.
They are sequences of two declines or rises with different positions relative to the bands. A subsequent move beyond the high or low formed between them tests the proposed turn. Two extremes alone are insufficient.
%B expresses position from the lower band toward the upper band and can go outside 0–1. BandWidth expresses relative width, sometimes as a percentage. These are calculation features, not the probability of a profitable trade.
Volume adds information about trading activity, while price reaction shows whether the move outside held or returned. High volume alone neither proves continuation nor identifies the participants.
About the author
Igor Arapov, practising trader since 2013 and author of the ArapovTrade library. ORCID: 0009-0003-0430-778X.




