Ichimoku compares price with several calculated lines. Two of them form a shaded cloud used to describe direction. Reading it correctly means separating the prices used in a calculation, the result and the place where that result is drawn on the chart.
The five Ichimoku lines
The full name, Ichimoku Kinko Hyo, is commonly translated as “one-glance equilibrium chart”. Japanese journalist Goichi Hosoda developed the method and published its description in 1969. Its five lines do not all use the same calculation.
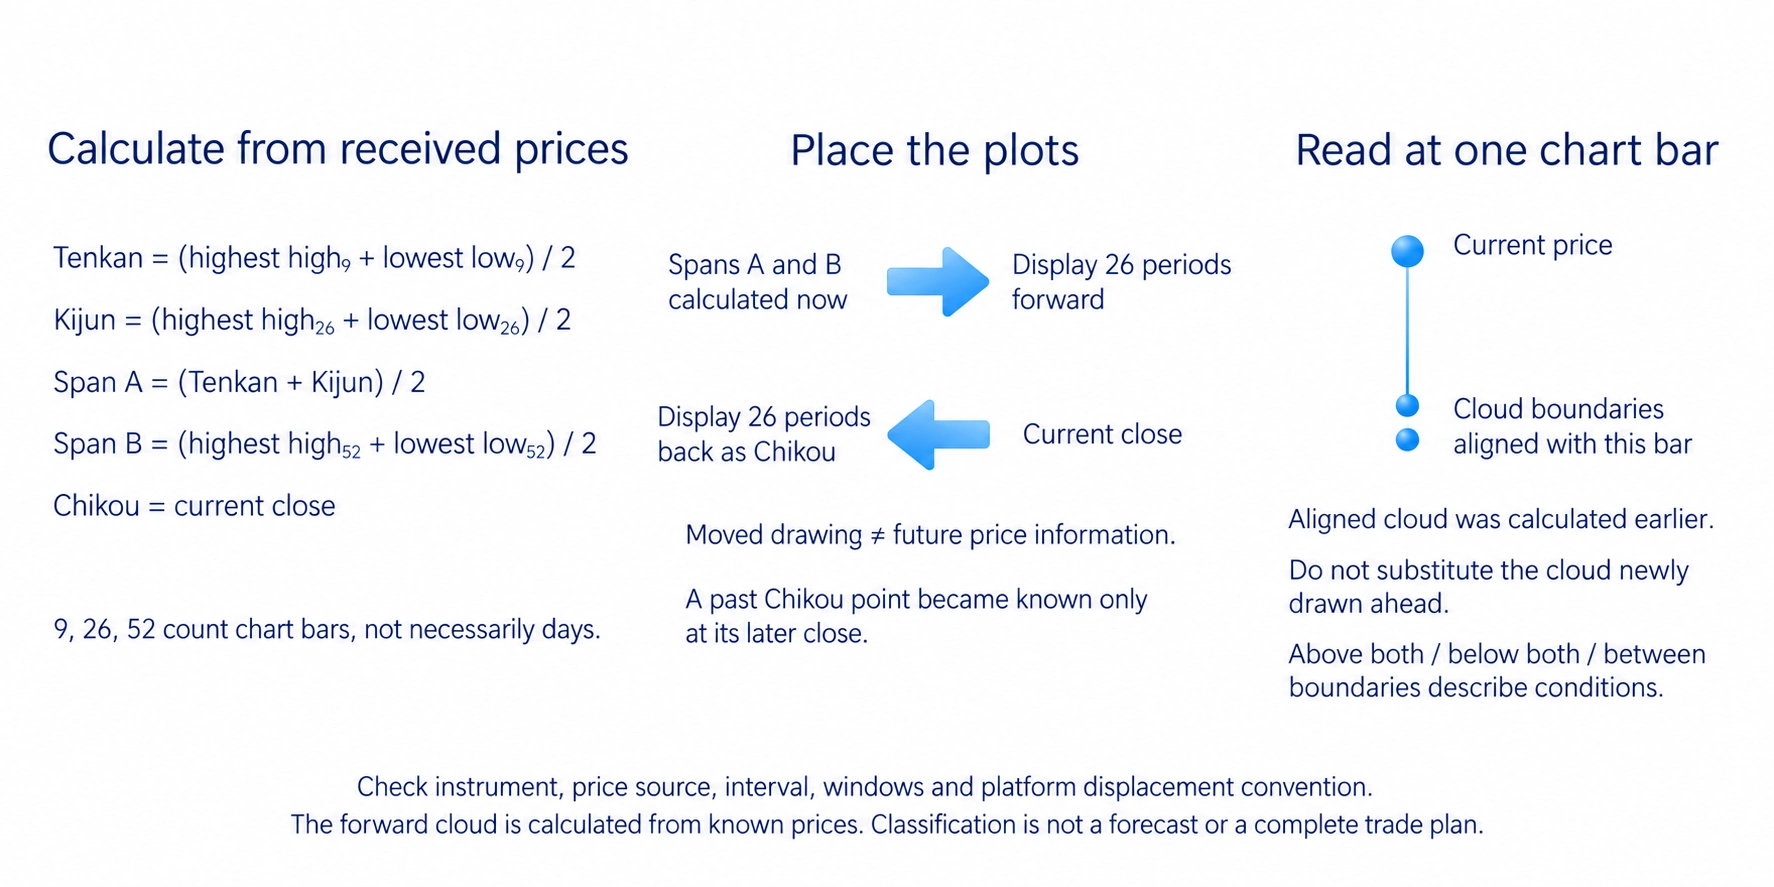
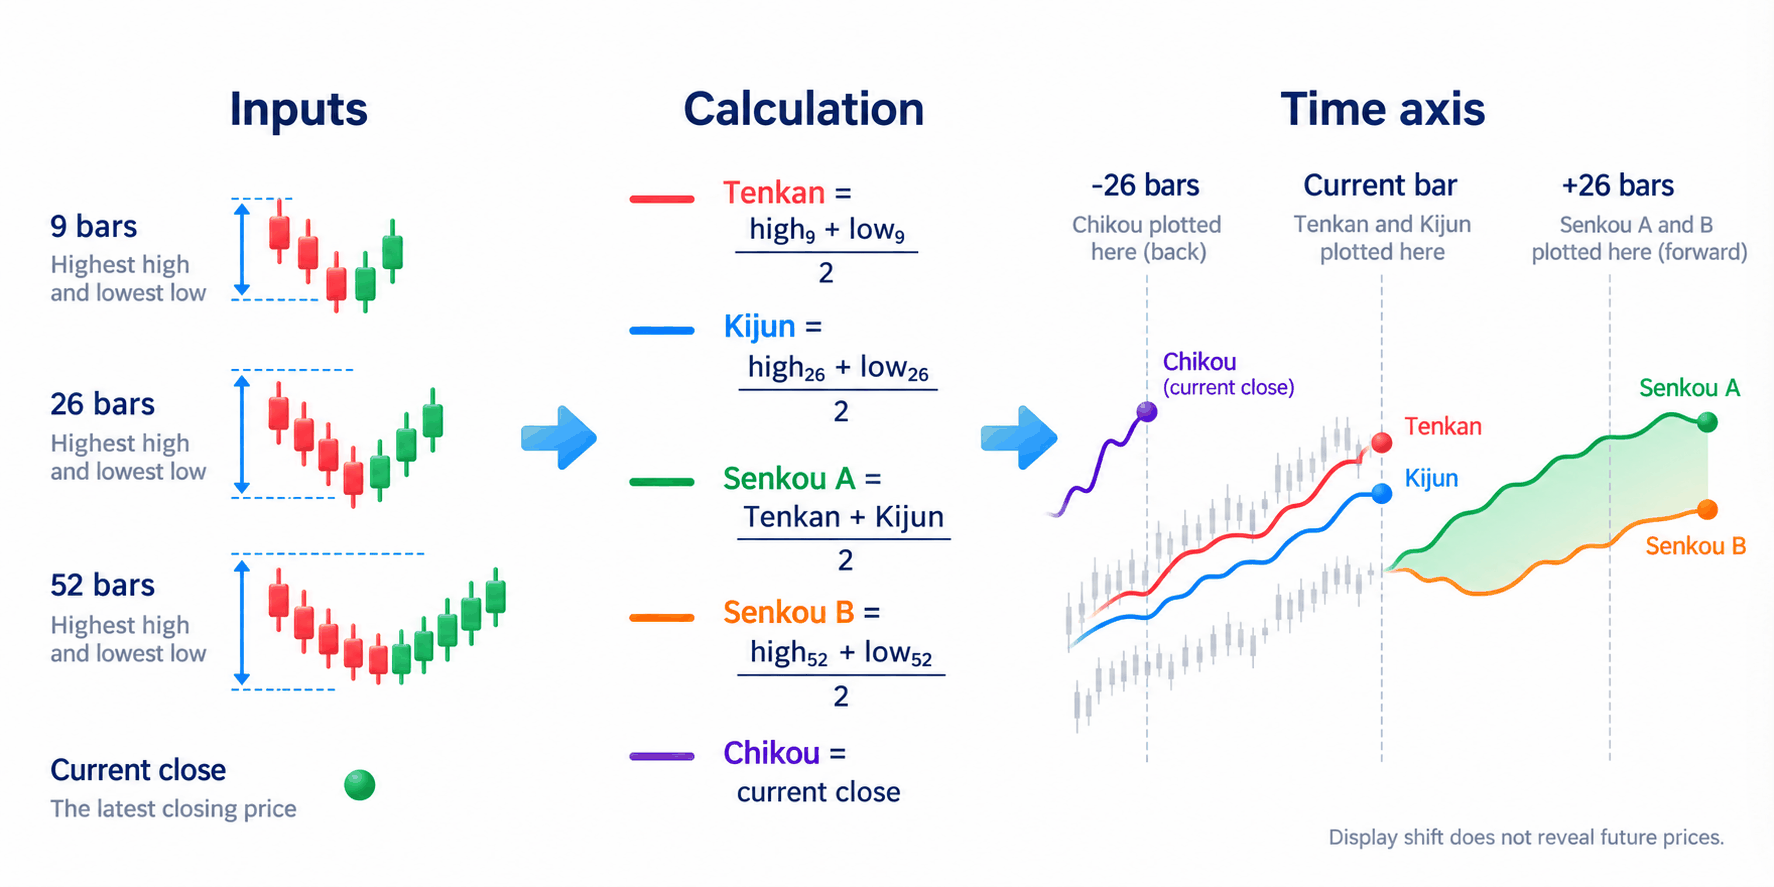
Tenkan-sen, the conversion line, is the midpoint between the highest high and lowest low of the latest nine bars. Kijun-sen, the base line, uses the same method over 26 bars. Here a bar is one chart period: a trading day on a daily chart or one hour on an hourly chart.
Both windows include the current bar. These lines do not average every closing price as a simple moving average does. If the window’s highest high and lowest low stay unchanged, its midpoint can remain flat while individual closes move.
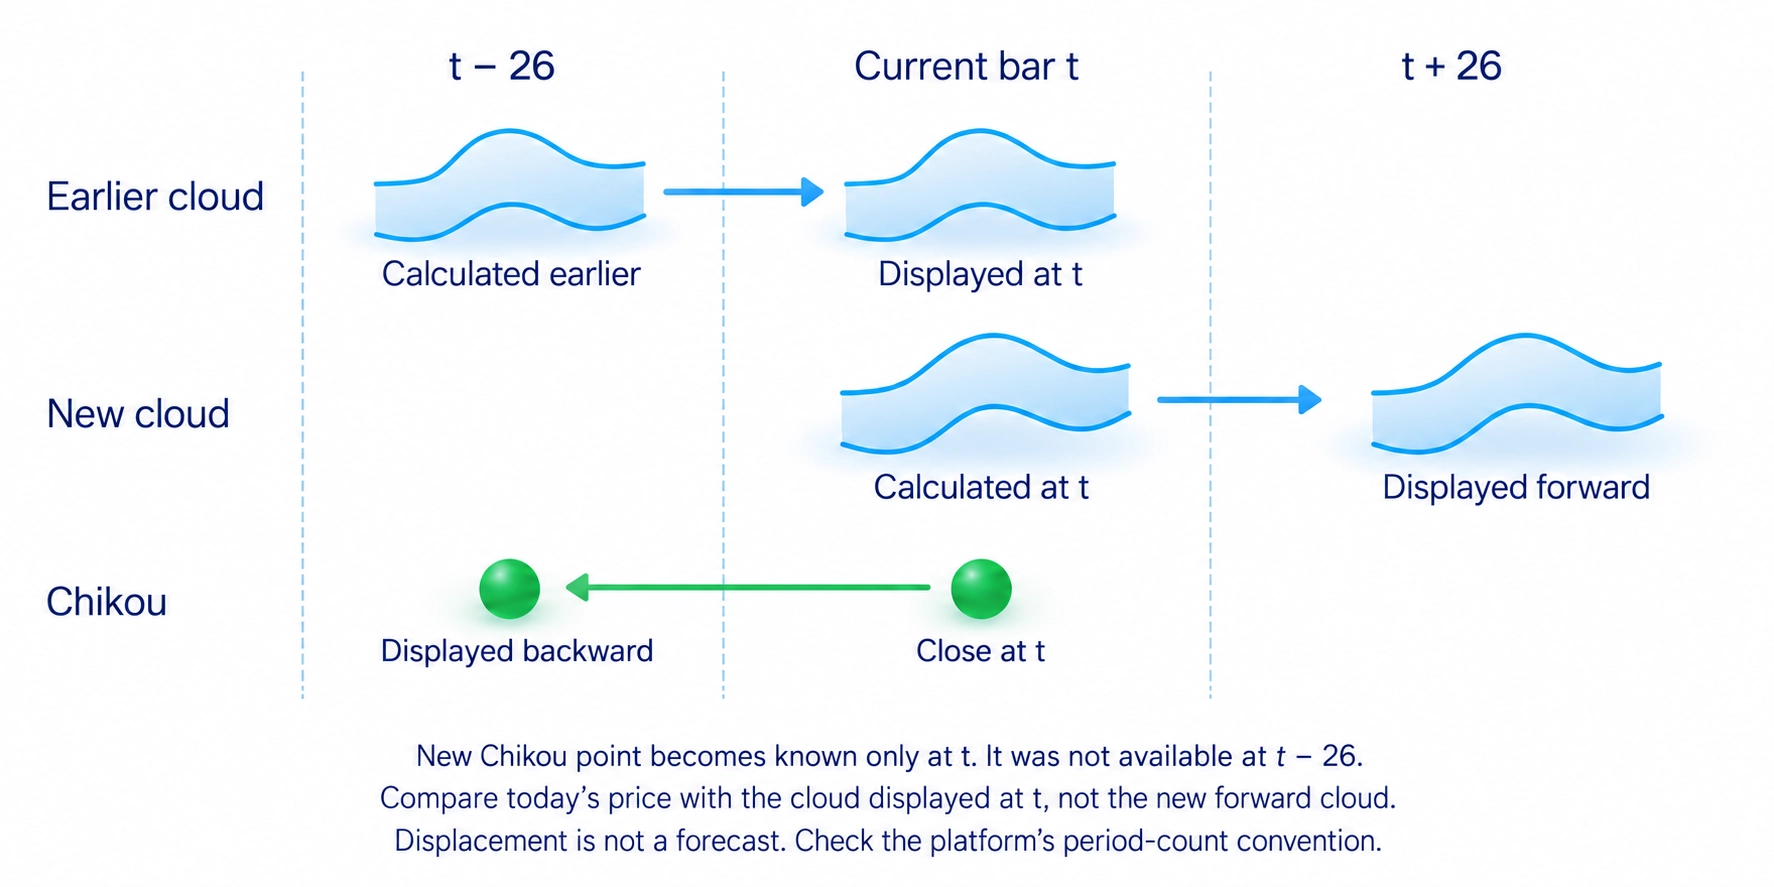
Senkou Span A is the midpoint between Tenkan-sen and Kijun-sen. Senkou Span B is the midpoint between the highest high and lowest low over 52 bars. Both are normally displayed 26 periods forward from their calculation time. The area between them is called Kumo, or the cloud.
Chikou Span is the current bar’s closing price displayed 26 periods back. It is not another average, and it was not information available to traders at that earlier time. It compares the present close with older price movement.
How Ichimoku lines are calculated
The conventional settings use windows of 9, 26 and 52 bars with a displacement of 26. You need highs, lows and closes for the selected instrument. Every line uses the same units as its price. Check the platform’s displacement convention when matching exact chart positions.
- Tenkan: add the highest high and lowest low of nine bars, then divide by two.
- Kijun: repeat that calculation for a 26-bar window.
- Span A: add Tenkan and Kijun, then divide by two; display the result forward.
- Span B: take the midpoint of the 52-bar extremes; display it forward too.
- Chikou: display the current close backward without averaging it.
For one illustrative share quoted in US dollars on a daily chart, suppose the last nine bars have a highest high of 110 and lowest low of 100. The 26-bar extremes are 114 and 94, and the 52-bar extremes are 118 and 90. The current bar closes at 109. These are hypothetical inputs for checking the calculation, not an author’s trade.
Tenkan-sen is (110 + 100) / 2 = USD 105. Kijun-sen is (114 + 94) / 2 = USD 104. Span A is (105 + 104) / 2 = USD 104.50; Span B is (118 + 90) / 2 = USD 104. Chikou shows the USD 109 close at an earlier chart position.
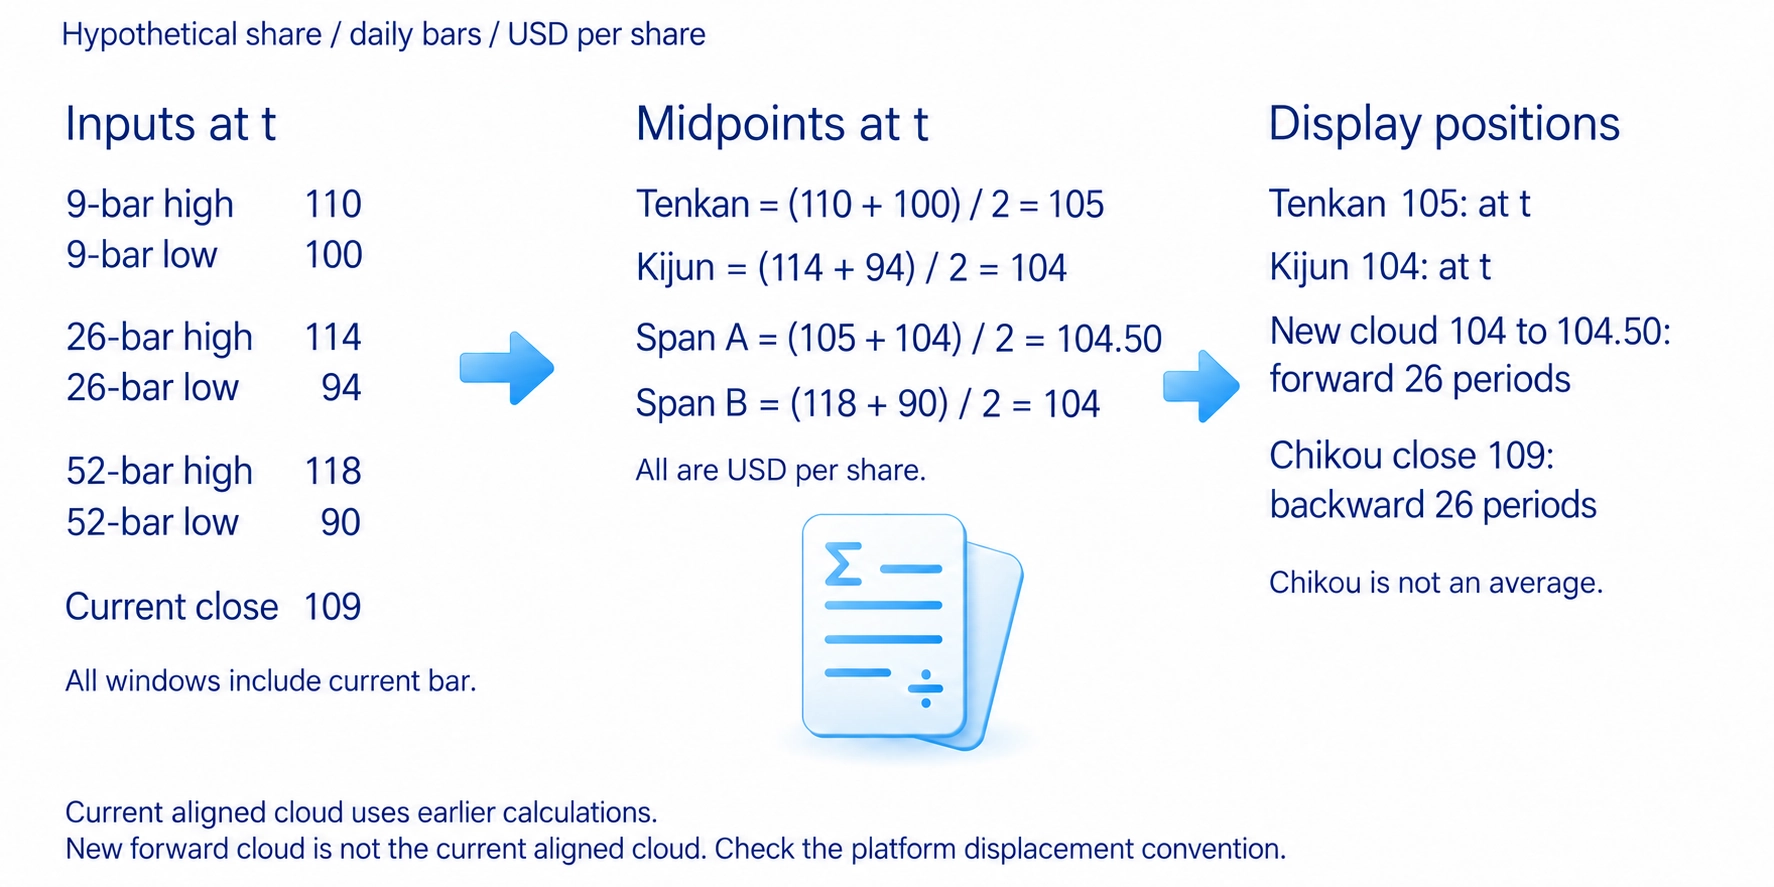
That newly calculated cloud, from USD 104 to USD 104.50, is drawn ahead of the current bar. Comparing today’s price with today’s displayed cloud requires different values: those directly aligned with the current bar, calculated earlier and shifted here. Mixing the two clouds changes the interpretation even when the arithmetic is correct.
Price above or below the cloud
Compare price and both cloud boundaries on the same vertical line of the chart. Price above both is commonly classified as an upward picture; below both as a downward picture. Between them, this criterion does not establish a clear direction. It describes the indicator’s conditions, not what the next price must do.
Continuing the example, suppose the earlier cloud boundaries displayed beneath the current bar are USD 102 and USD 103. The USD 109 close is above both, so the above-cloud condition is met. Do not use the freshly calculated USD 104 and USD 104.50 for this comparison: they belong to the forward cloud.
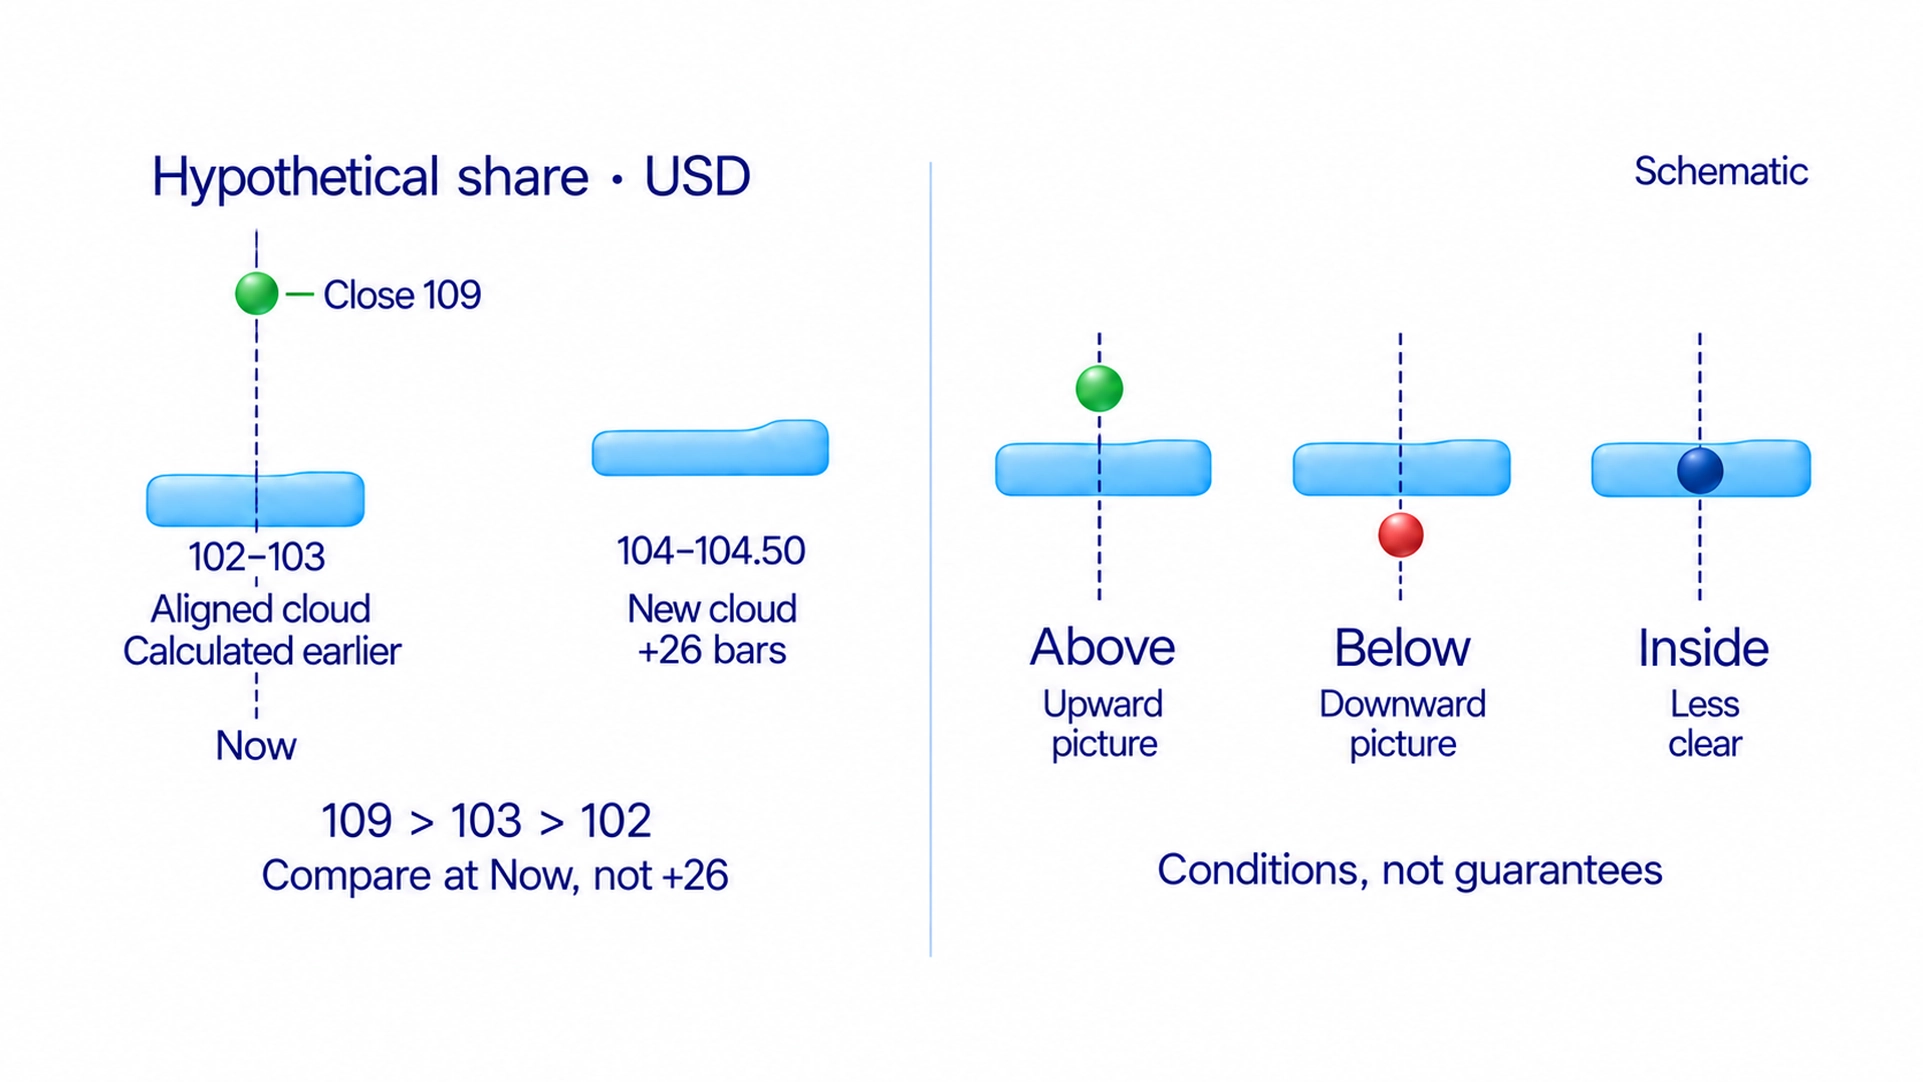
The relationship between Span A and Span B supplies a second condition. When A is above B, the cloud is usually coloured bullish; when A is below B, bearish. Actual colours are configurable. Price can be above a bearish-coloured cloud after movement changes, so colour alone does not replace checking price.
Cloud boundaries can be treated as possible support or resistance areas. They do not show actual exchange orders or make price stop. Watch the reaction as price approaches: does it hold the area or pass through? Cloud thickness is the distance between its boundaries, not a measured probability of a successful bounce.
The forward cloud is calculated from prices already received. Moving the drawing to the right does not reveal future prices. The chart-reading guide explains how to check areas and price reactions on the underlying chart.
Reading Tenkan–Kijun crossings
A TK cross is a new crossing of Tenkan-sen and Kijun-sen. Tenkan moving from below Kijun to above it is conventionally a bullish cross; the reverse is bearish. Compare the previous bar’s relationship with the current one. Simply finding one line above the other does not mean a new crossing has occurred.
Check where the crossing occurs relative to the cloud. A bullish crossing above the cloud agrees with an upward picture; the same crossing below it conflicts with that picture. Reverse the conditions for a bearish crossing. The labels “strong” and “weak” classify these combinations; they do not give proven probabilities of profit.
Chikou adds a comparison of the present close with historical prices. Look at its displaced point and the bars around that point. Above the older price range means the current close is higher than those prices; below means lower. It is another condition derived from price, not independent evidence of demand.
The signal forms after its input prices change. On an unfinished bar, the high, low and latest price can still update, so a crossing can disappear before the close. If your rule requires a completed bar, check it after that period ends rather than during a brief touch of the lines.
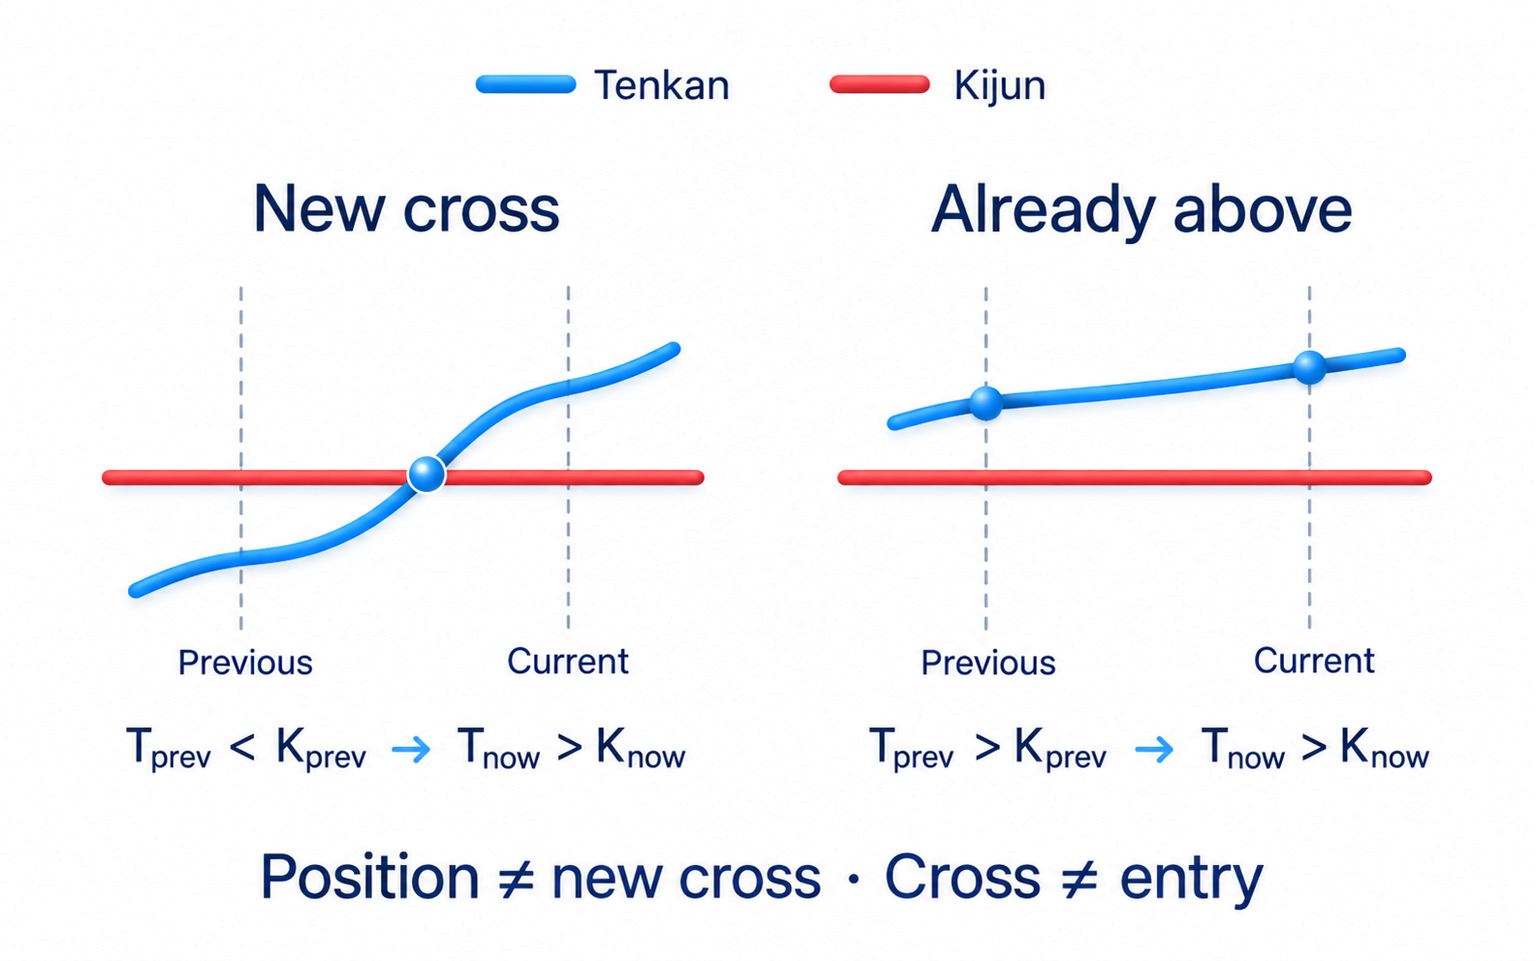
During sideways movement, lines can cross repeatedly without sustained continuation. A TK cross does not set your permitted loss or exit rule. Decide those separately before entering; the risk-management guide explains the loss-budget calculation. A crossing does not authorize increasing an existing risk limit.
Settings and checks for reading Ichimoku
When comparing charts, first match the instrument, price source and chart period. Then check the windows, displacement and enabled lines. Platforms can name their fields or count displaced periods differently. Compare the documented settings and actual plotted positions, not just a matching set of numbers.
The traditional 9, 26 and 52 settings developed in Japanese daily-chart practice with a six-day working week. That history does not prove they are optimal for every market. On an hourly chart the windows count hours, not days. Changing a window changes the input extremes; do not choose it just to make signals look attractive in an already reviewed sample.
Choose one completed bar and reproduce its calculations from the available highs, lows and close. Check the time each line belongs to, which cloud aligns with that bar and where Chikou is displayed. If there is insufficient history for a long window and its displacement, some lines may be absent. Their absence is not a trade signal.
When reviewing an old section of the chart, ask when each value became available. A Chikou point displayed in the past appeared only after the corresponding later close. Treating it as information known on that earlier bar uses data from its future and makes a historical test look falsely precise.
In the course’s section on indicators, I start with reading price structure, levels and the relationship between price movement and trading volume, the quantity traded in the selected data source. Then an auxiliary indicator can be evaluated. With Ichimoku, check what the cloud adds to that already understood picture; this is not a separate personal cloud strategy.
The optional video on indicator lag adds a practical explanation of how a signal follows received prices. The volume-analysis guide develops the comparison between trading activity and price movement. The written checks above let you read the five plots without needing to watch the video.
Frequently asked questions
It has five plots. Tenkan and Kijun mark range midpoints; Spans A and B form a forward-displaced cloud; Chikou displays a closing price in the past. Displacement does not turn known data into a forecast.
Compare price with both boundaries on the same vertical line. Above them is conventionally an upward picture; below them a downward picture. Inside the cloud the direction is less clear. These are classification conditions, not guarantees of continuation.
It is a new crossing of Tenkan and Kijun. Tenkan crossing from below Kijun to above it is conventionally bullish; Tenkan crossing from above Kijun to below it is conventionally bearish. Check it against the aligned cloud and, if the rule requires it, after the bar closes.
Common windows are 9, 26 and 52 with a displacement of 26 periods. The chart period determines what those bars represent. When matching platforms, check the price source and displacement convention; familiar settings are not proof of effectiveness.
First learn to read price, movement direction and levels on the chart. That is the sequence used in Arapov’s course, where indicators support the reading. It makes the five plots easier to understand without mistaking them for knowledge of the future.
About the author
Igor Arapov, practising trader since 2013 and author of the ArapovTrade library. ORCID: 0009-0003-0430-778X.




