A candlestick shows four prices for a chosen period: the open, high, low and close. A candlestick pattern is one candle or a short sequence that traders examine for a possible change in movement. Reading it means checking both its shape and where it appears, then watching what price does next.
How a candlestick works
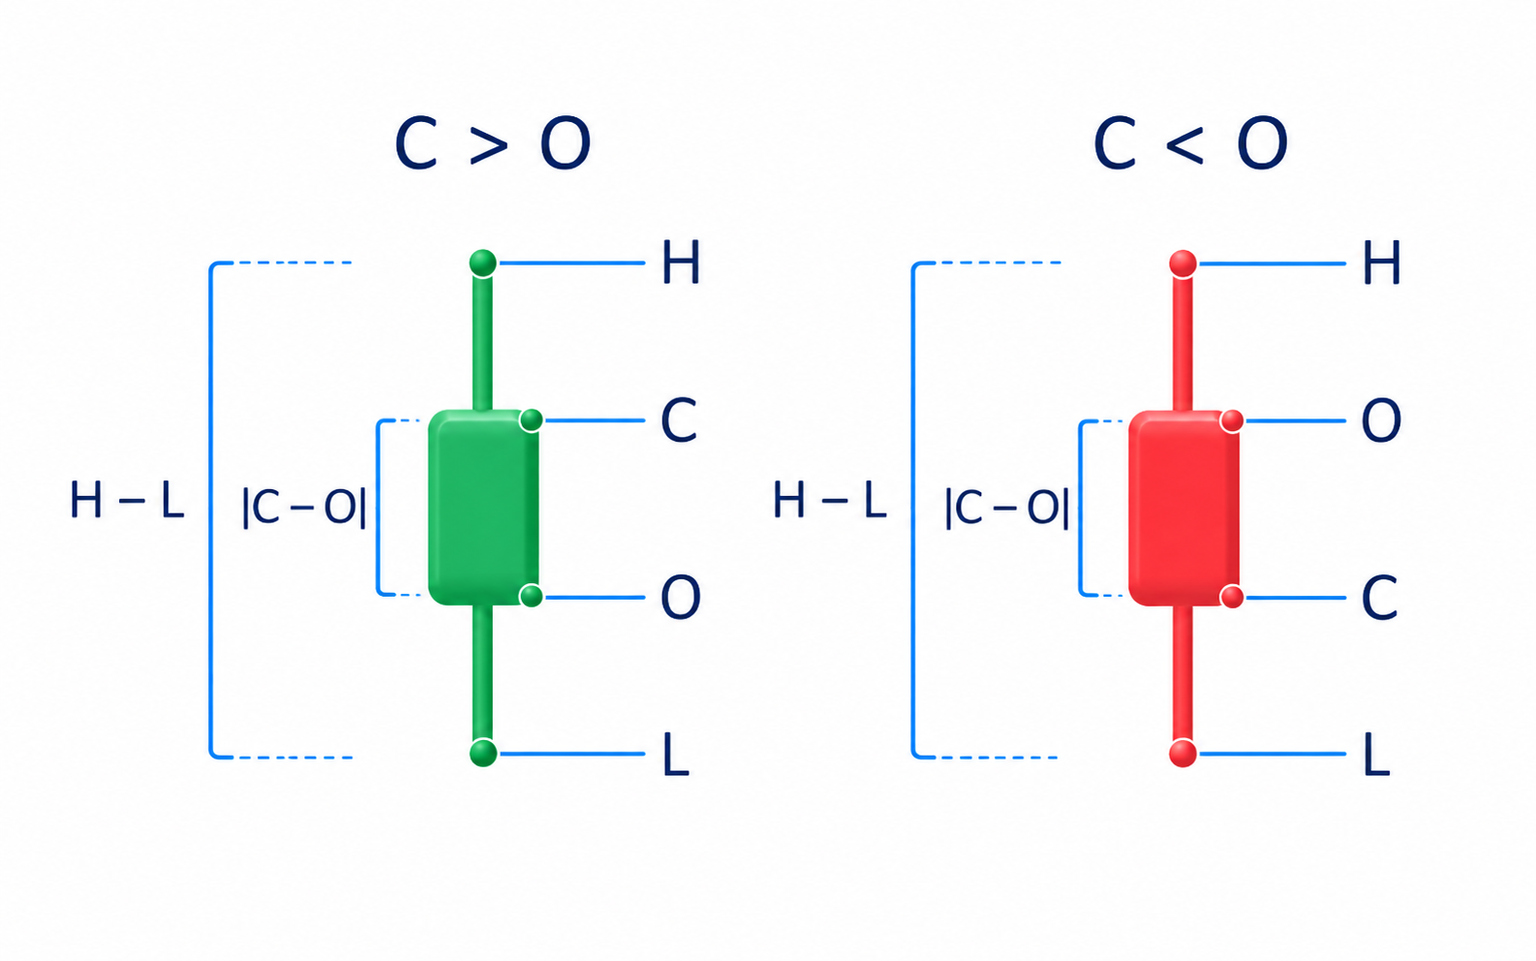
The body runs between the opening and closing prices. The upper wick extends from the top of the body to the high; the lower wick reaches from the bottom of the body to the low. A close above the open makes an ordinary candle bullish; a close below makes it bearish. An almost invisible body means those two prices were close, not that nothing happened during the period.
Green and red are common colours, but they are settings rather than fixed rules. Some chart options colour a candle by comparison with the previous close instead of its own open. Check which rule your chart uses. Read the actual prices before drawing a conclusion from colour alone.
An hourly candle groups an hour of activity; a daily candle groups the selected trading session. A long daily wick can contain several movements on a shorter chart. The chart-reading guide explains how the period changes the view without changing the underlying price history.
An unfinished candle is still changing. Its high, low and current closing value can move before the period ends, so an apparent pattern may disappear. A rule requiring a completed candle is checked at the close; entering earlier uses a different condition.
What the body and wicks show
A large body means a large difference between the open and close. Compare it with nearby bodies on the same period, not its height on a resized screen. A small body can still have long wicks and a wide price range: a small final change does not necessarily mean quiet trading.
A long lower wick records prices below the body followed by a close above the low. An upper wick records the distance between the high and the upper edge of the body. Neither identifies who traded or proves that every seller or buyer has finished.
Those four recorded prices do not reveal the entire order of events. Different paths through the period can produce the same candle. If your decision depends on which extreme came first, examine more detailed data instead of inventing a story from the wick.
Pin bars, hammers and hanging men
A pin bar has a small body near one end of its range and a much longer wick at the other. The opposite wick is short or absent. Some recognition rules require the long wick to be at least twice the body. That ratio defines a shape; it does not prove that the pattern makes money.
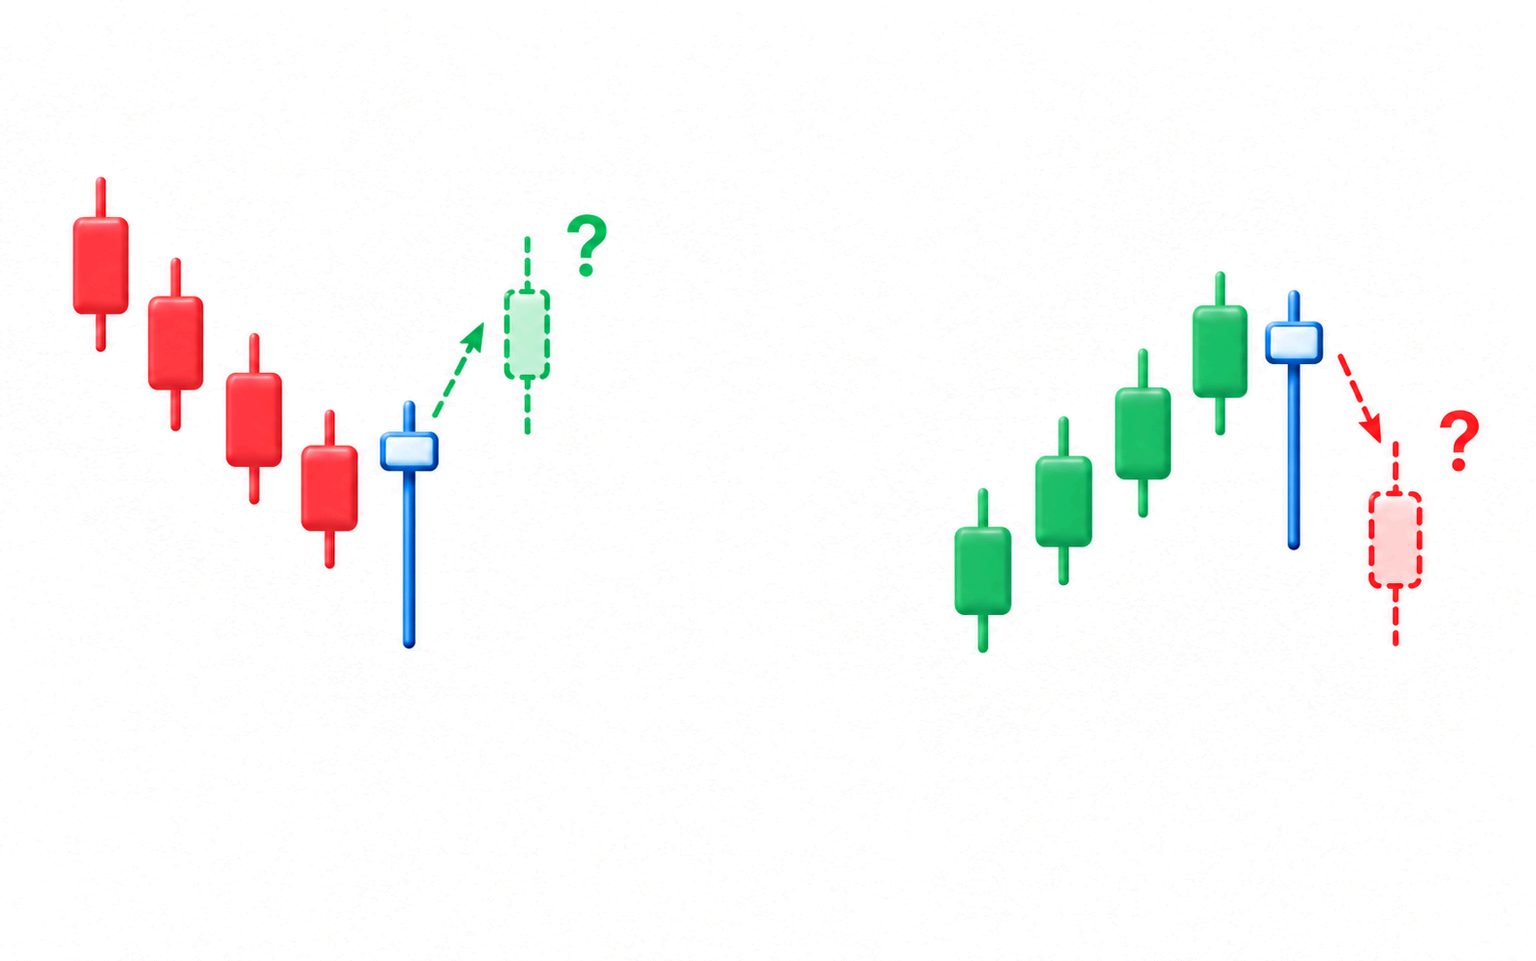
A lower-wick pin bar after a decline can be a reason to examine a possible upward reaction. An upper-wick pin bar after a rise can prompt a check for a downward reaction. The same shape in the middle of sideways movement has a different setting. Identify the preceding movement before choosing a direction.
A hammer has a small body near the top and a long lower wick after a fall. A hanging man has a similar shape after a rise. With a hammer, traders check for subsequent movement upward; with a hanging man, downward confirmation matters. The preceding movement distinguishes the names, not simply the body's colour.
A small body with a long upper wick after a rise is called a shooting star. A similar shape after a decline is an inverted hammer. No wick chooses the next trade by itself. The breakout guide explains the separate sequence of crossing a boundary, returning and testing the reaction.
Engulfing versus harami
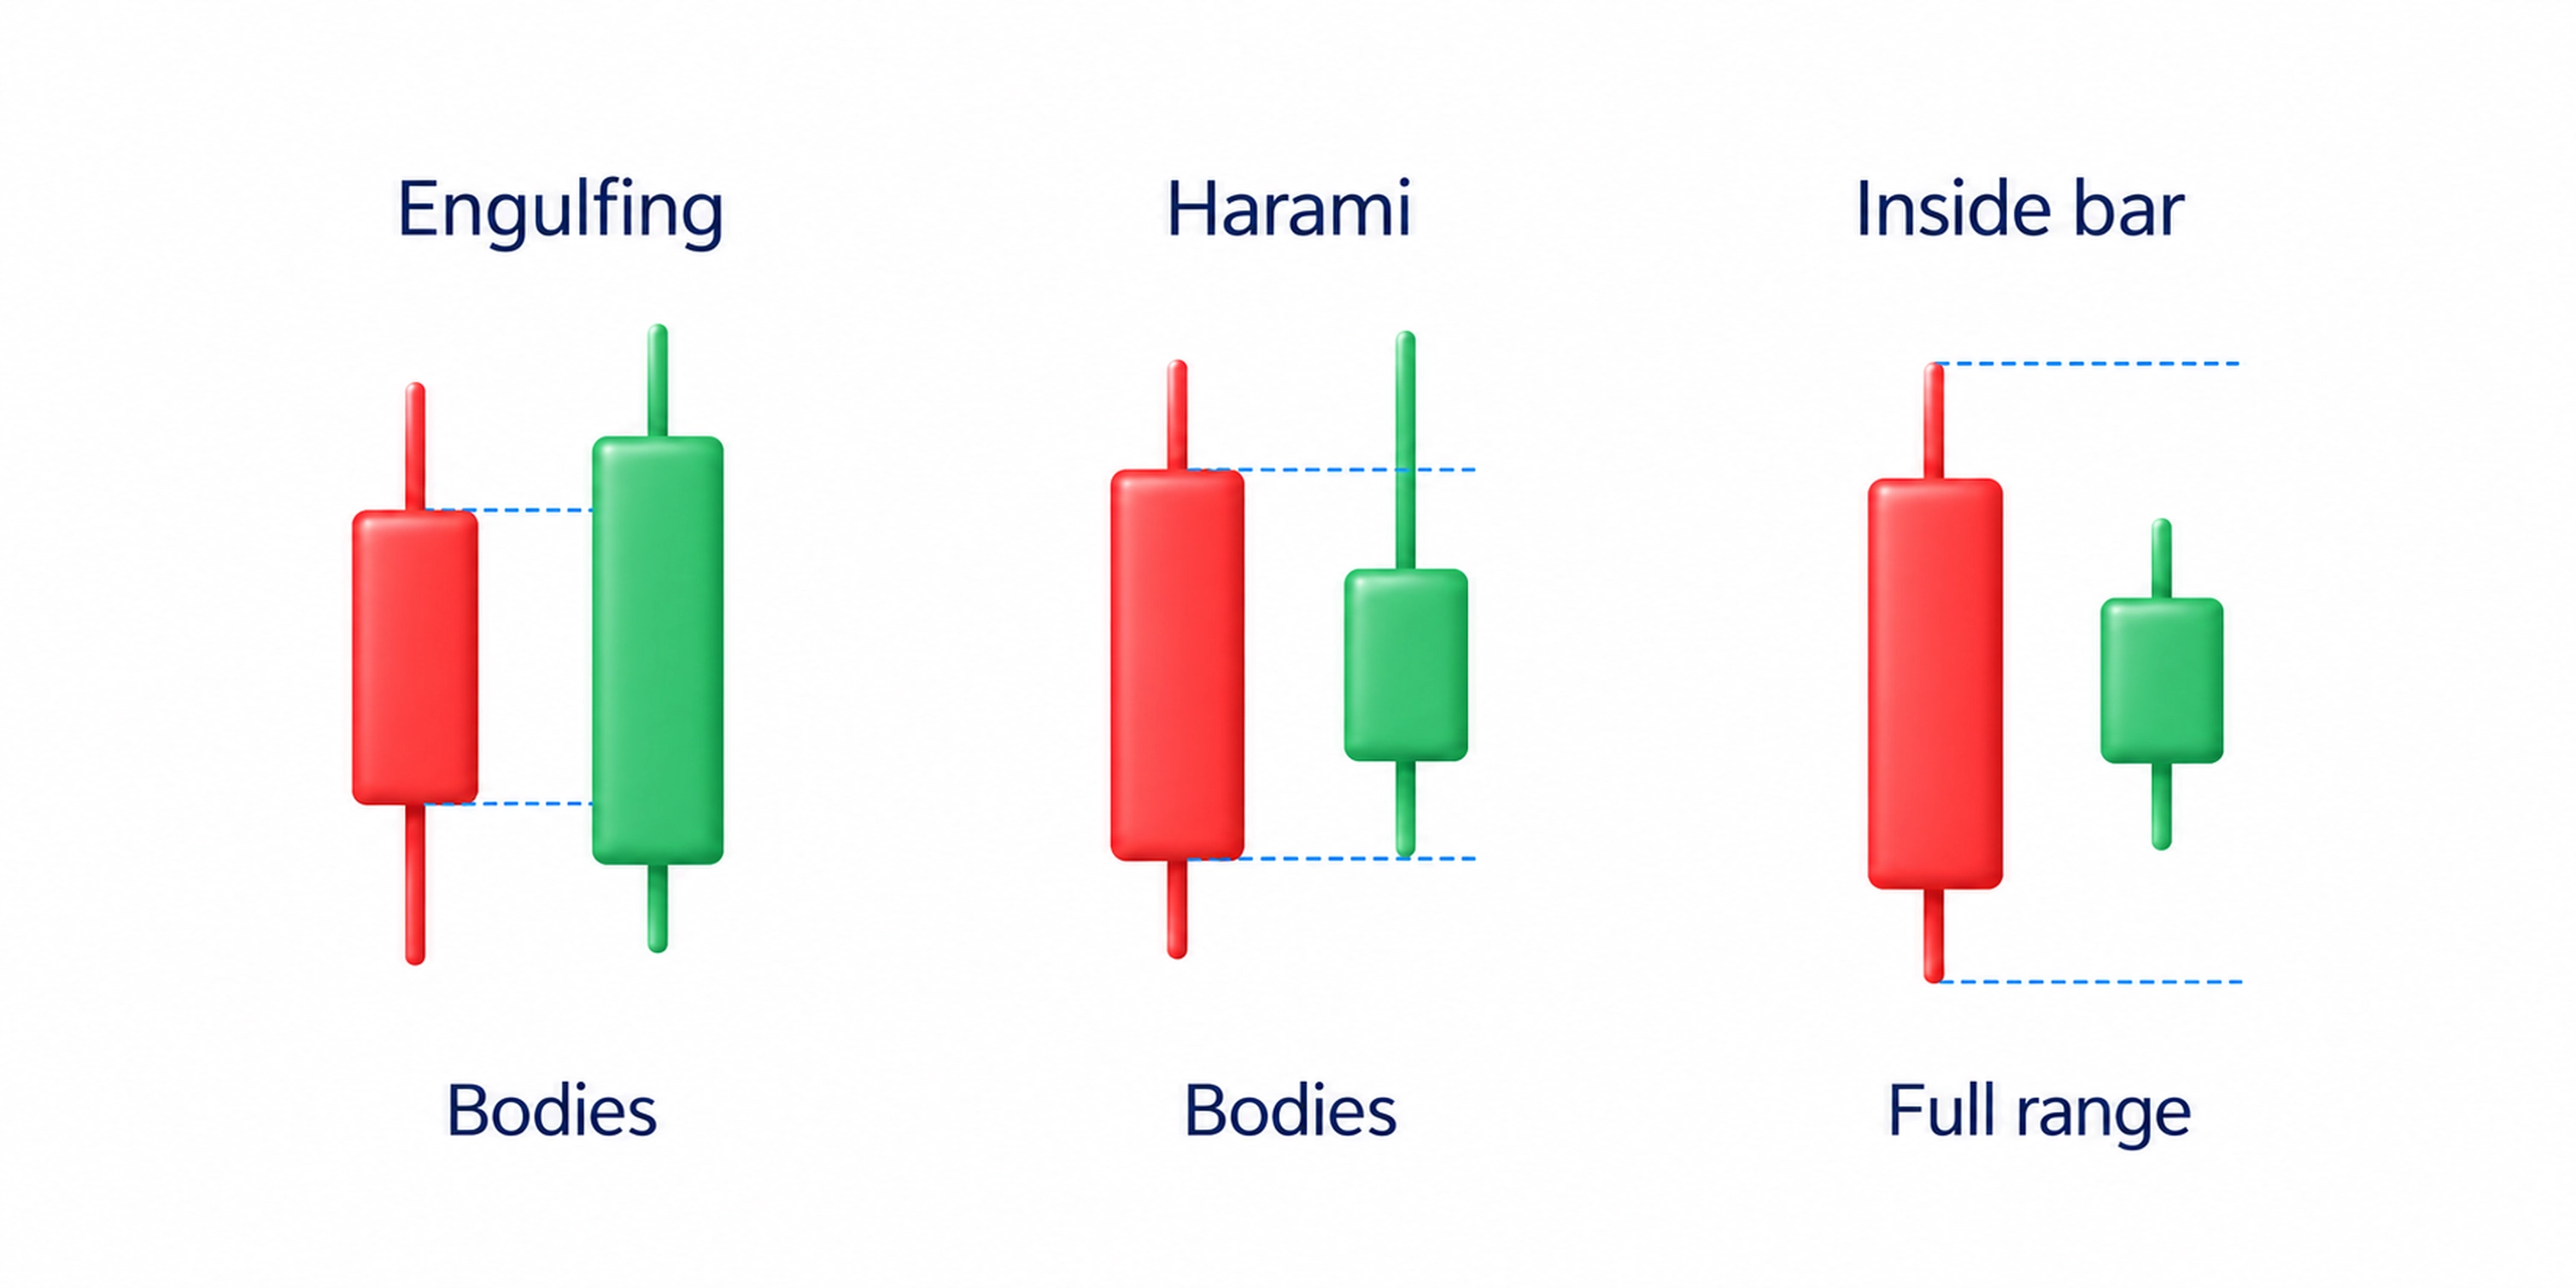
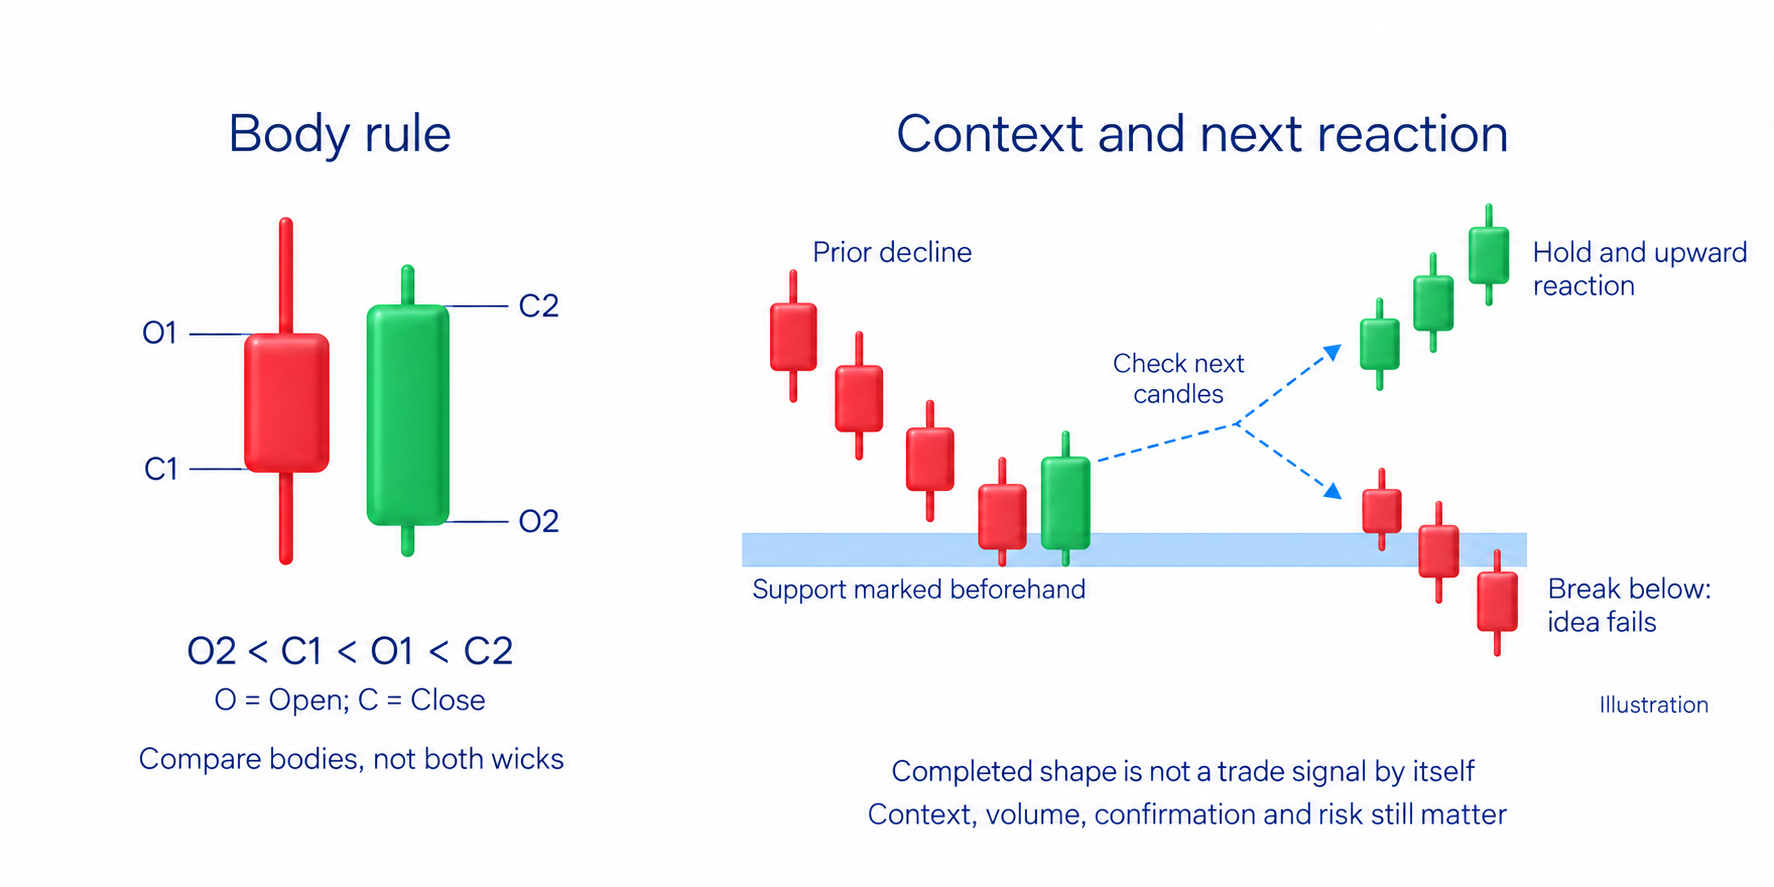
An engulfing pattern uses two candles. In a bullish version, the second upward body's opening and closing span the first downward body. The bearish version reverses those directions. Compare bodies: the second candle does not have to cover both wicks of the first.
The location still matters. Bullish engulfing after a decline is not the same setup as the same two candles after an extended rise. The second large body records a strong change from its open to its close. Continued movement after that close must still be checked.
A harami reverses the size arrangement: the second small body sits inside the earlier large body. An inside bar uses a different test, with the whole second range, including its high and low, inside the previous range. A harami's wicks can extend beyond the earlier body, so the two conditions are not interchangeable.
Doji, morning stars and evening stars
A doji has an open and close that are equal or very close. Judge that closeness against the instrument's price increments, the candle's range and nearby bodies; one fixed dollar difference does not fit every market. A doji records little net change without selecting the next direction. These patterns describe different things: a hammer is one candle with a small body near its high and a long lower wick after a decline; a doji compares its open and close; an evening star is a three-candle sequence after a rise. Their names alone do not confirm a reversal.
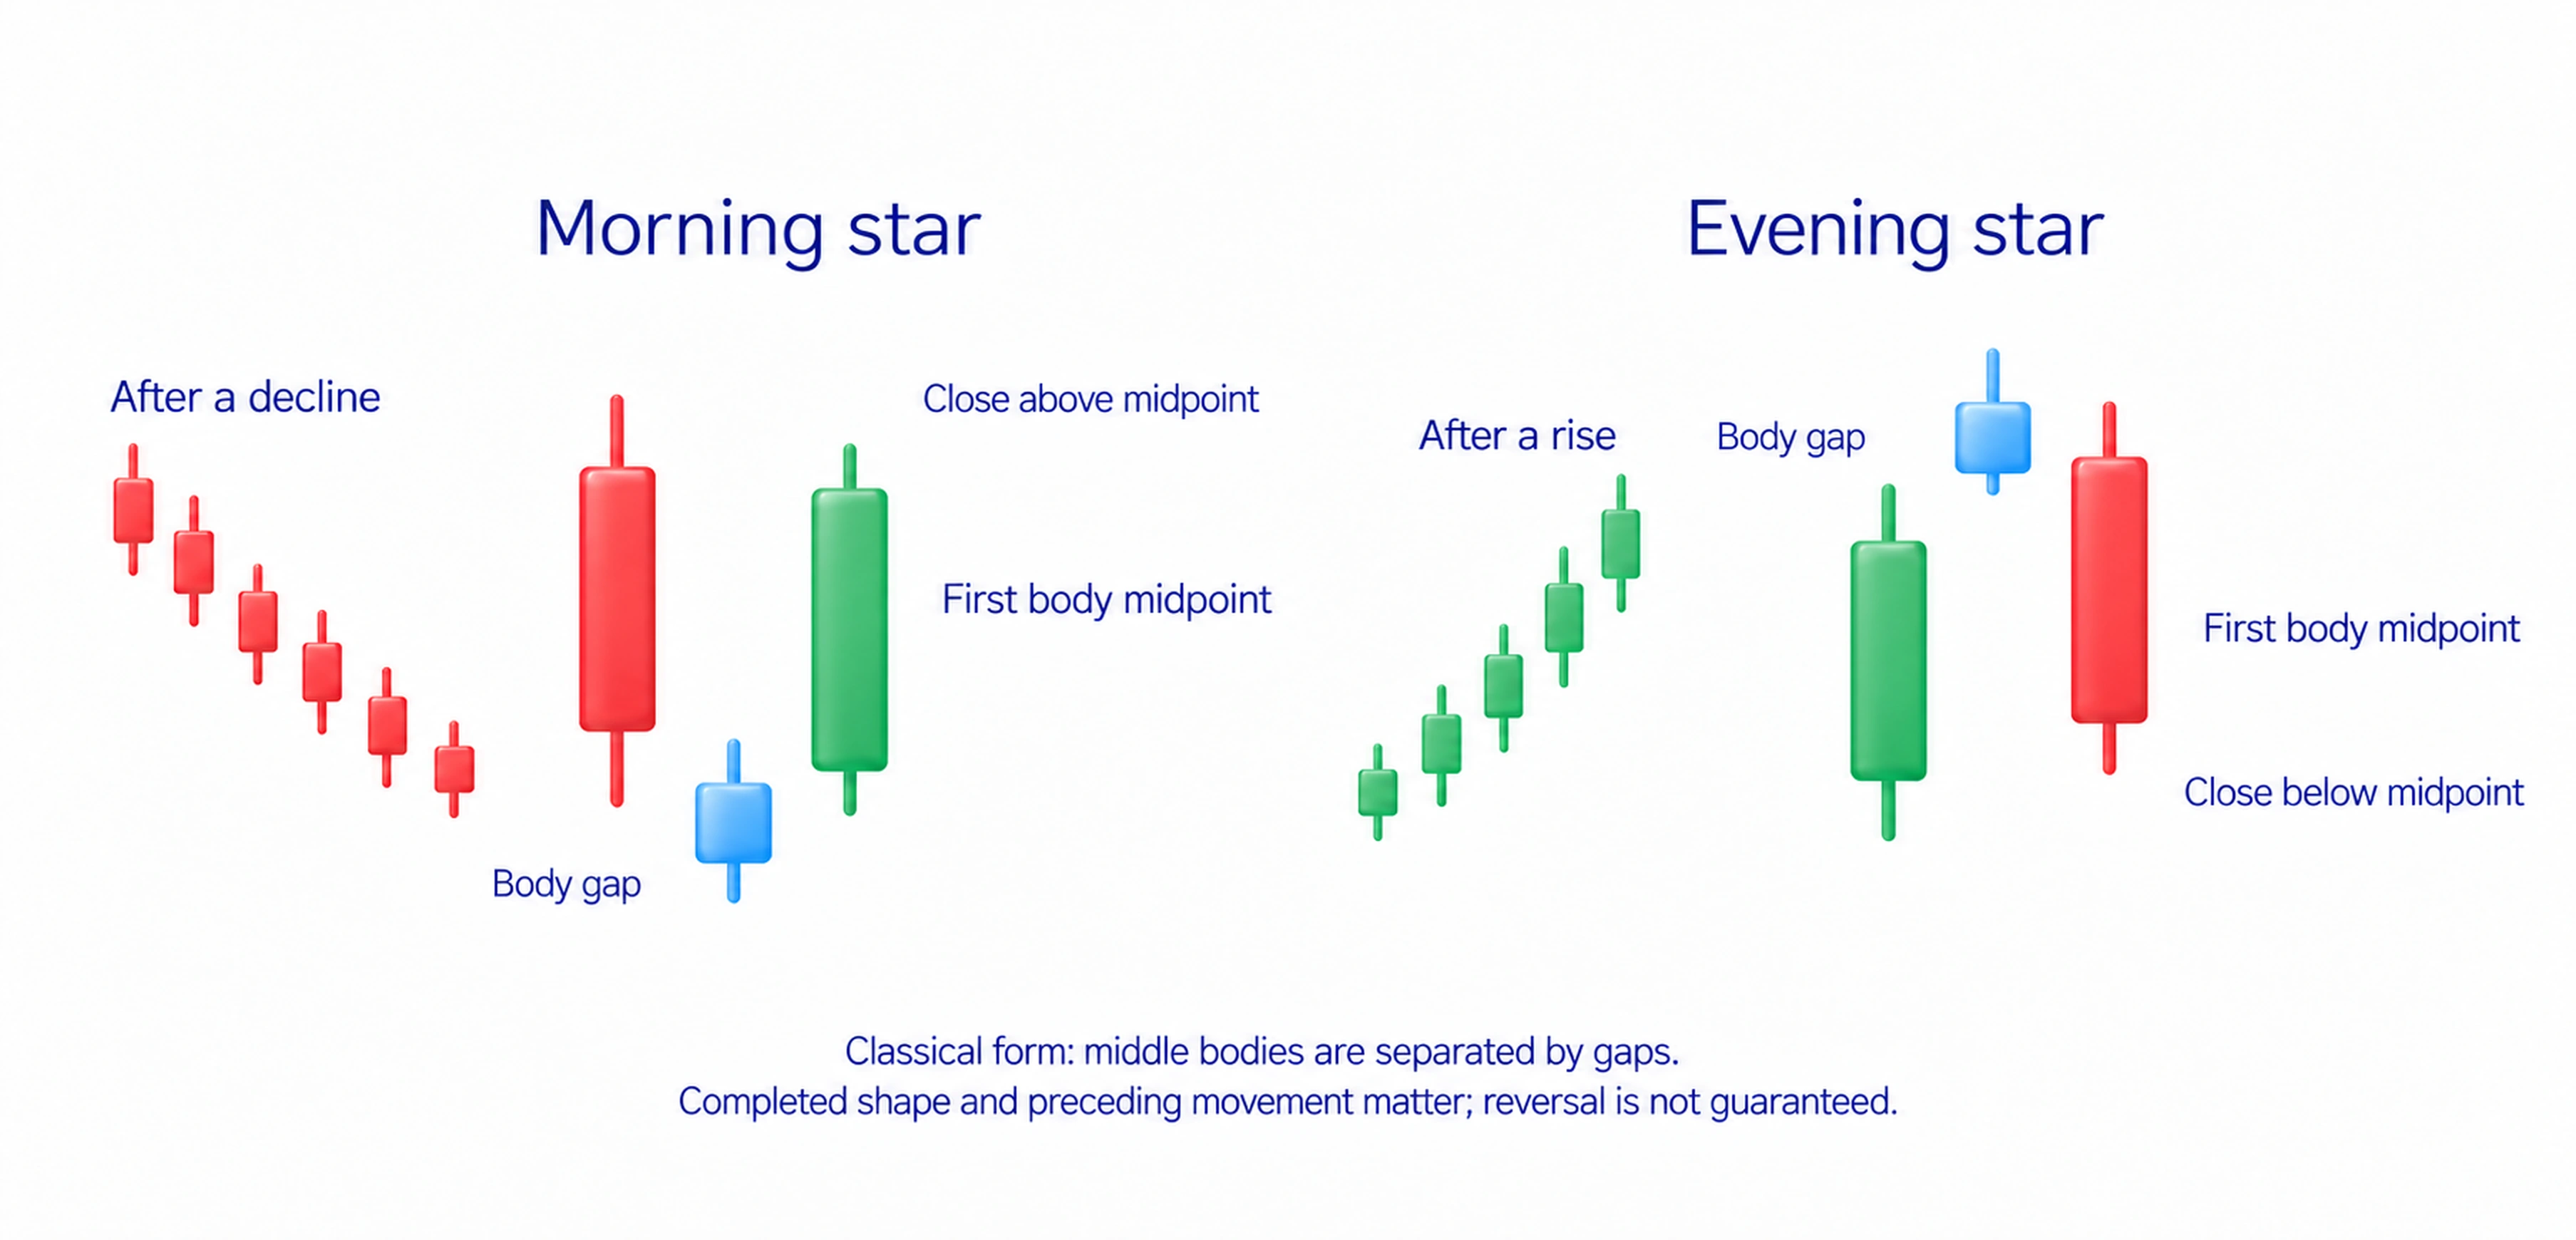
An evening star is examined after a rise. It has a large upward candle, a small middle candle and a downward third candle closing well inside the first body. In the classical form, the middle body is separated above the first body by a gap. The bodies do not overlap, although their wicks can.
A morning star reverses the arrangement after a decline: a large downward candle, a small middle body separated below it and an upward third candle closing into the first body. A common strict confirmation rule requires the third close beyond the first body's midpoint, upward for the morning star and downward for the evening star.
Markets trading almost continuously may not produce the classical gaps. A gapless three-candle sequence can show a similar pause and change, but it does not meet every condition of the strict pattern. Define any simplified version before testing it. Do not change the criteria after seeing the outcome.
How to assess a candlestick pattern
Start with the preceding movement and the pattern's location. Support is an area where price previously turned upward; resistance is an area of downward reactions. Mark the area before the pattern appears. Drawing a convenient level afterward changes the test to fit the result.
Then compare the movement with trading volume, the shares or contracts traded during the period. Heavy activity with little progress differs from heavy activity followed by continued movement. Volume does not identify a participant or turn every candle into a reliable signal. The volume-analysis material explains how to compare these observations and check the data source.
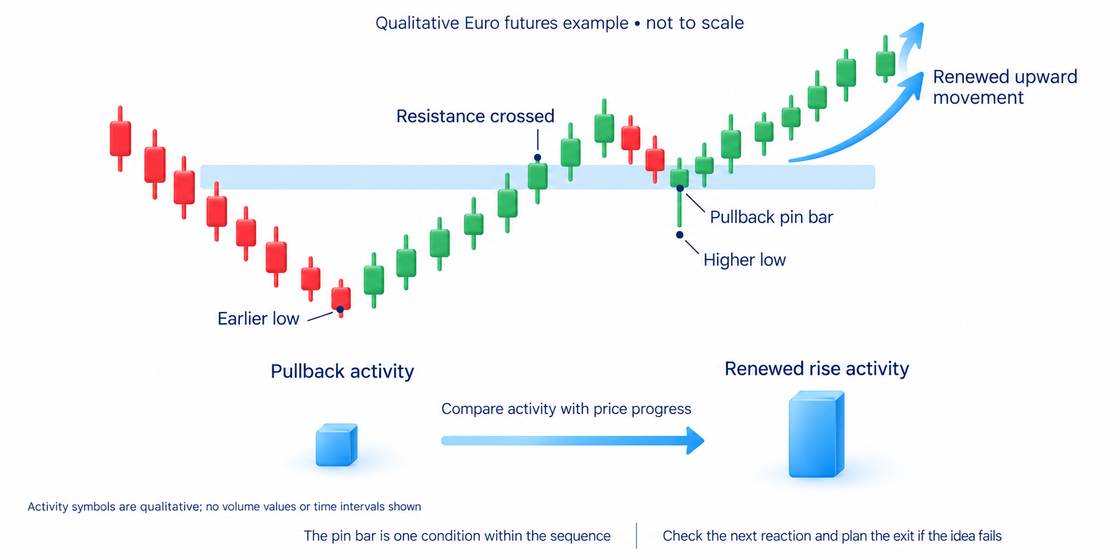
In the course's trading-system example on Euro futures, a bullish pin bar appears on the pullback after resistance has been crossed. The test produces a higher low, followed by renewed upward movement and its volume. I read the pin bar within that sequence. Its shape describes the local reaction; it does not replace the other conditions.
The video on using a pin bar shows how I relate the wick to the trend and level, including the planned exit if the idea fails. The written explanation remains sufficient without viewing it. Larger formations built from many candles have their own chart-patterns guide.
A candle at support: worked example
Consider a hypothetical share quoted in US dollars. Price had previously turned upward near $100. After another decline, an hourly candle opens at $101.50, records a low of $98 and a high of $102, then closes at $101.80. Its small body sits near the top of the range, with a much longer lower wick: it meets the shape to examine as a bullish pin bar.
The candle records a move below the earlier area and a close back above it. It does not tell you how many stops triggered or who bought. Decide in advance what further confirmation you require, such as another pullback holding the area followed by upward movement. Then check the next candles against that condition.
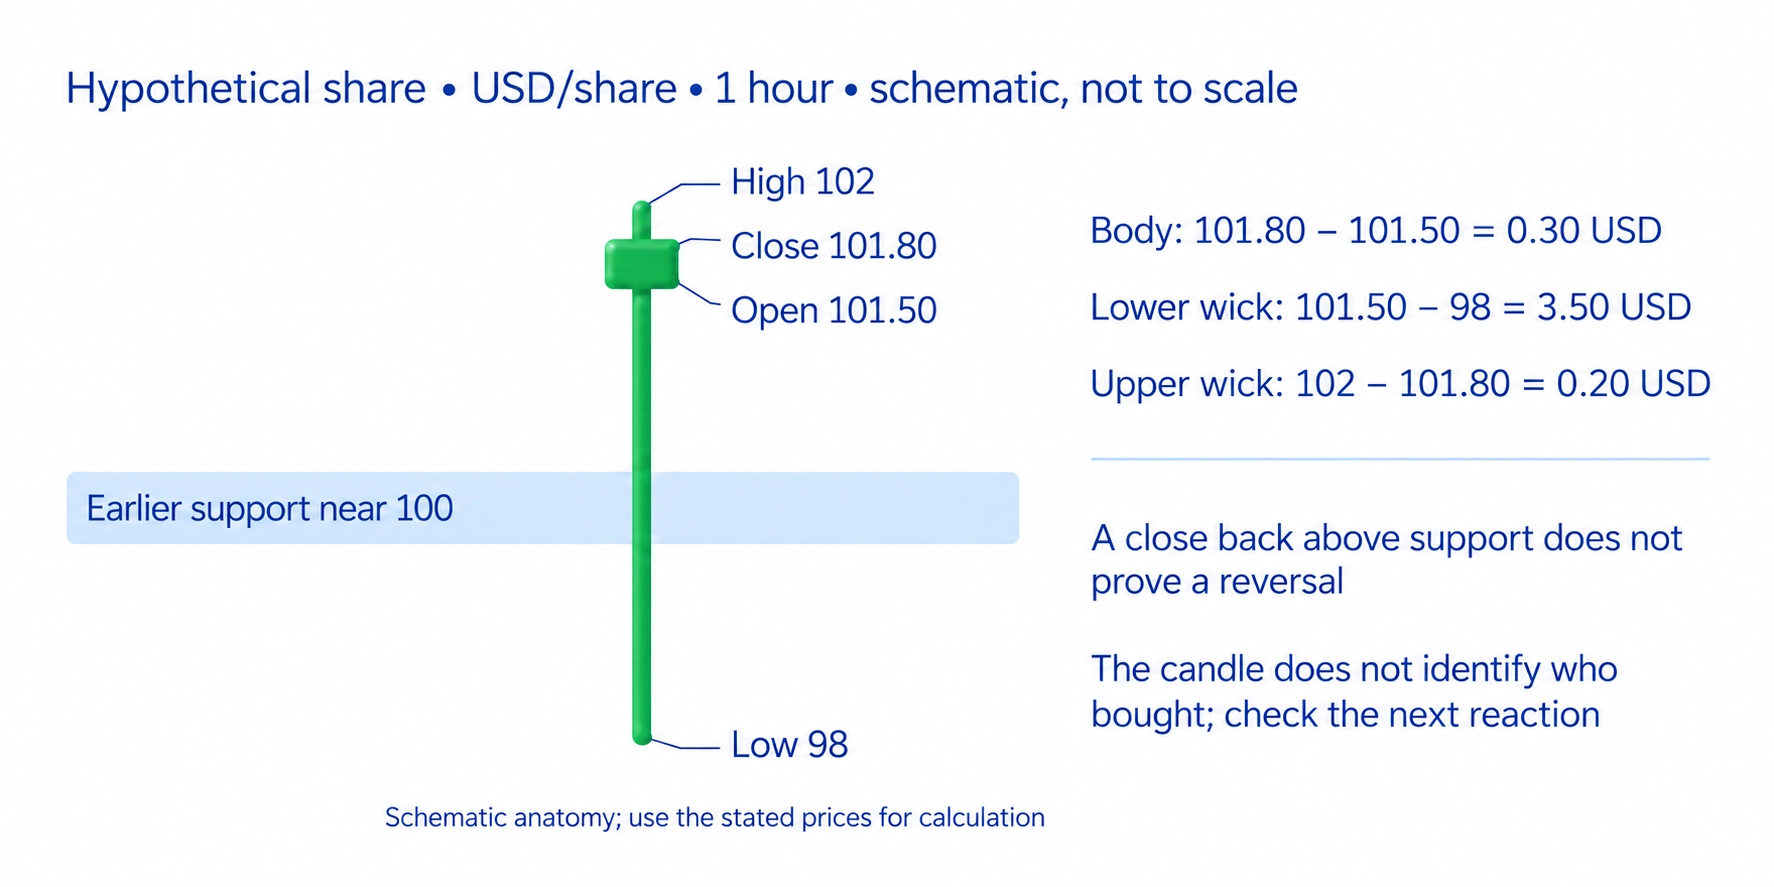
If a purchase is being considered after the check, the planned exit should match a failure of that idea, for example renewed movement below the observed $98 low. The closest possible stop is not automatically the best one. Size the position for the necessary exit distance and allow for the fact that actual stop execution can differ. Risk management explains that sizing process.
If later candles move below support and the decline continues, the expectation of a hold was not confirmed. The original pin bar recorded a return during one hour. It cannot cancel what happened afterward or become proof of a reversal simply because the shape looked convincing.
How to practise without fitting the outcome
Practise with one pattern and write down its conditions before revealing subsequent candles. Record the period, preceding movement, location and required confirmation. If software marks patterns for you, inspect its recognition settings: different conditions can select different candles on the same chart.
Keep failed cases as well as favourable reactions. Assessing a trading rule also requires consistent entry and exit conditions, costs and all selected observations. A pattern name supplies neither a universal fifty-fifty probability nor a promised profit. The useful first test is whether you can apply the same definition without changing it when the result disappoints you.
Frequently asked questions
It shows the open, high, low and close for the chosen period. The body connects the open and close; the wicks reach the extremes. Those four prices do not reveal the entire sequence within the period.
Pin bars, engulfing, harami, hammers, doji and stars offer a useful starting set. Learn how their shapes differ and where they are examined. The name alone does not supply a trade or a fixed probability of success.
A pin bar is one candle with a small body and long wick. Engulfing uses two candles, with the second body spanning the first in the opposite direction. Both need the preceding movement and location to interpret them.
Its opening and closing prices are close. There may still have been wide movement between them. A doji does not tell you which direction the next candle will take.
In my approach, I check the level, preceding movement, volume and subsequent reaction. Before entering, I also identify what would invalidate the idea and where I would exit. One candle's shape does not replace that sequence.
A harami requires the second body to sit inside the first body. An inside bar requires the second high and low to remain inside the previous full range. Check the right boundaries for the pattern you are testing.
About the author
Igor Arapov, a practising trader since 2013 and author of the ArapovTrade library. ORCID: 0009-0003-0430-778X.




