A chart pattern is a recurring arrangement of price swings and pauses. Its outline helps describe a possible change in movement. The shape does not cause that change or guarantee that a trade will work.
To read a pattern, identify its turning points, check the preceding movement and decide what would complete or cancel the setup. Those steps turn a familiar drawing into an observation you can check against the next prices.
Reversal and continuation patterns
A reversal pattern describes a possible change in an existing trend. A continuation pattern describes a pause followed by a possible resumption. A trend is a directional move; without one beforehand, there is no established direction to reverse or continue.
Begin with the sequence of peaks and troughs. In an uptrend, successive highs and lows rise; in a downtrend, they fall. In a range, price moves between roughly the same boundaries. The chart-reading guide explains this starting point.
A pattern made from several price swings differs from a candlestick pattern, which uses the shape of one or a few candles. A long wick records an extreme reached during that candle's period. It does not replace the sequence of highs and lows in a larger structure. The candlestick-patterns guide covers those smaller formations.
Head and shoulders, double tops and bottoms
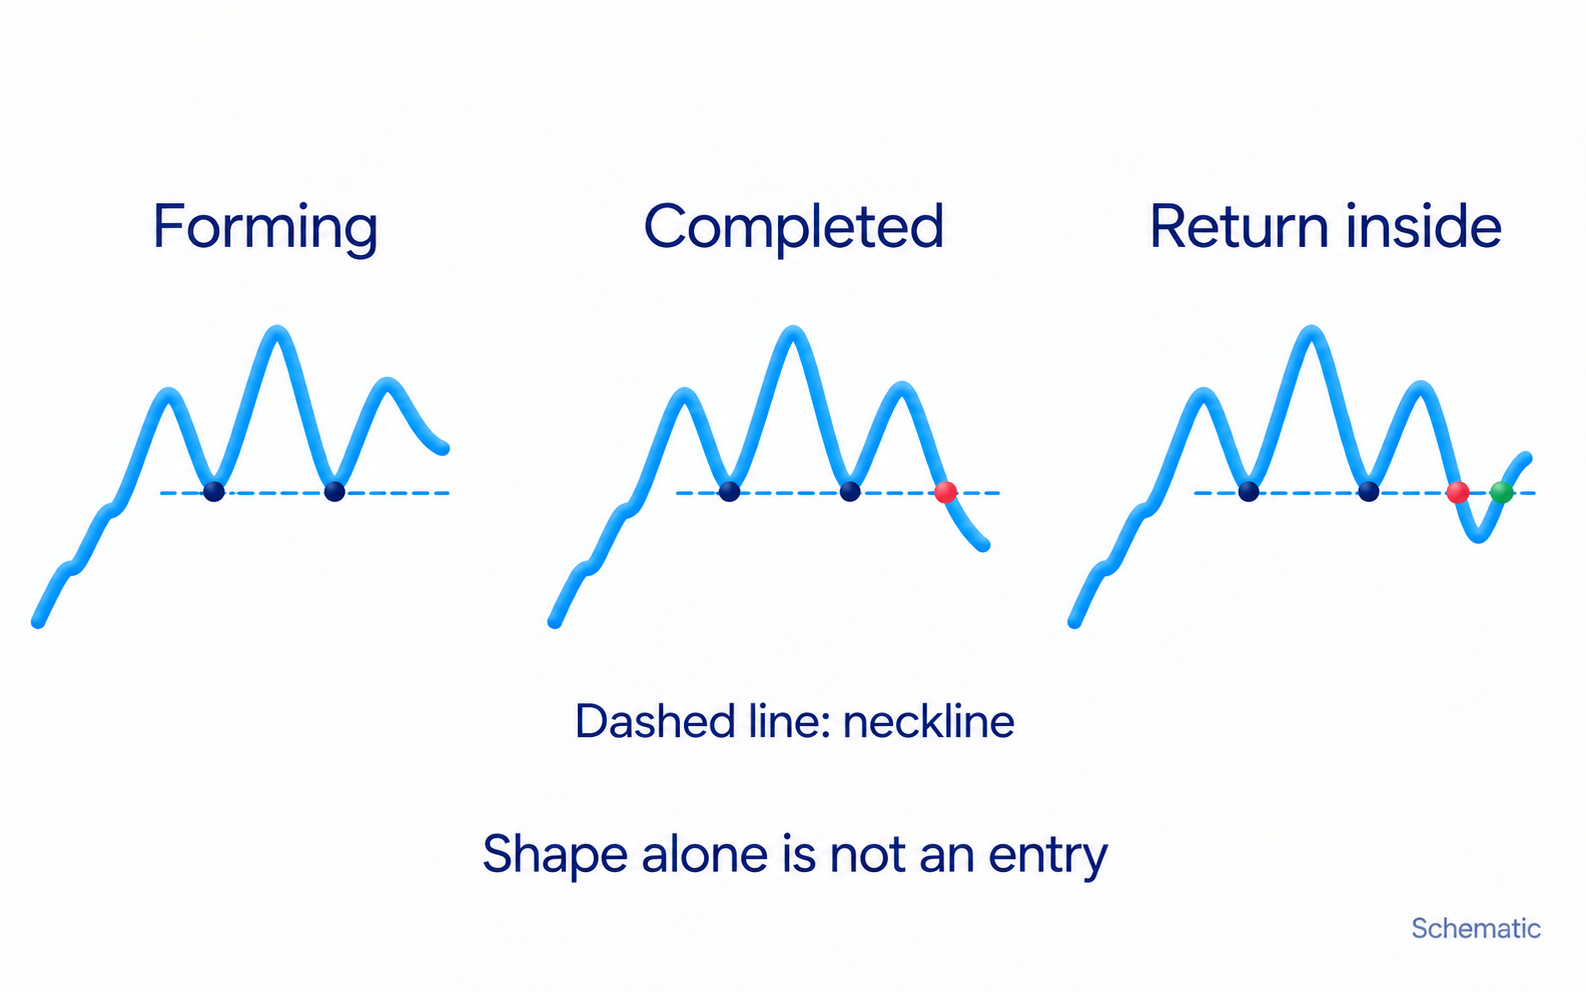
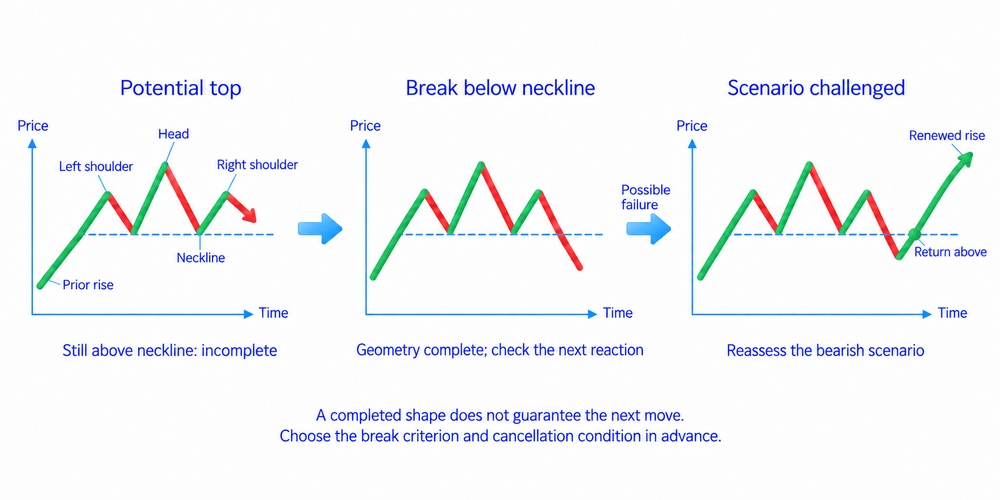
A head-and-shoulders top follows a rise and has three peaks, with the middle one higher than the other two. Join the two intervening troughs to draw the neckline. This line can be horizontal or sloping; the shoulders need not match exactly.
Before price breaks below the neckline, the shape is a potential reversal pattern. A break followed by further decline supports the downward-reversal setup. A return above the line and renewed rise challenges it. Do not add another shoulder simply to preserve a forecast that failed.
An inverse head-and-shoulders pattern follows a decline. The middle trough is deeper than the outer two, and the neckline joins the two intervening highs. Check for an upward break and the next reaction above that area. Price may retest the neckline, but it does not have to.
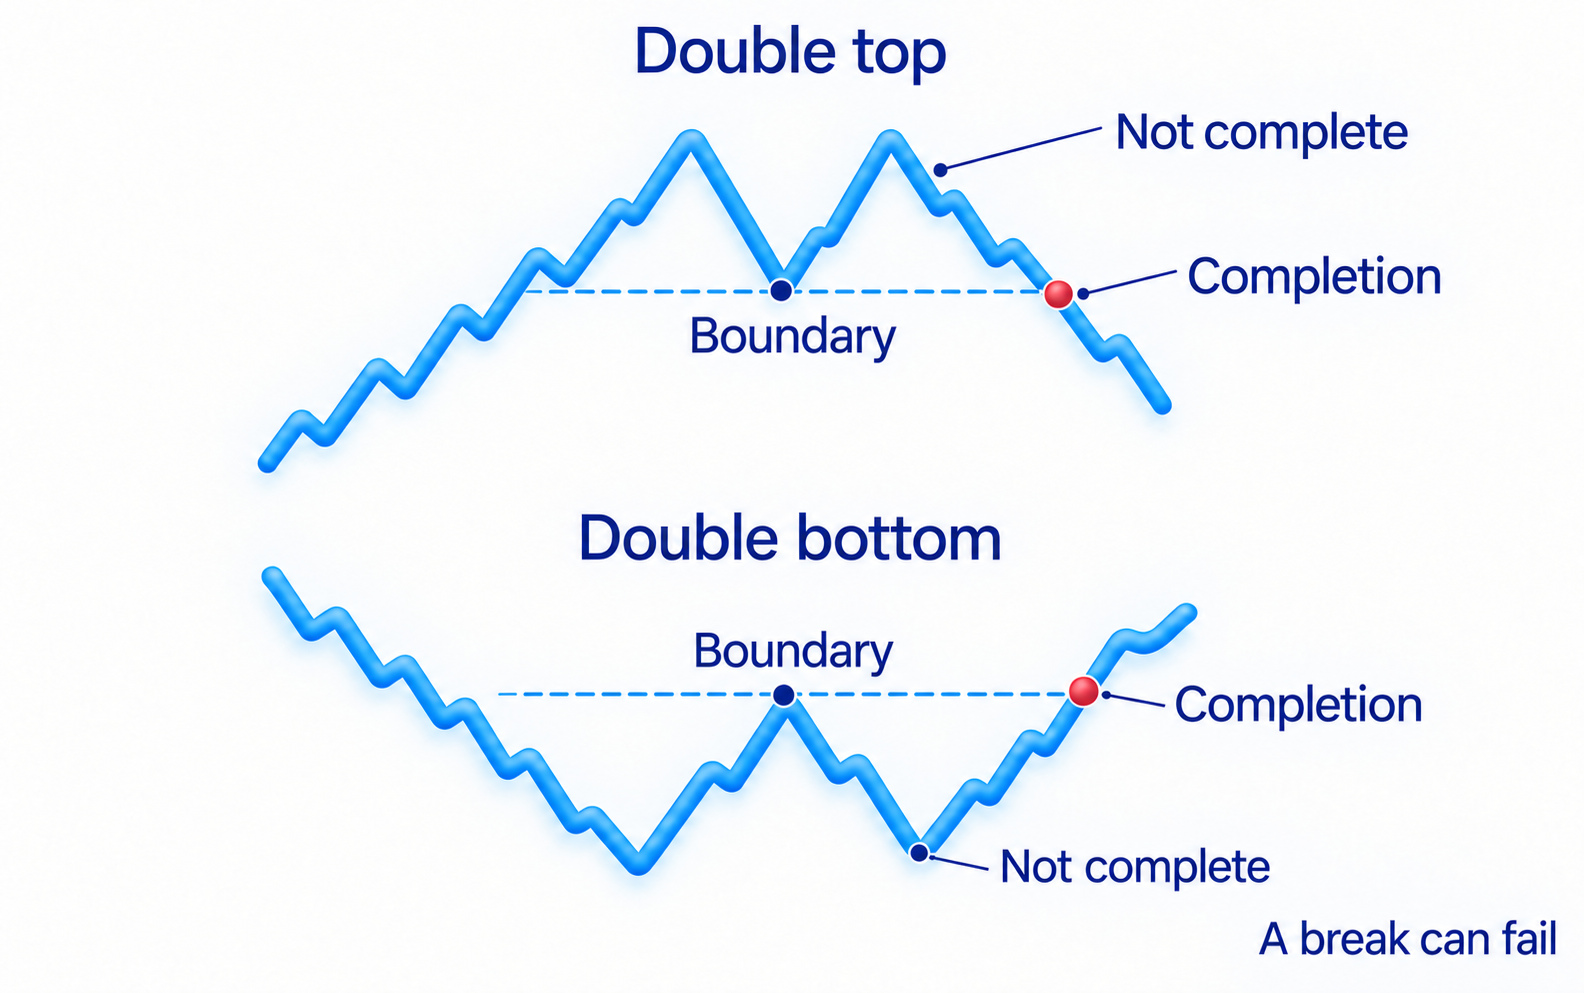
A double top has two nearby highs after a rise, separated by a trough. Two touches of resistance do not complete a reversal: price may stay in a range and later rise above it. The conventional completion point is a break below the intervening trough.
A double bottom is the opposite structure after a decline: two nearby lows with a rebound high between them. Until price rises beyond that high, the reversal is unconfirmed. A third top or bottom forms a triple pattern, using the same idea of checking the boundary between the turning points.
Treat the outer turning points as an area rather than demanding an exact match. Set any permitted difference beforehand for the instrument and chart period. Widening that allowance after every new high makes the classification fit the outcome instead of testing the pattern.
Triangles, wedges and rectangles
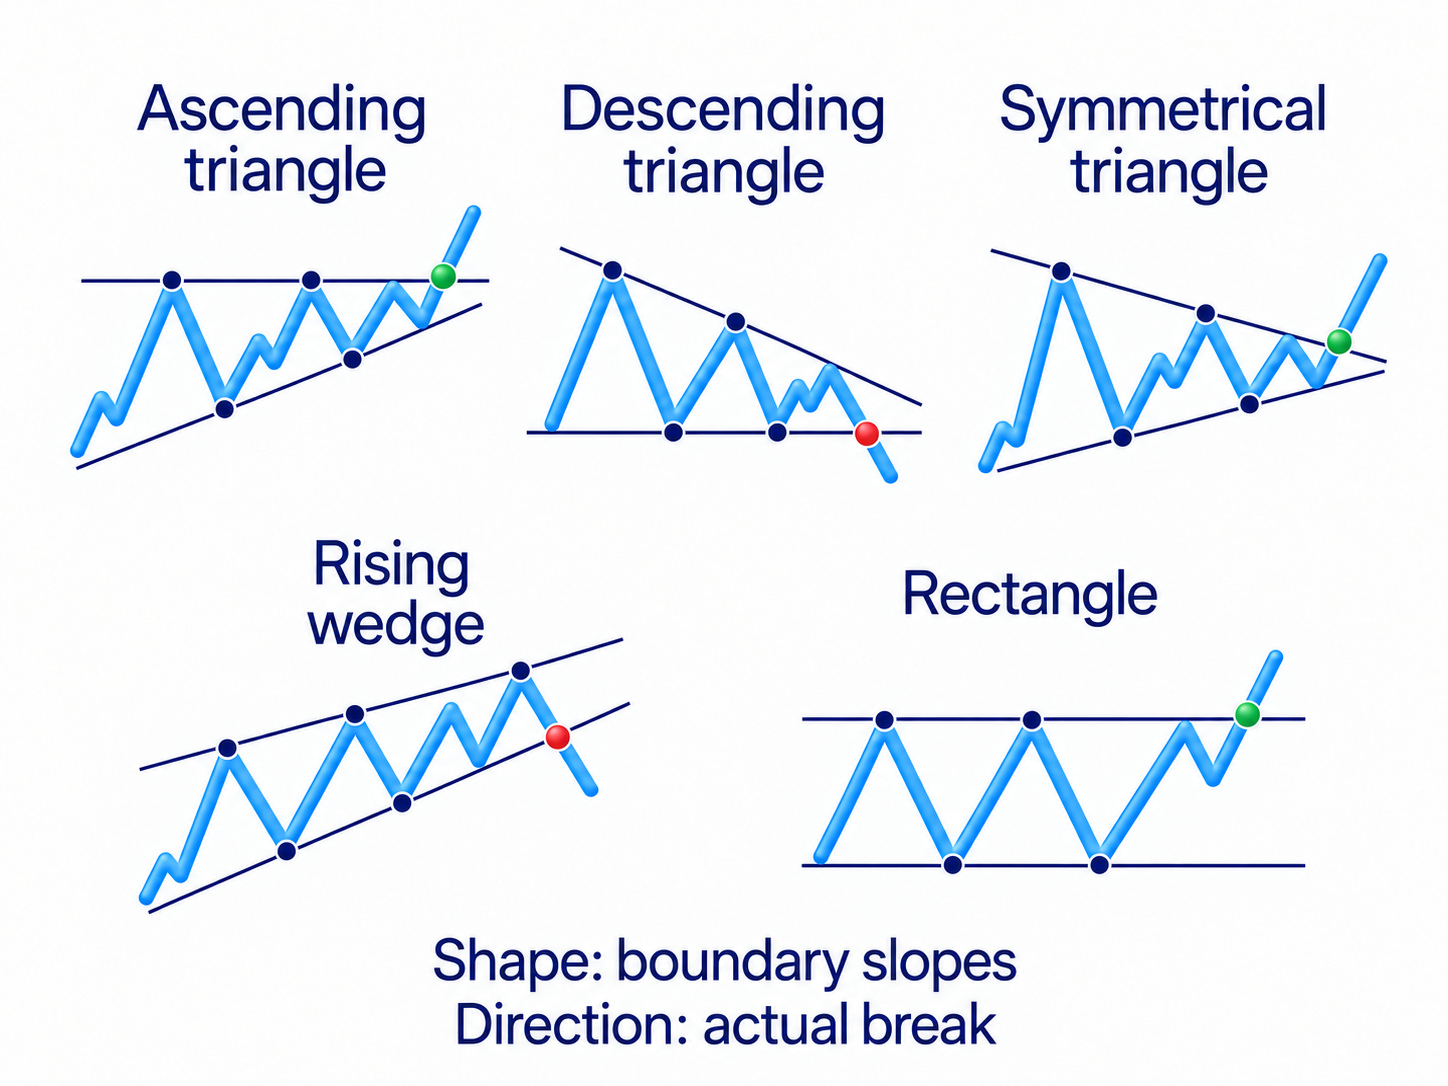
A triangle forms when the price range narrows between two converging boundaries. Each line needs at least two separate turning points with a move between them. Two adjacent candles near the same price do not establish the whole structure.
An ascending triangle has a roughly horizontal upper boundary and rising lows. A descending triangle has a horizontal lower boundary and falling highs. In a symmetrical triangle, highs fall while lows rise. The slopes describe the shape; they do not guarantee which side price will break.
A wedge also has converging boundaries, but both slope in the same direction. A rising wedge has rising highs and lows; a falling wedge has falling highs and lows. That differs from a symmetrical triangle, whose upper and lower lines slope towards each other from opposite directions.
The conventional reading gives a rising wedge a downward bias and a falling wedge an upward bias. An upward slope is therefore not, by itself, a buy signal; a downward slope is not a sell signal. Check which boundary actually breaks and how price behaves afterwards.
A rectangle has several swings between roughly horizontal upper and lower boundaries. Its range does not narrow substantially as a triangle's does. After a trend, that pause can support a continuation hypothesis, but an exit against the earlier direction remains possible.
Flags, pennants and cup-and-handle patterns
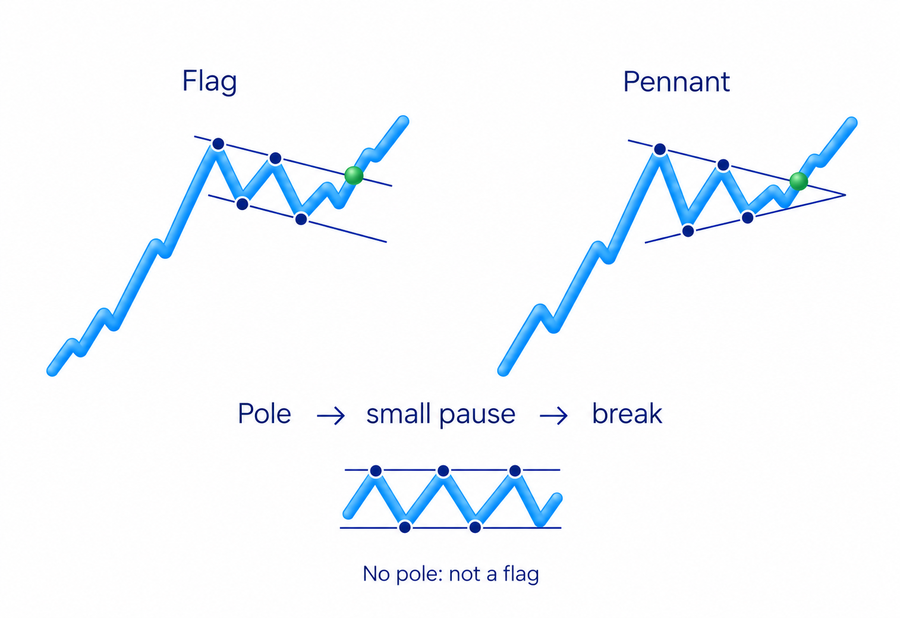
A flag begins with a sharp directional move called the pole. It is followed by a relatively small pullback or pause between roughly parallel boundaries, often sloping against the first move. Without the initial impulse, the outline is simply a channel or range rather than this continuation pattern.
A pennant also follows an impulse, but the boundaries of its brief pause converge. The preceding surge and shorter pause distinguish it from a triangle that develops on its own. A bullish version follows a rise; a bearish version follows a fall. Continuation is checked by an exit in the original direction.
Compare the first move with the following pullback. If the move against the trend becomes as substantial as the impulse, the description of a small continuation pause needs reassessment. A false exit in the opposite direction can occur, but it is not a required stage of every flag.
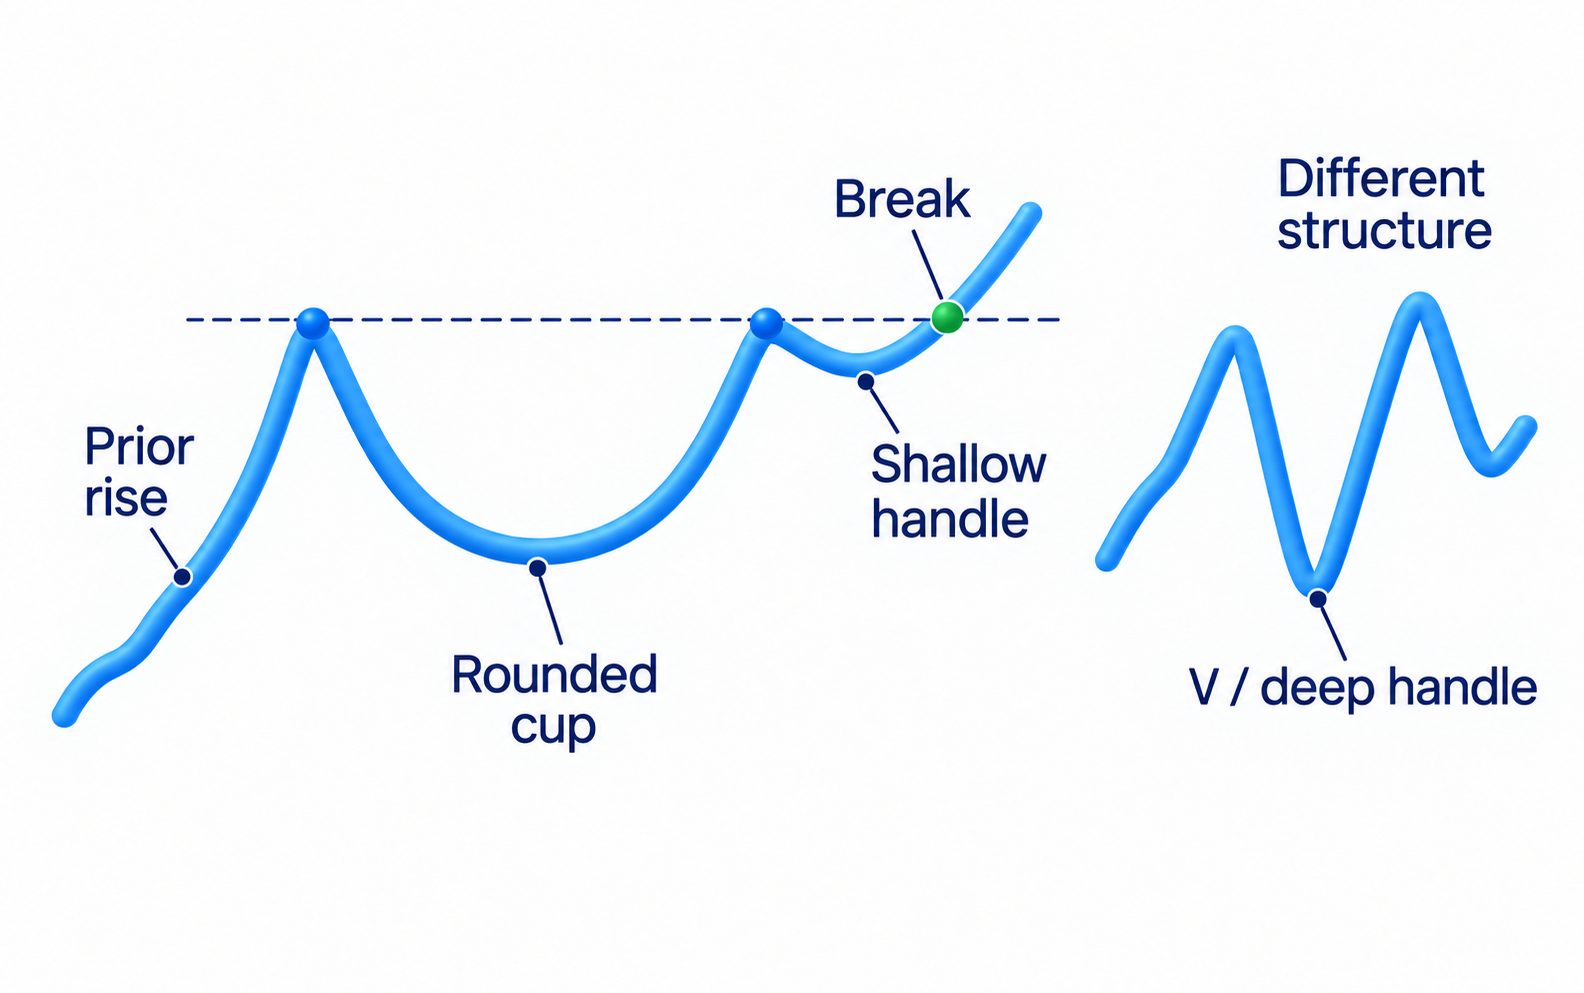
A cup-and-handle pattern has a rounded pullback and recovery towards the earlier upper area, followed by a smaller pullback on the right. That last part is the handle. In the conventional bullish version, traders look for an exit above the handle and the previous resistance area after an earlier advance.
The cup resembles a U rather than a sharp V, and the handle stays relatively shallow near the top of the structure. If the handle falls deep into the cup, reassess whether it still fits that description. A rounded outline without the required exit does not complete the pattern.
William O'Neil used the cup with handle in his approach to selecting growth stocks. That context matters when comparing examples. A long stock-price base and a similar outline on a short cryptocurrency chart are not interchangeable evidence; the latter needs its own rules and testing.
The 1-2-3 pattern and entry choices
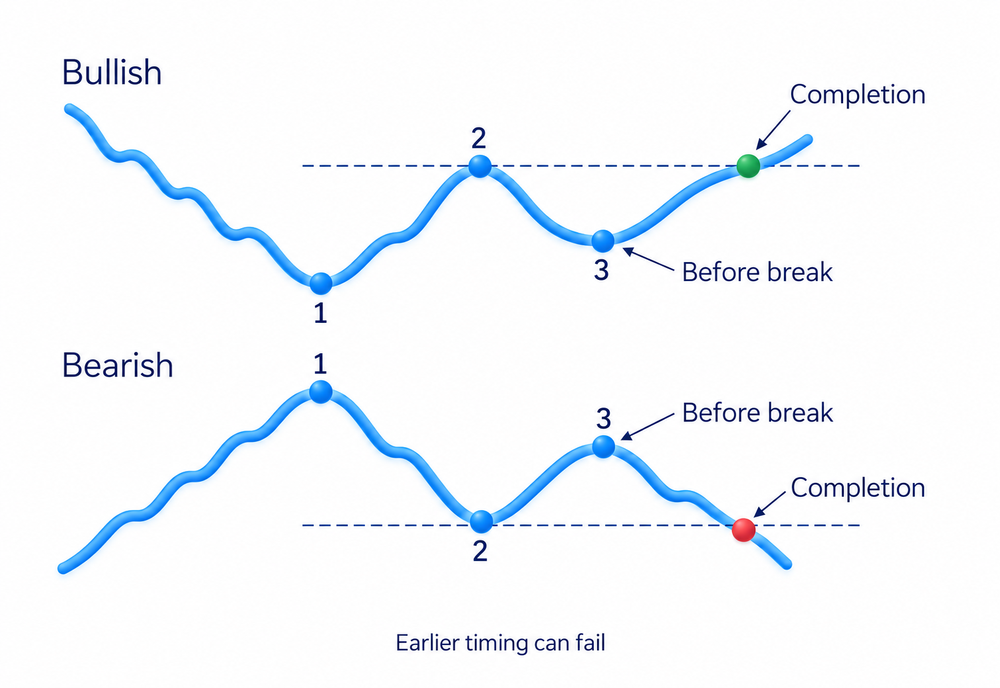
In a bullish 1-2-3 reversal pattern, point 1 is a low in the decline, point 2 is the rebound high and point 3 is a later low above point 1. A move above point 2 completes this geometric structure. Before that break, the attempted recovery can still fail.
In the bearish version, point 1 is the high of a rise, point 2 is the pullback low and point 3 is a lower high. The completion event is a break below point 2. These labels describe prices; they do not reveal which fund bought or sold at each point.
Entering near a possible point 3 is an early plan, before the break beyond point 2. It can leave a shorter distance to the point that cancels the setup, but it also allows the old trend to continue. Waiting for the break observes a later stage and may mean a worse entry price. Neither choice is automatically more profitable.
For an early purchase, state which move would cancel the expected higher low. If you wait for a break above point 2, do not count it as completed while price remains below it. Choosing the condition and calculating the monetary risk are different tasks; the risk-management guide covers the second.
How to check the break and measure a reference
Before the signal appears, decide what counts as a break: a brief move beyond the boundary or a completed candle closing outside it. For practice, you might use the second rule. Switching between them to select successful examples makes the comparison unreliable.
Watch what happens next. A return inside the range warns that the original setup may have failed. A return to the crossed boundary is a retest, but the return alone does not establish that it holds: check the subsequent reaction. The breakout guide explains these different exit scenarios.
Volume measures the quantity traded, not a participant's identity. Compare activity within the pattern, during the exit and on the return using consistent data and chart periods. Increased volume can support the observation but cannot guarantee continuation. The volume-analysis material explains the data and comparison limits.
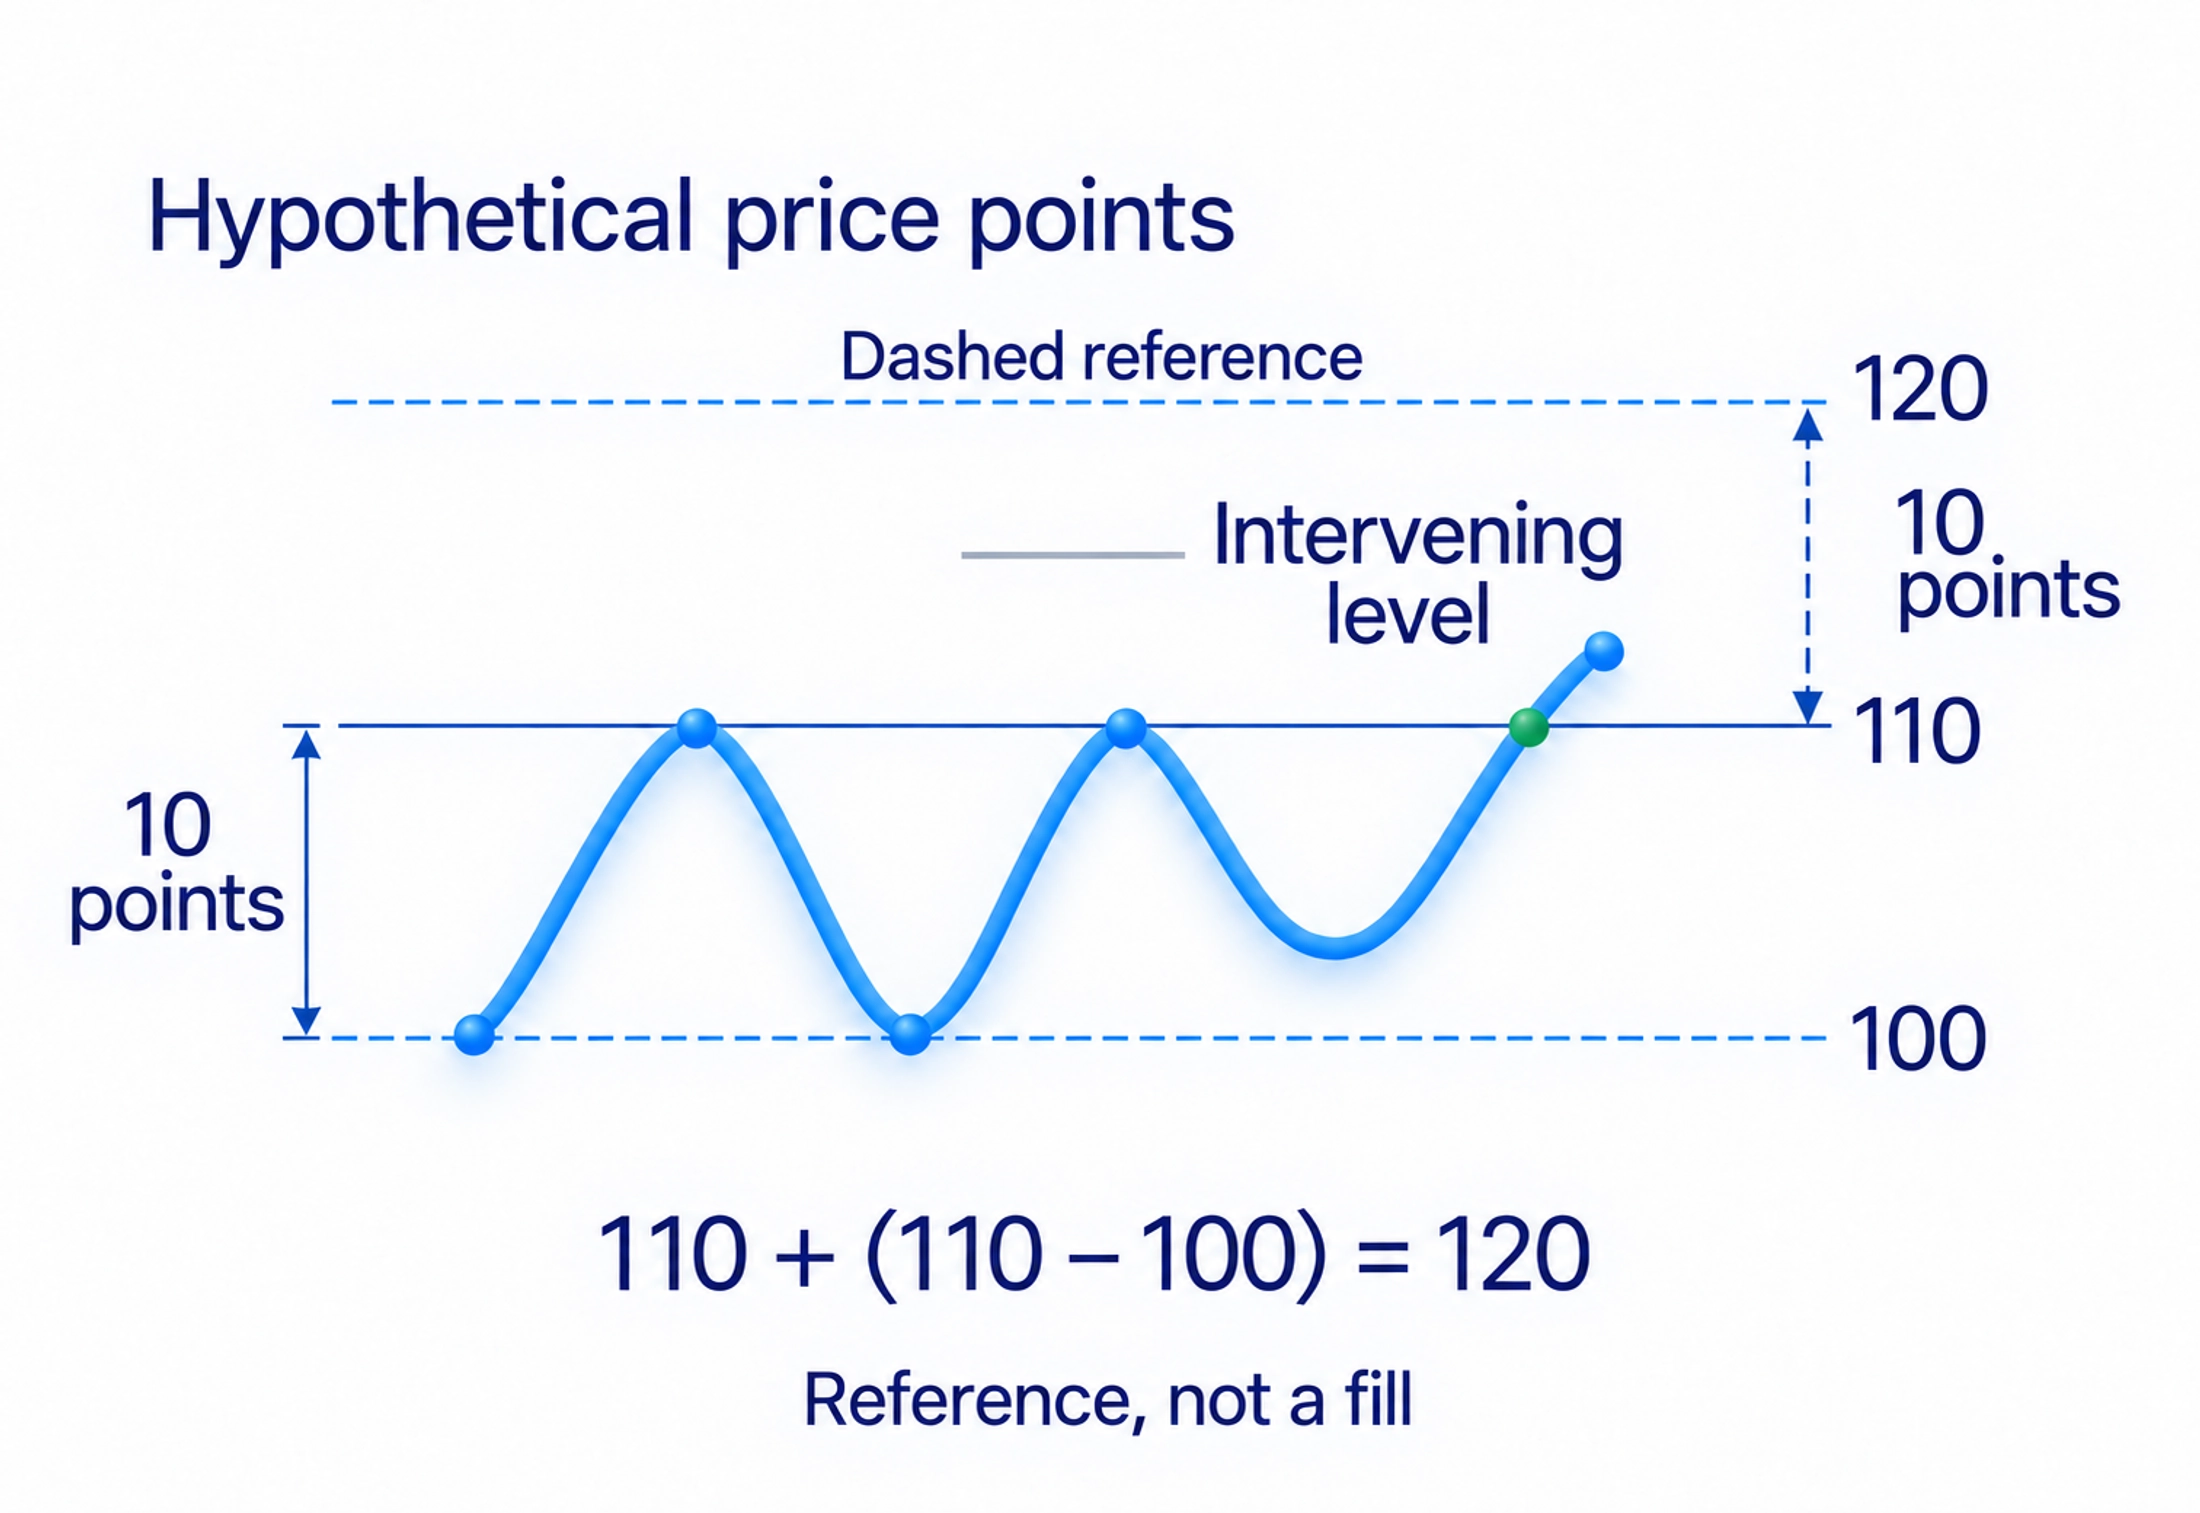
For several conventional patterns, a measured reference projects the pattern's height from the breakout area. For head and shoulders, measure from the head to the neckline; for a double top or bottom, from the outer turning area to the intervening boundary. A triangle uses its widest price span, while a flag commonly uses the initial impulse length. These are projection conventions, not promised profits.
Consider a hypothetical rectangle with prices expressed in points: its upper boundary is 110, its lower boundary is 100 and the upward exit is through 110. The height projection is 110 + (110 − 100) = 120 price points. That places a reference on the chart, not a guaranteed trade fill or destination. Intervening resistance may stop the move sooner.
Before entering, mark the event that would make the setup inconsistent with the next prices. A protective stop depends on that condition and the selected entry, rather than the pattern's name. Its actual fill can differ from the stated price; the order-types guide explains why.
How I use patterns in practical analysis
I do not base a decision on a recognisable outline alone. In the course's reversal example, a declining market fails to make a new low and then breaks the active priority-change level. This is my name for the area from which a directional move began that exceeded an earlier high or low. Breaking that area prompts a check of whether the previous structure still holds.
In the course schematic, resistance breaks and becomes a potential support area as a new bullish structure forms. The learning task is to check the sequence of highs, lows and the level's changing role. The outline can vary. This example does not supply a separate set of numerical rules for every cup or head-and-shoulders pattern.
The video on the limits of chart patterns explains my caution about decisions based only on an outline. My rough “50/50” assessment is not a measured success rate for every pattern. A useful rate requires a specified instrument, chart period and unchanged testing rules. The video is an optional practical addition to the written explanation.
To check your reading, hide the future candles. Mark the prior move, turning points, boundary, break criterion and cancellation condition, then reveal price gradually. Record incomplete patterns and failed breaks as well as successful cases. Moving the boundary after the outcome or keeping only attractive examples conceals marking errors.
Frequently asked questions
A chart pattern is a recurring arrangement of price swings and pauses. It usually describes several waves, unlike a candlestick pattern based on individual candle shapes. Resemblance to a drawing does not guarantee the next move.
After an uptrend, check for a downward break of the neckline joining the two troughs between the peaks. Before that break, the pattern is only a potential reversal. A later return above the line can challenge the bearish setup.
Both wedge boundaries converge and slope in the same direction. A symmetrical triangle has a downward upper line and upward lower line; an ascending or descending triangle has one roughly horizontal boundary. Check the actual exit instead of choosing a trade from the slope alone.
Both are short pauses after a sharp move. A flag has roughly parallel boundaries; a pennant's boundaries converge. Without the preceding impulse, the shape does not meet the defining condition of either pattern.
That can be an early setup with a cancellation condition chosen in advance. It is not yet confirmed by the break above point 2. A shorter stop distance alone does not demonstrate an advantage.
There is no single established success rate for all chart patterns. My rough “50/50” assessment concerns the limits of using the shape alone. Evaluate a particular rule on its specified instrument and chart period, including failed cases and trading costs.
About the author
Igor Arapov, a practising trader since 2013 and author of the ArapovTrade library. ORCID: 0009-0003-0430-778X.




