RSI, the Relative Strength Index, compares average upward and downward price changes and puts the result on a scale from 0 to 100. A high reading means upward changes dominate its calculation; a low reading means downward changes dominate. It does not count buyers or predict that price must turn at 30 or 70.
What RSI measures
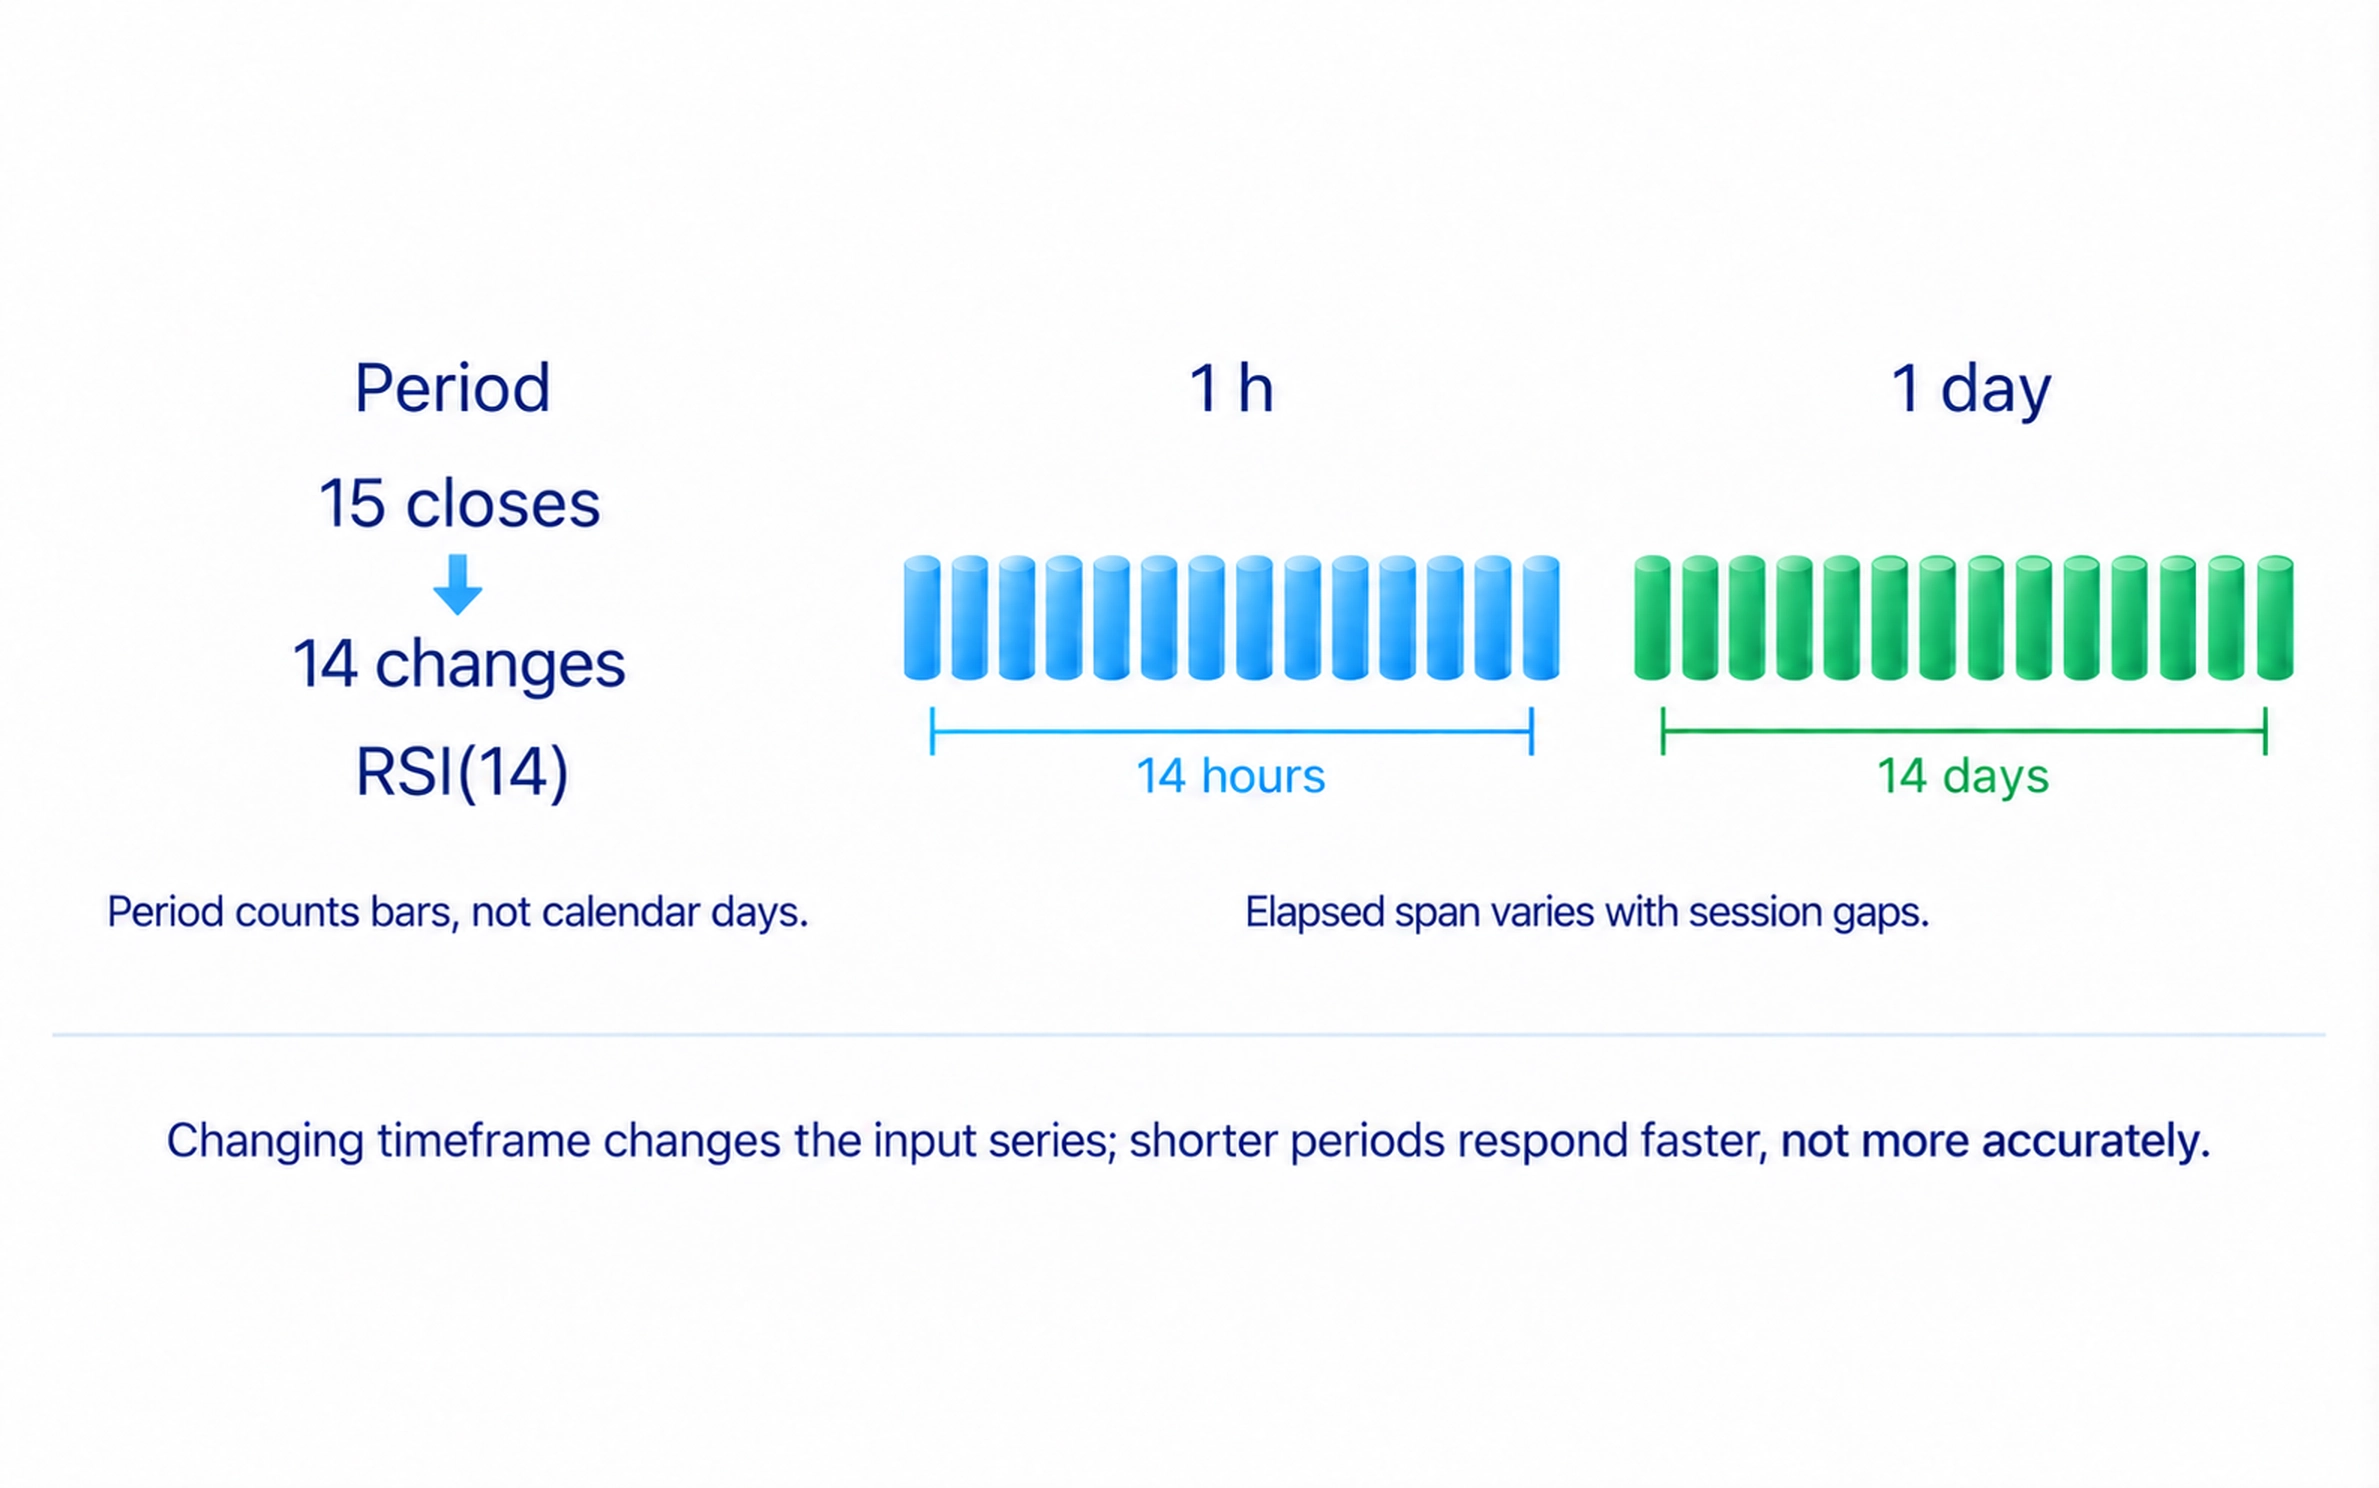
J. Welles Wilder introduced RSI in his 1978 book New Concepts in Technical Trading Systems. It is an oscillator, an indicator with a bounded numerical scale. The usual setting uses closing prices and a length of 14 bars. Each bar represents a period on the chart, such as a minute, an hour or a day, so 14 periods do not always mean two weeks.
RSI measures the size of changes, not just how many bars rose. Several small increases and one large fall can produce a different picture from counting rising and falling bars. A reading of 60 does not mean that 60% of participants are buying or that a trade has a 60% chance of profit. The calculation contains no information about their money or intentions.
The name relative strength refers here to gains versus losses in one instrument's price. Comparing a share with a market index requires a different calculation. The trading-indicators guide explains how RSI fits alongside other ways of processing chart data.
How RSI is calculated
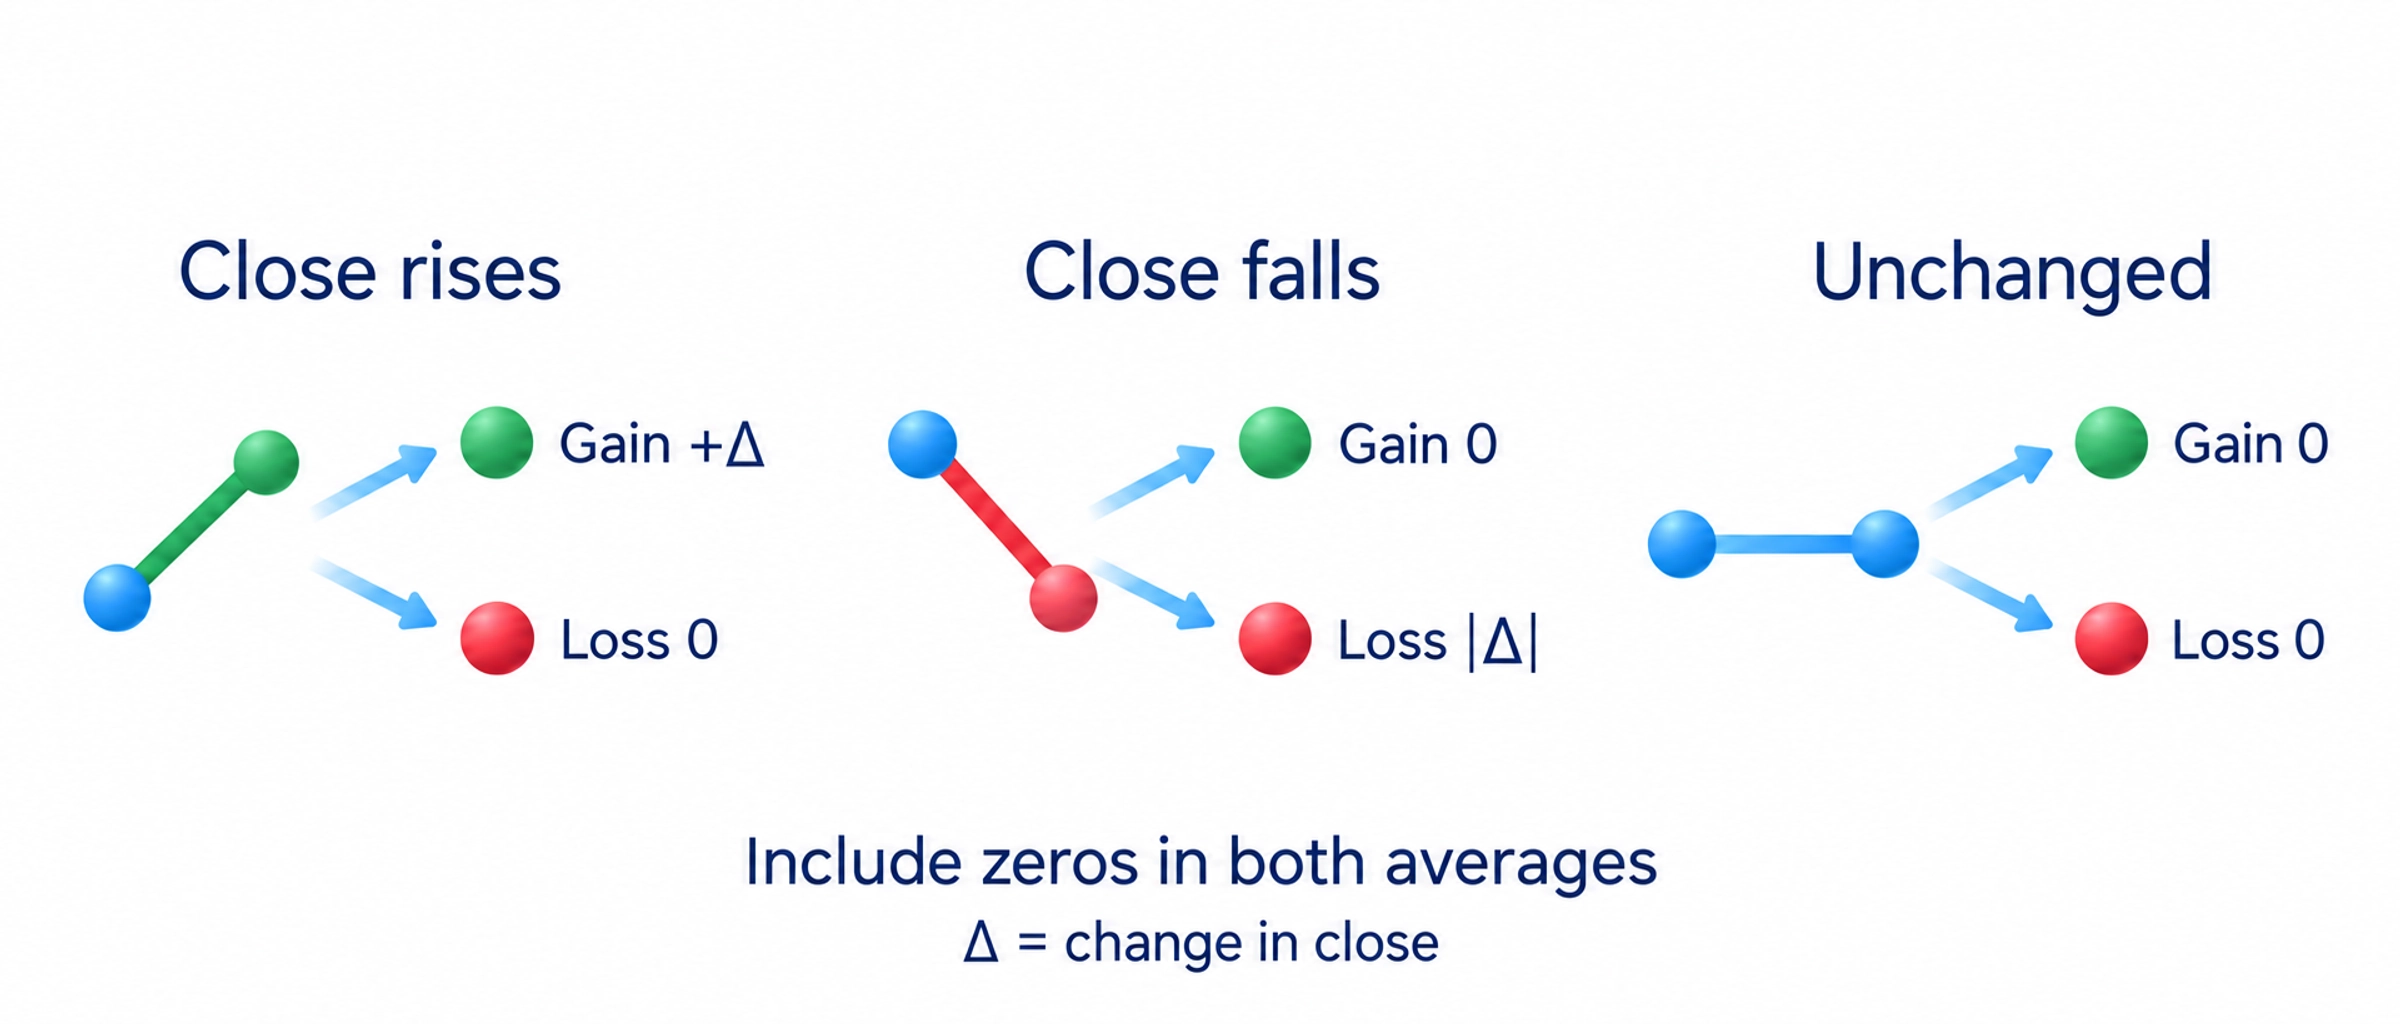
For each bar, subtract the previous closing price from the new close. Record an increase as a gain and a decrease as a positive-sized loss. On a rising bar the loss is zero; on a falling bar the gain is zero. If the close is unchanged, both are zero. Average each complete series separately, keeping these zeros in the calculation.
Wilder's method starts with simple averages over the chosen number of changes. Fourteen changes require 15 consecutive closing prices. Each later average gain equals the previous average multiplied by 13, plus the current gain, divided by 14. Update average loss the same way. This smoothing carries earlier history forward instead of rebuilding a simple average of only the latest 14 bars.
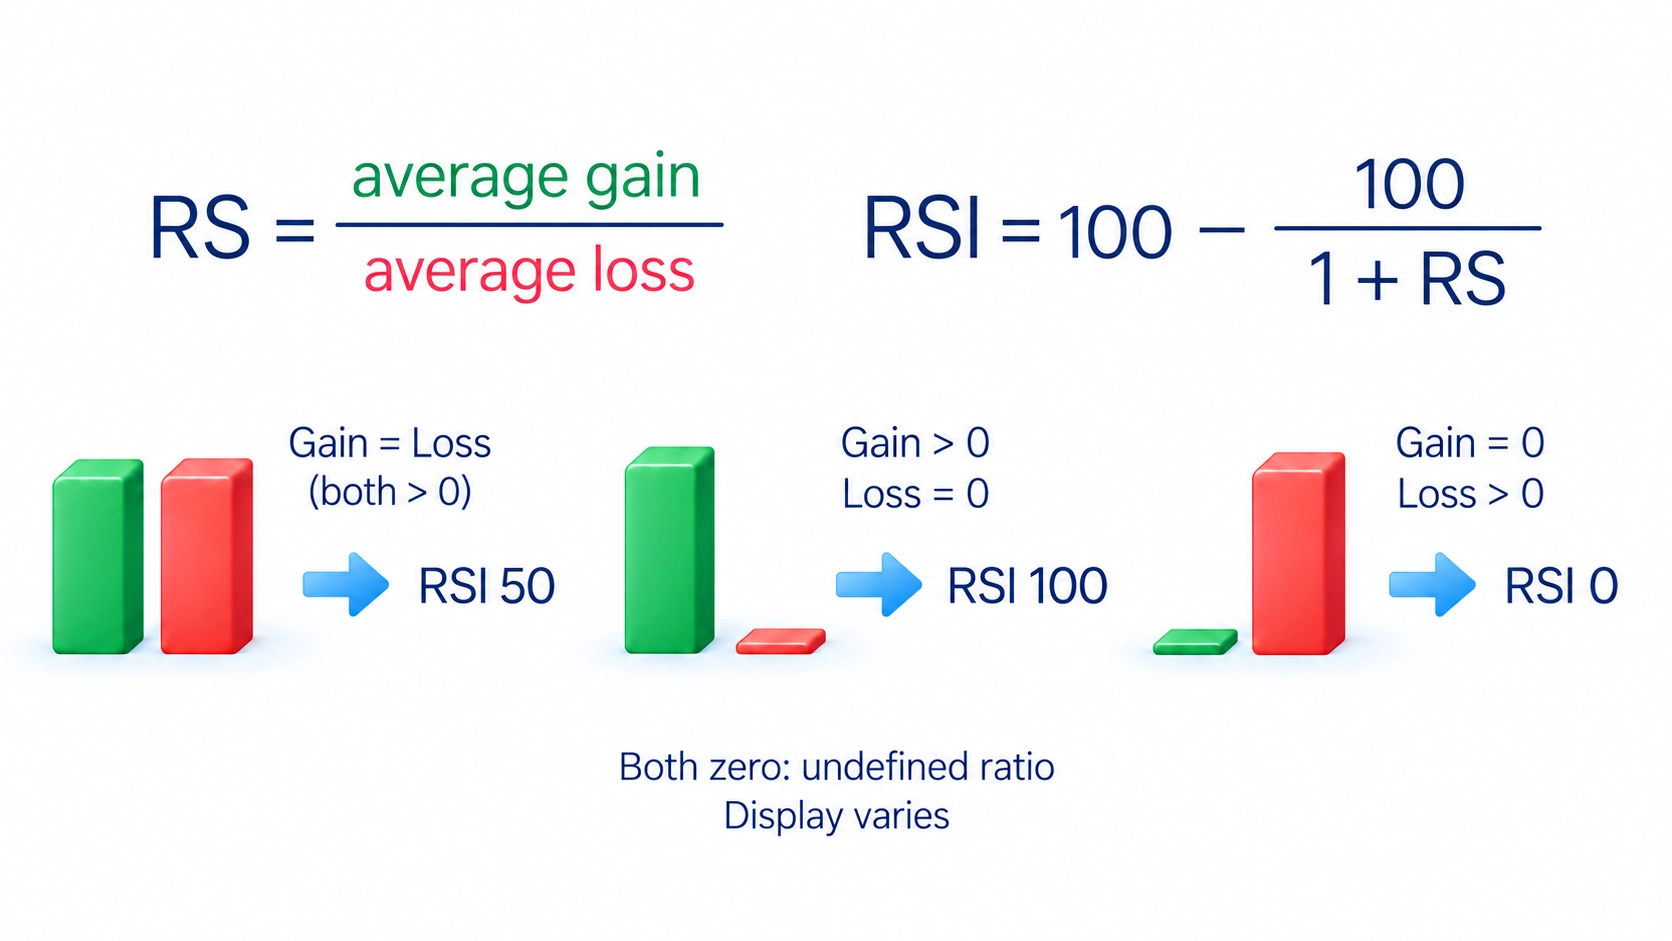
Divide average gain by average loss to obtain RS, then calculate RSI = 100 − 100 / (1 + RS). When both averages are equal and nonzero, RS is 1 and RSI is 50. That shows equality in the calculation, not proof that the price chart has no trend.
If average loss is zero and average gain is positive, RSI is treated as 100. With zero gain and positive loss, it is 0. If both are zero, the original ratio is undefined; what the platform displays on completely unchanged data depends on its implementation. Do not turn that special case into a trading signal.
A simple RSI calculation example
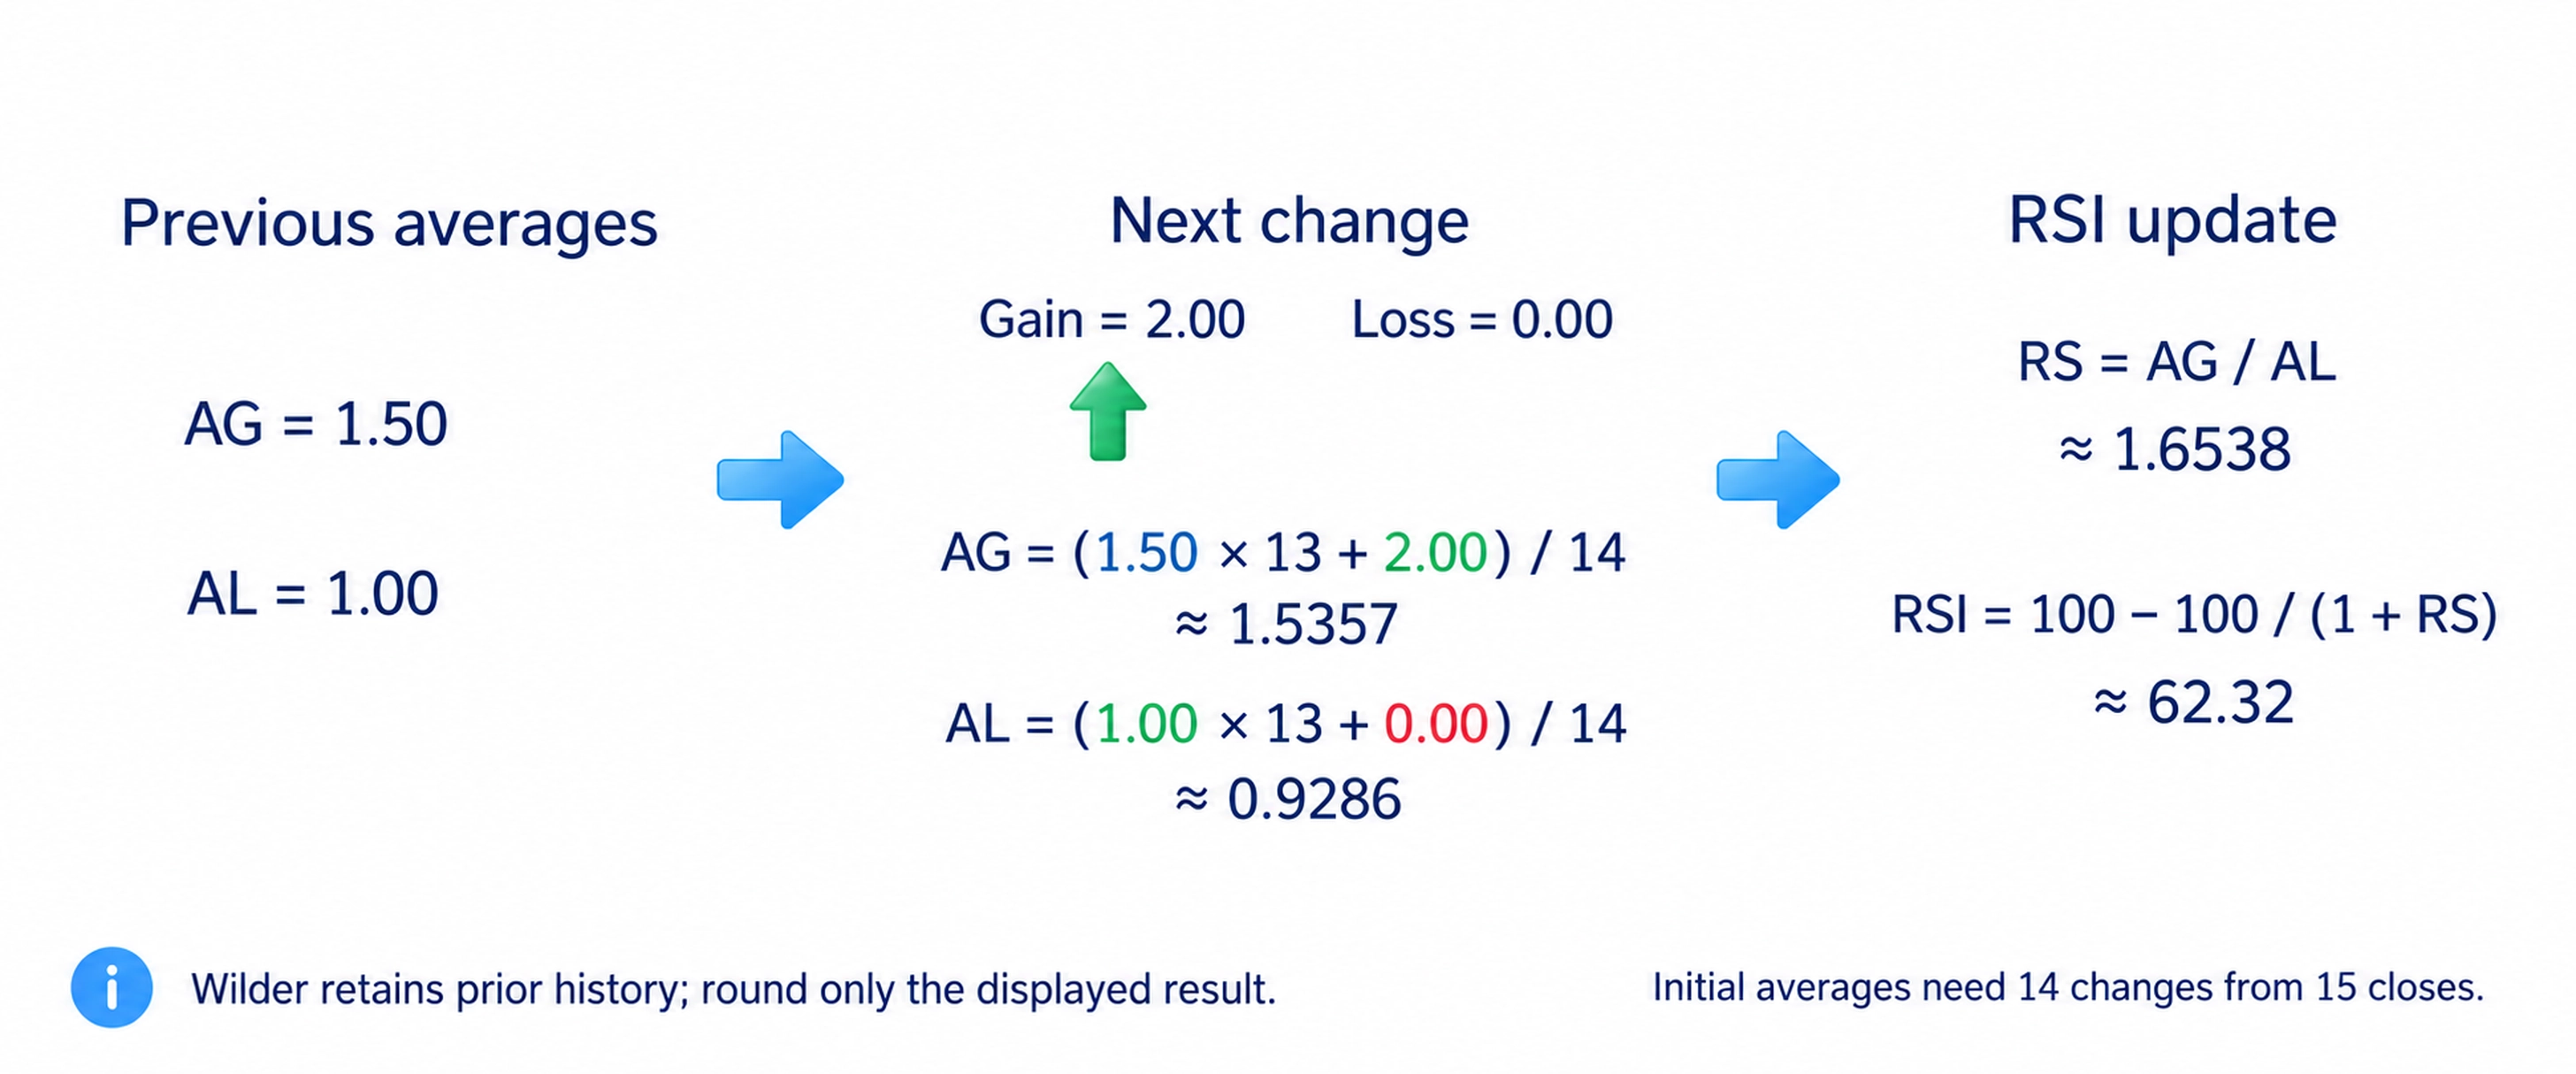
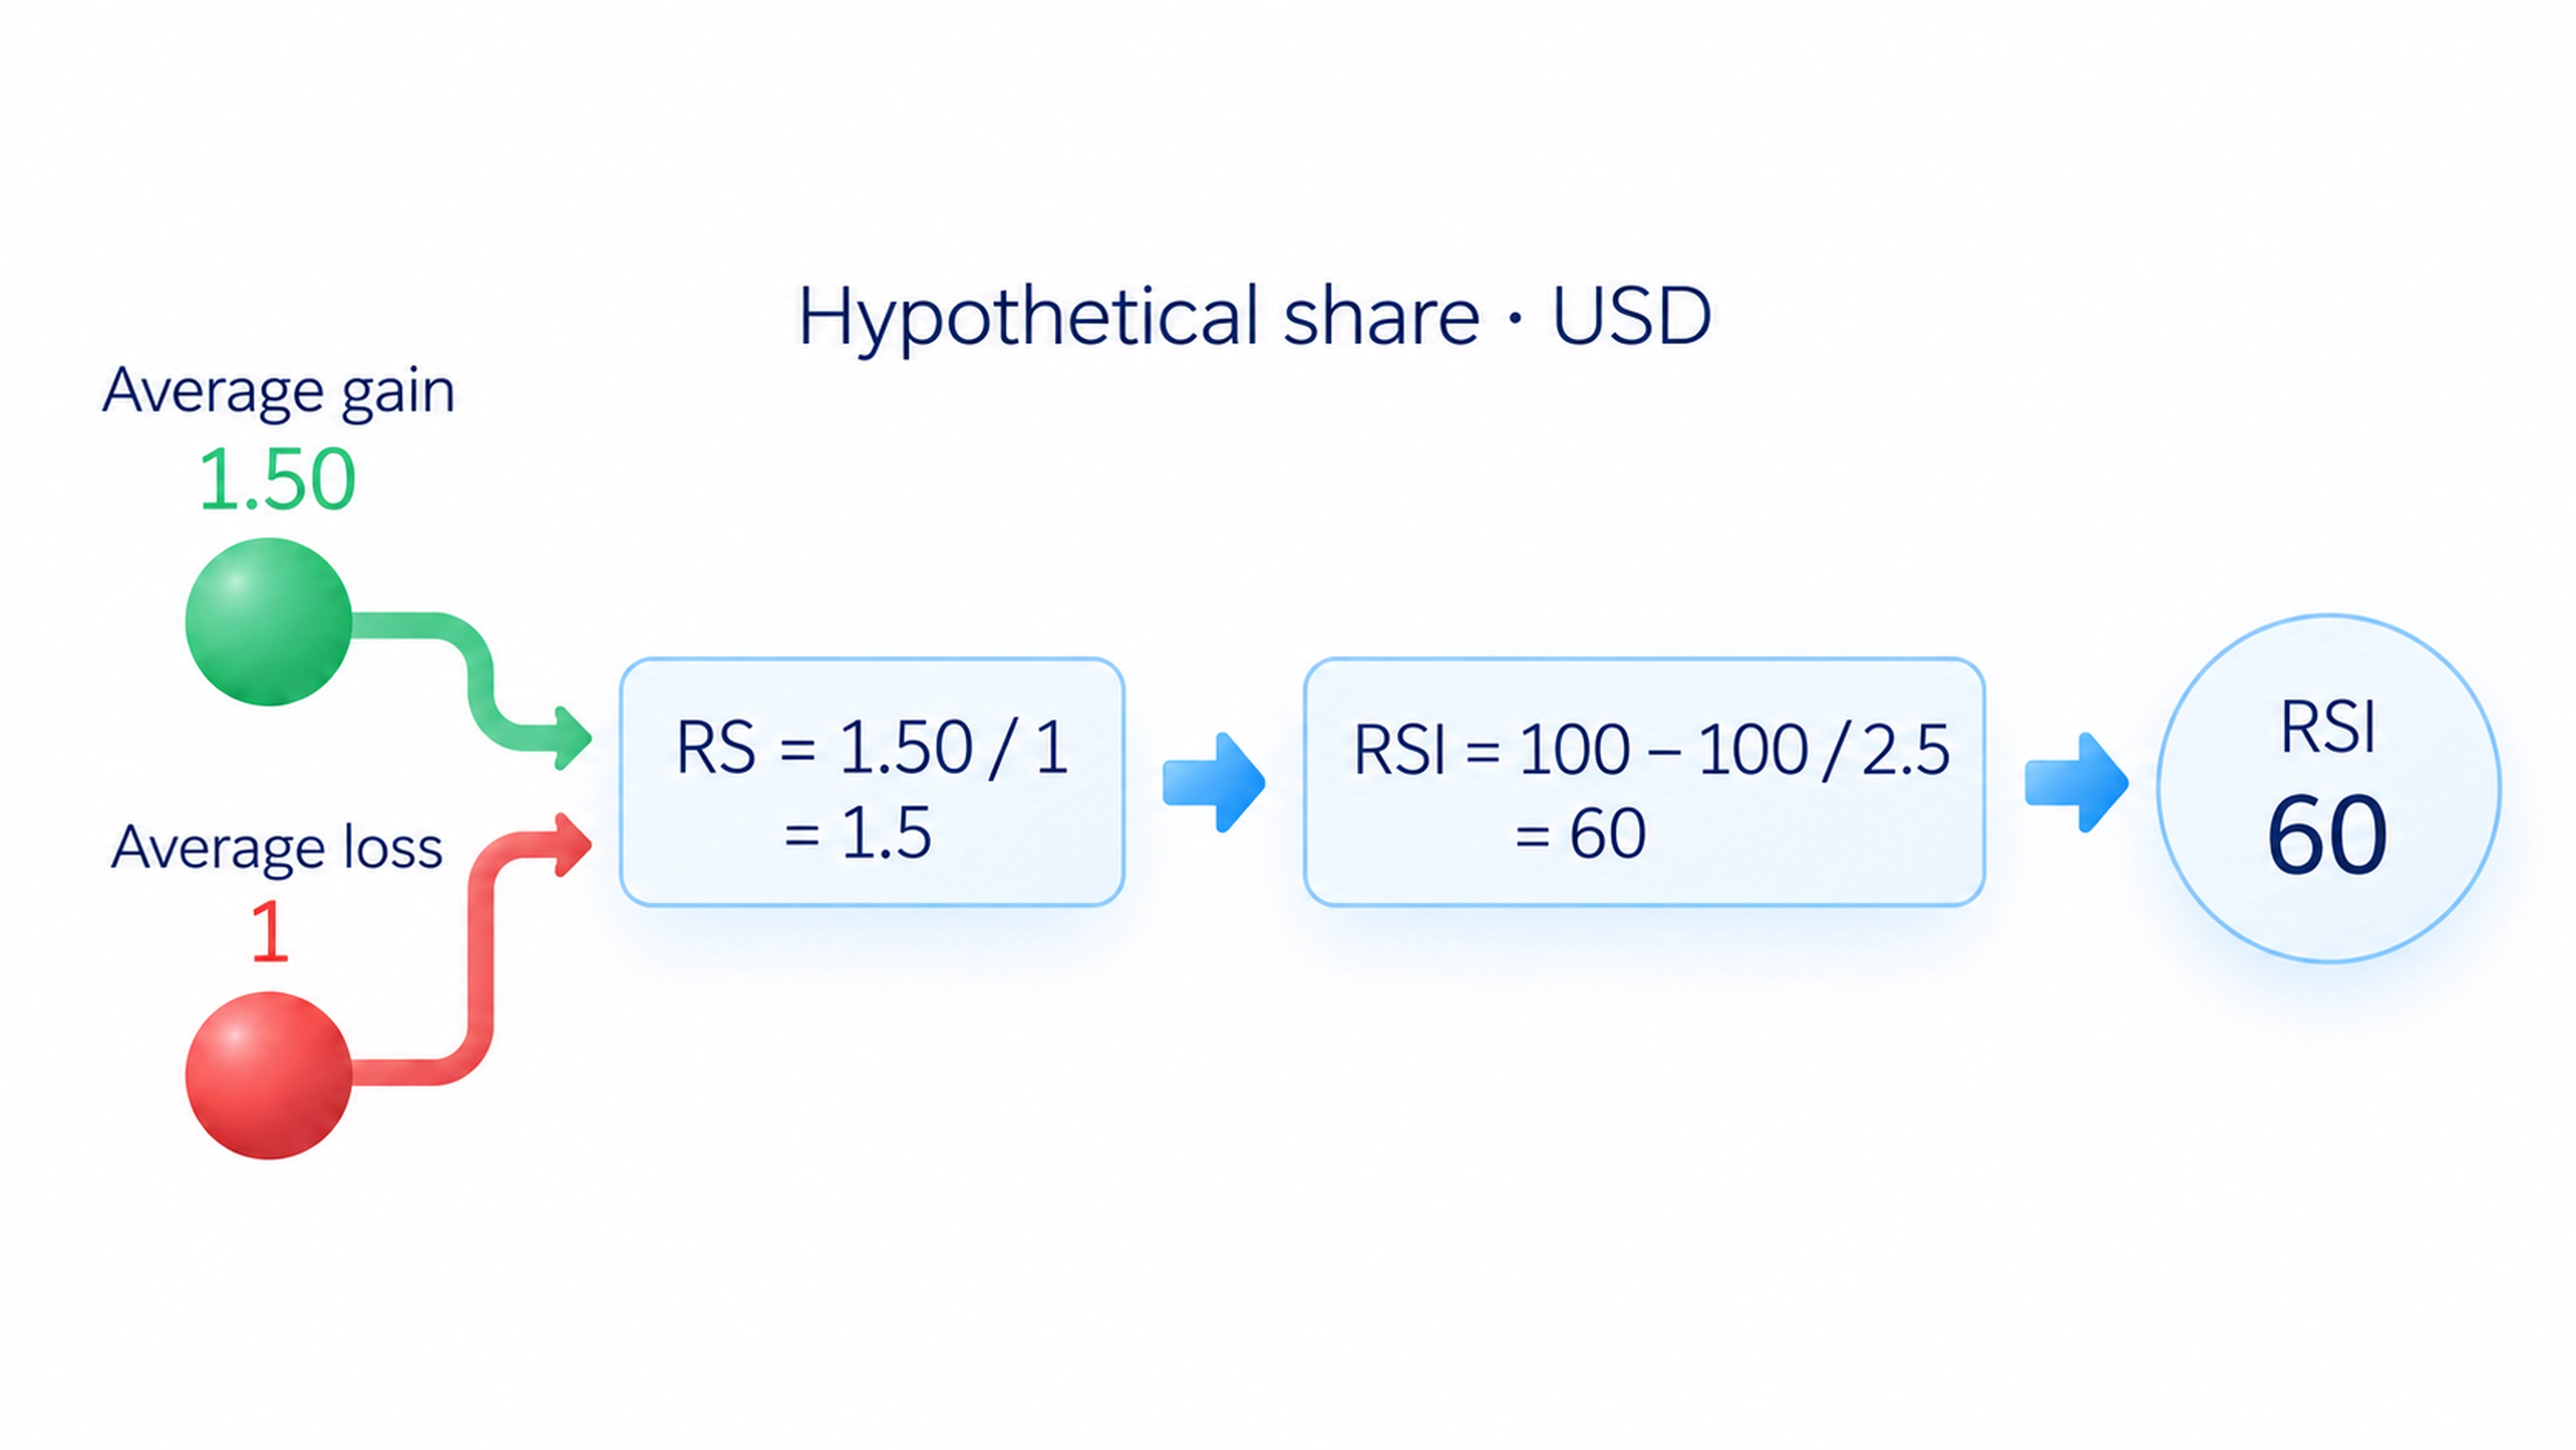
Use an illustrative share priced in US dollars. After the initial average of 14 changes, average gain is USD 1.50 and average loss is USD 1. Then RS = 1.50 / 1 = 1.5, and RSI = 100 − 100 / 2.5 = 60. These averages include the zero entries in each respective series, not only the bars with gains or losses.
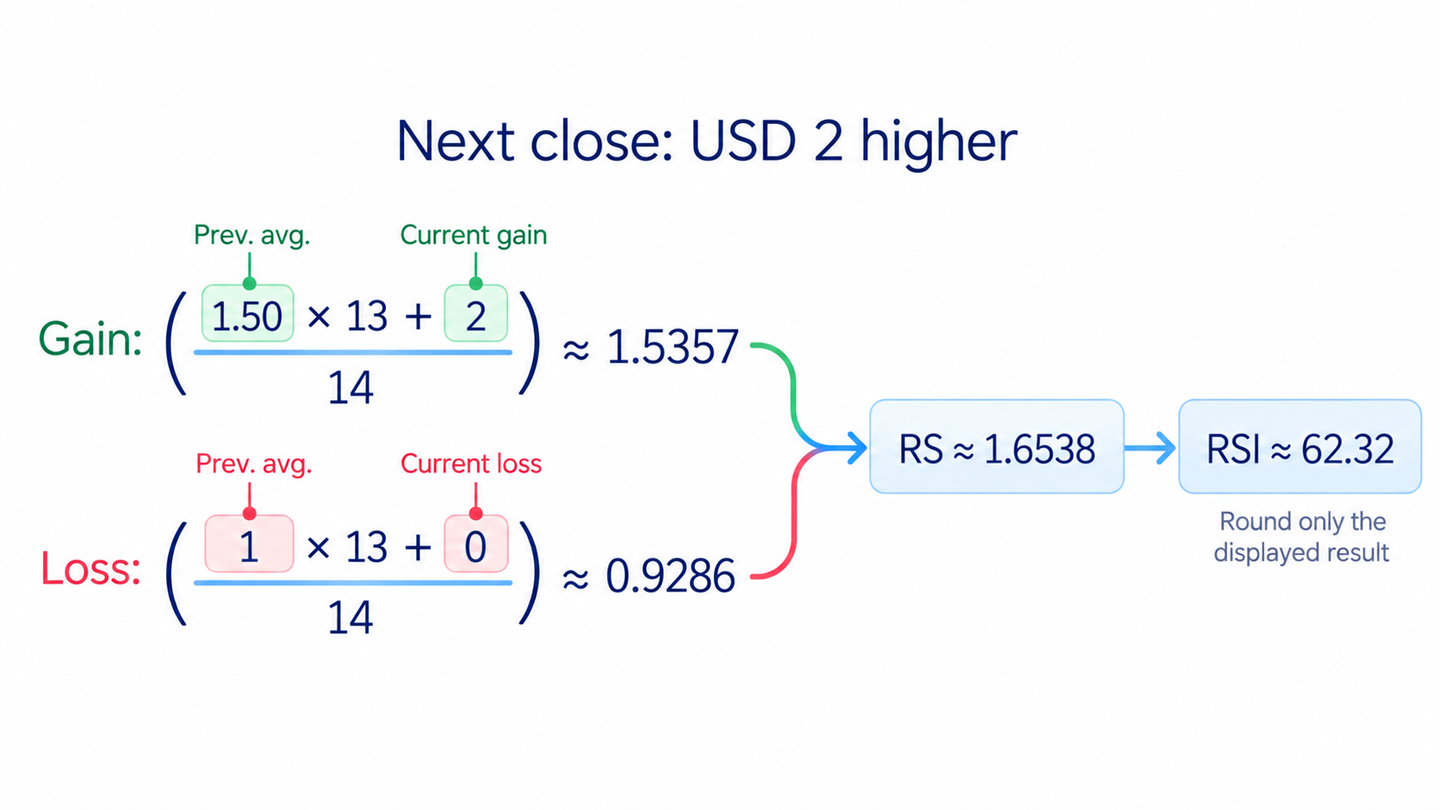
The next bar closes USD 2 higher. Updated average gain is (1.50 × 13 + 2) / 14 ≈ 1.5357; updated average loss is (1 × 13 + 0) / 14 ≈ 0.9286. Their ratio is about 1.6538, giving RSI of about 62.32. The new gain lifts the reading, but earlier losses still affect it. Keep full precision inside the calculation and round only the displayed result.
Overbought and oversold readings
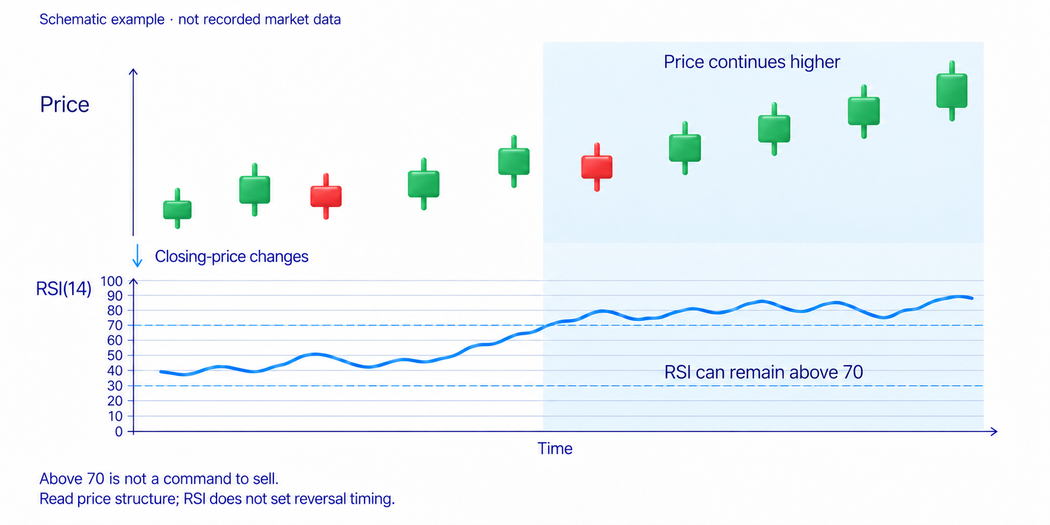
Readings above 70 are traditionally called overbought, and readings below 30 oversold. These names describe an extreme balance of recent price changes in RSI. They do not establish that an asset is too expensive or too cheap compared with its underlying value.
RSI can remain high while a strong upward move continues, or low while price keeps falling. Selling solely because it exceeds 70, or buying solely because it falls below 30, can put the trade against an ongoing move. Returning from an extreme zone also does not guarantee a reversal.
When price moves sideways between boundaries, you can compare an extreme RSI reading with price approaching one of those boundaries. The range may still break and end. First describe the market using its highs, lows and levels, then read RSI. The chart-reading guide explains these price observations.
RSI's usual operating range can shift upward during rising markets and downward during falling markets. Constance Brown described approximate ranges of 40–90 and 10–60 respectively. These are observed models, not mandatory limits for every instrument. Interpret 30, 50 and 70 with the chosen settings and the current price movement.
Choosing the RSI length and timeframe
A length of 14 is a common starting point, not the best setting for every trade. Shorter lengths generally respond faster and reach extremes more often; longer lengths smooth changes more. Faster response does not itself mean a more accurate signal. Test the length together with a specific rule rather than changing it after each loss.
The timeframe is the duration of one bar. A 14-period RSI on an hourly chart processes hourly closes; on a daily chart it processes daily closes. High and moderate readings on different charts can both be correct because they use different data sequences. How to combine charts is a rule of the chosen trading system, not an automatic property of RSI.
In TradingView, add ordinary RSI and check its length and price source; close is the default. Stochastic RSI is a different indicator that compares RSI with its own recent range. Its zones cannot simply be transferred to ordinary RSI. An additional smoothing line in the settings also does not replace Wilder's original calculation.
To compare platforms, match the instrument, price feed, timeframe, input price and length. Initial averaging and available history matter too. The unfinished bar's latest price keeps changing, so its RSI can change. If the rule requires a completed bar, check the final reading rather than a temporary crossing that later disappears.
What RSI divergence means
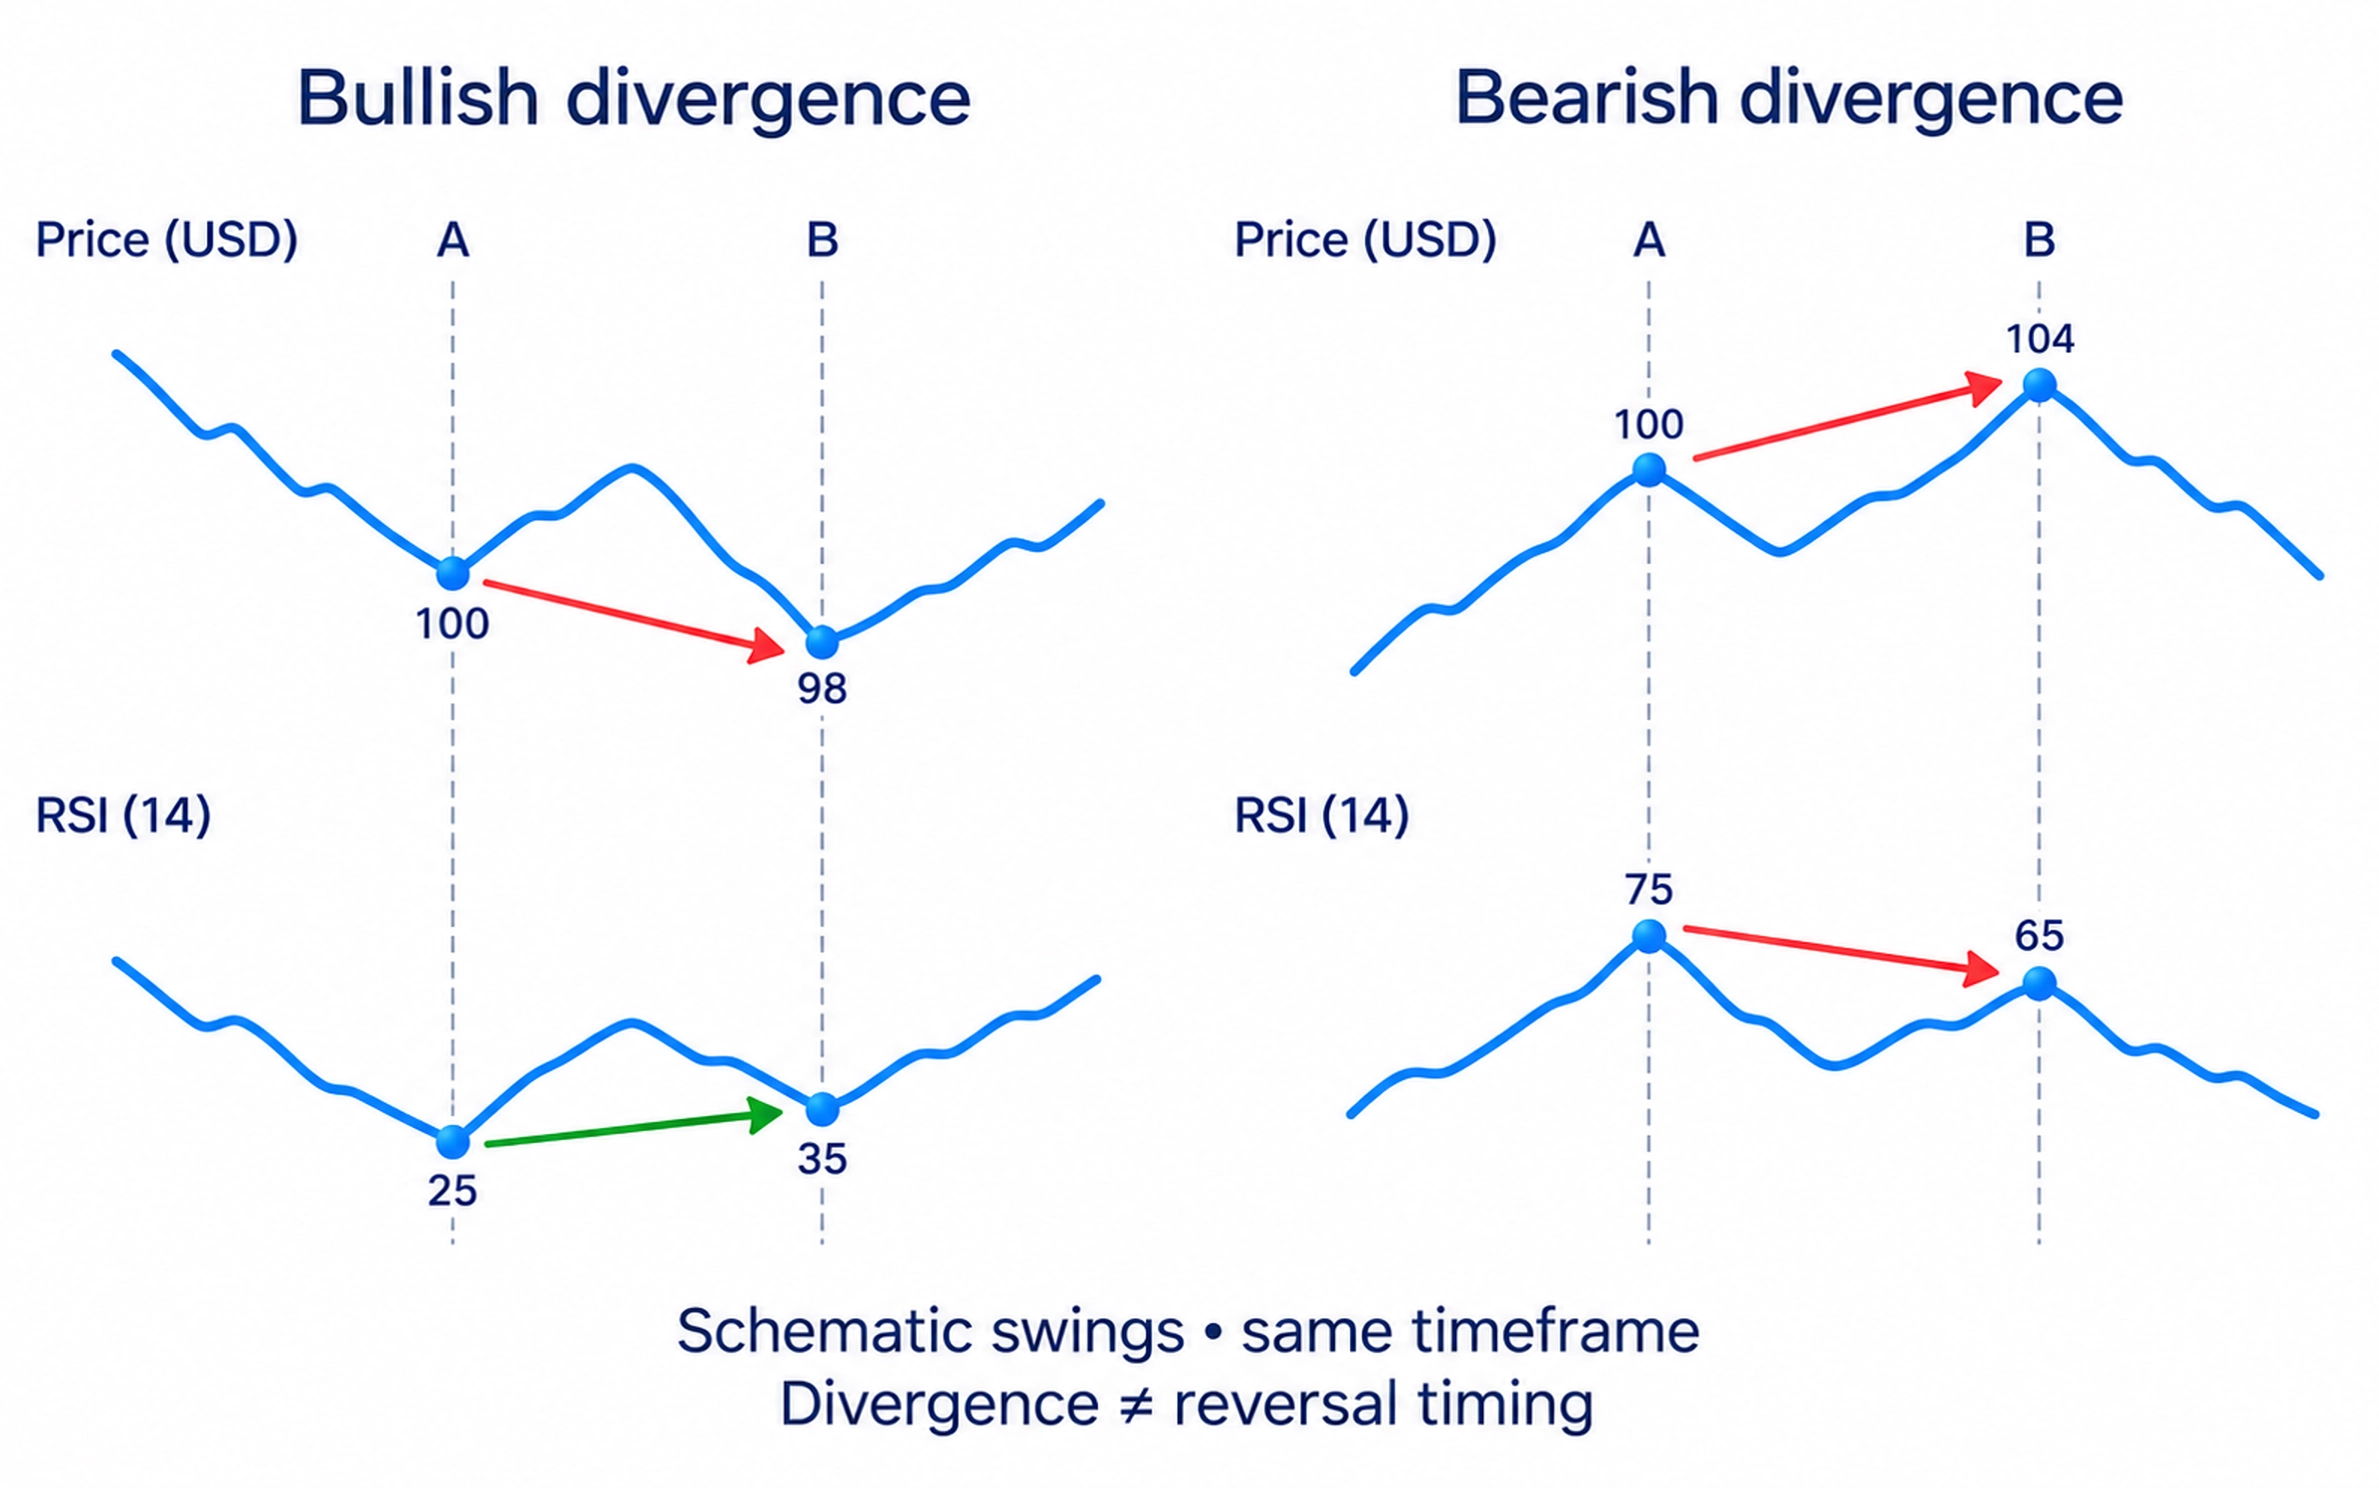
Divergence means selected price extremes and RSI extremes disagree. In ordinary bullish divergence, price makes a lower low while the corresponding RSI low is higher. In bearish divergence, price makes a higher high while RSI's corresponding high is lower. Compare two matching swings on the same chart, not unrelated points from different periods.
The disagreement shows that the new price extreme is not accompanied by the same gain-to-loss relationship in RSI. It may precede a pullback, sideways movement or reversal, but it does not set their timing. Several divergences can appear while a strong trend continues. If a program identifies an extreme only after later bars, that completed marker was not available at the extreme itself.
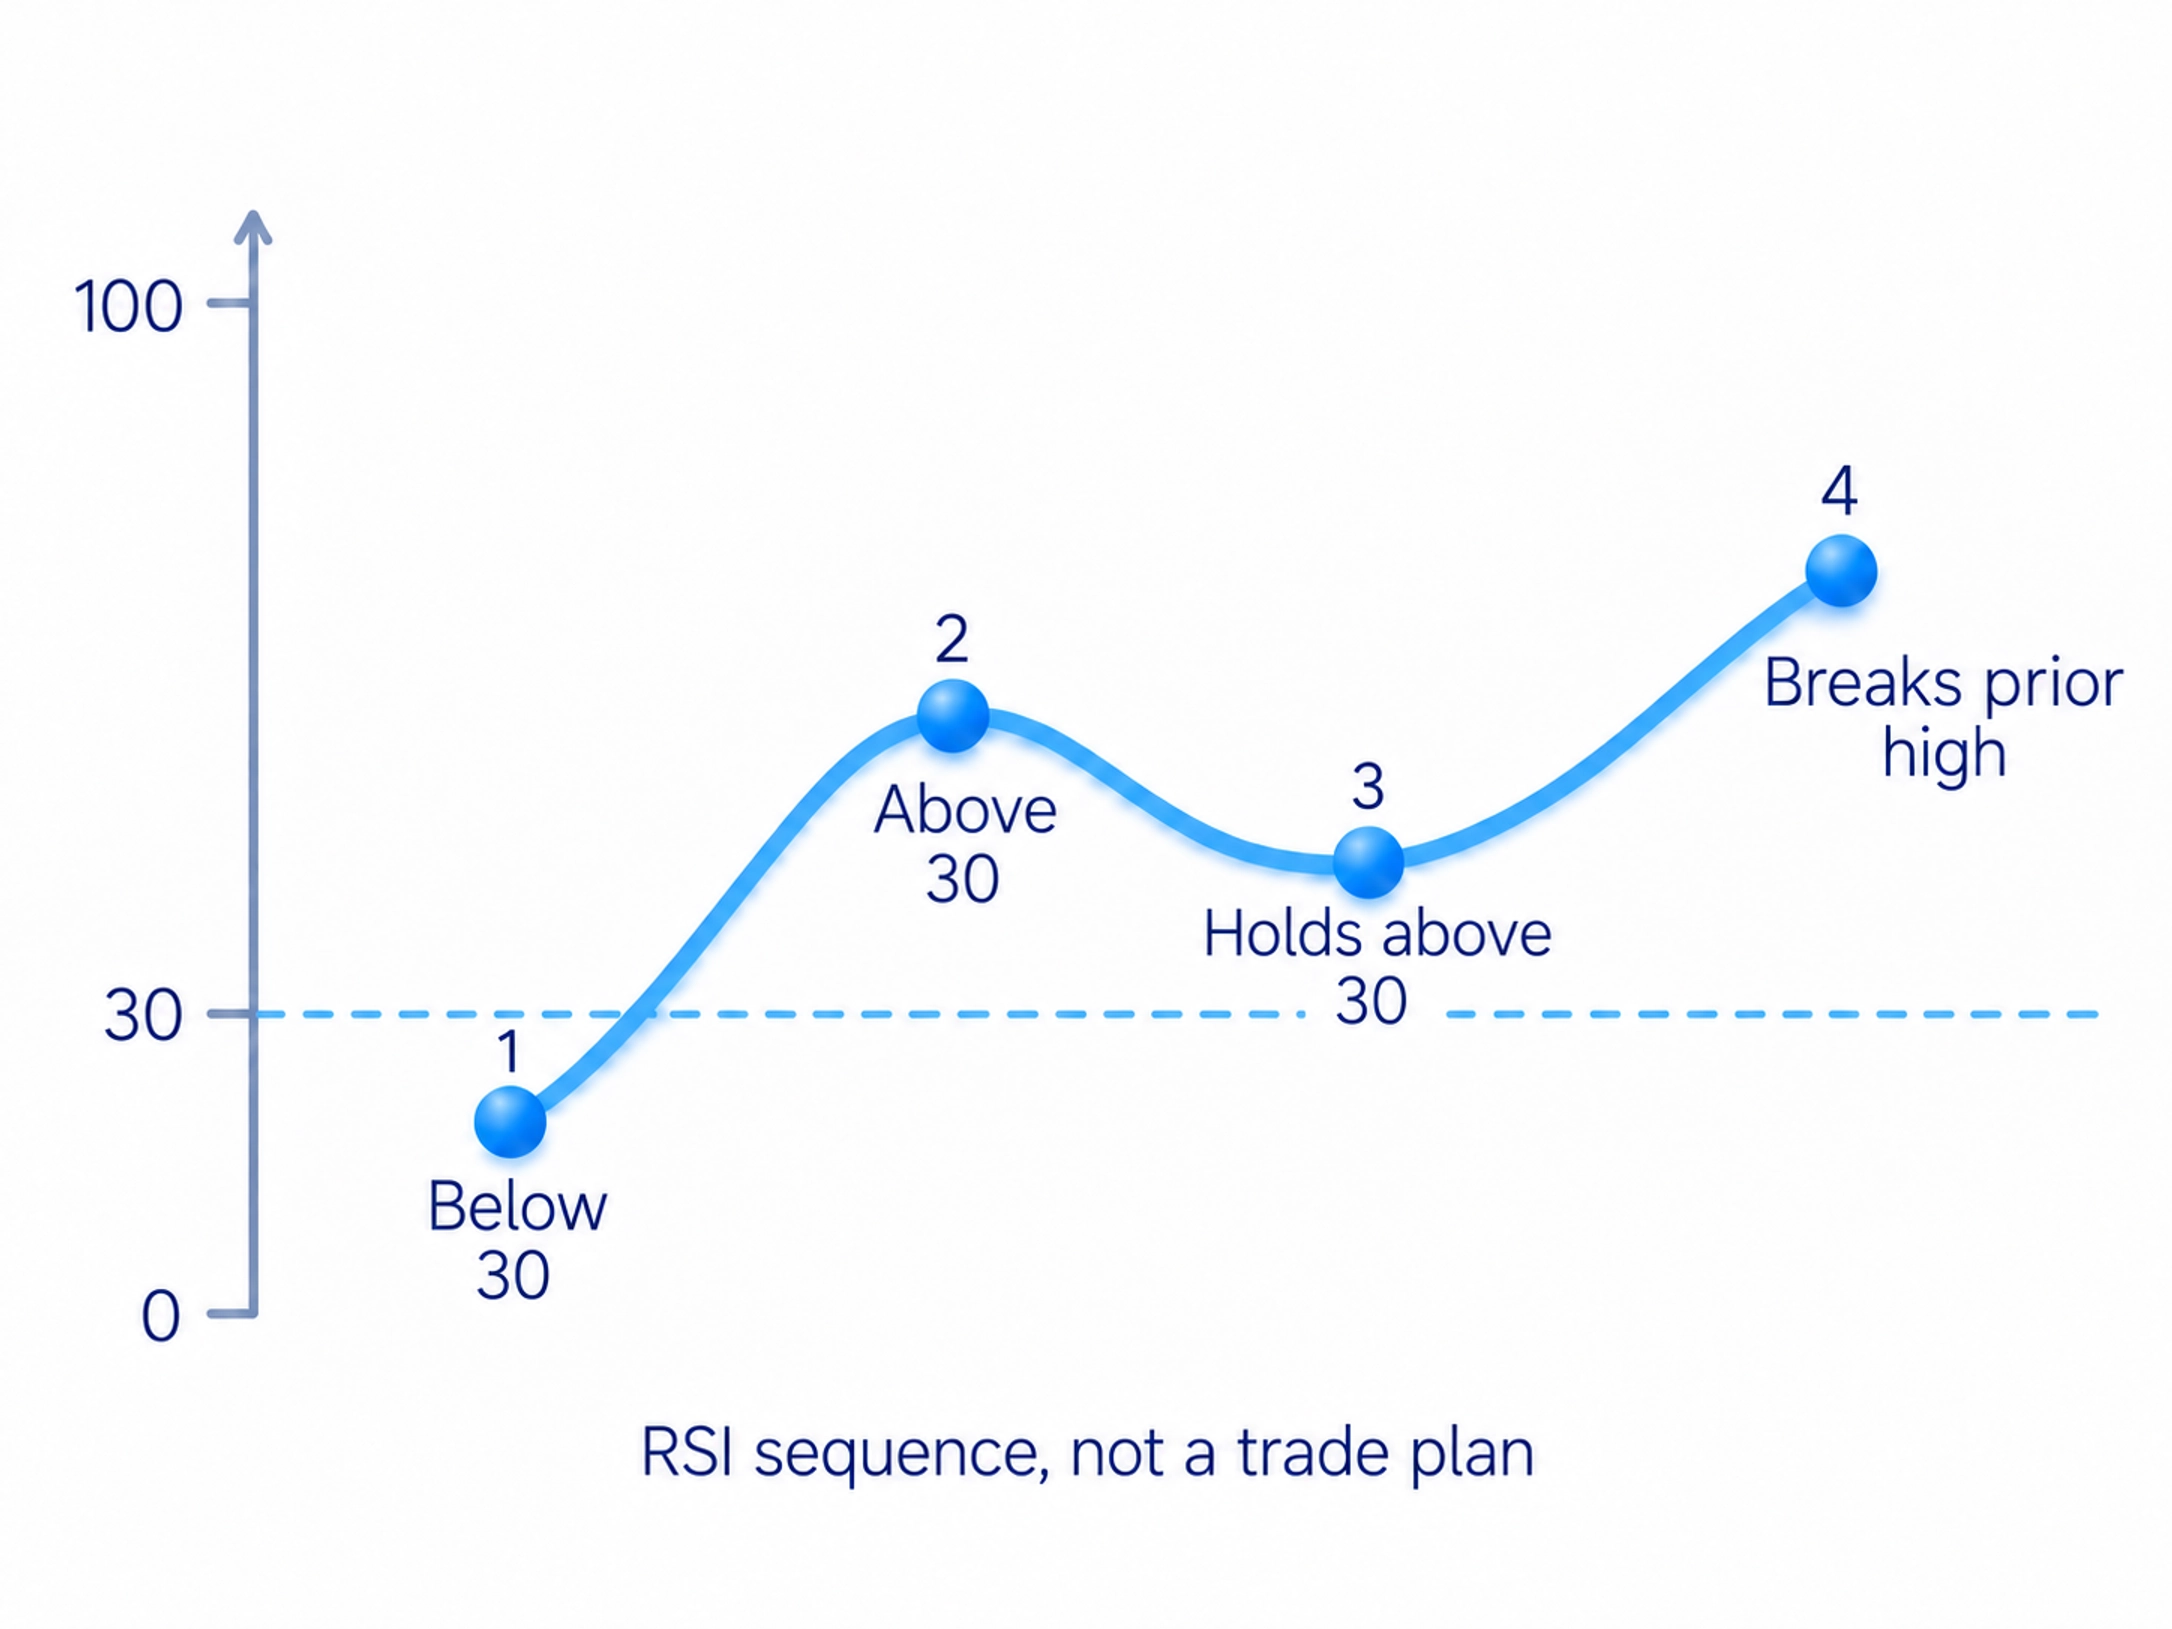
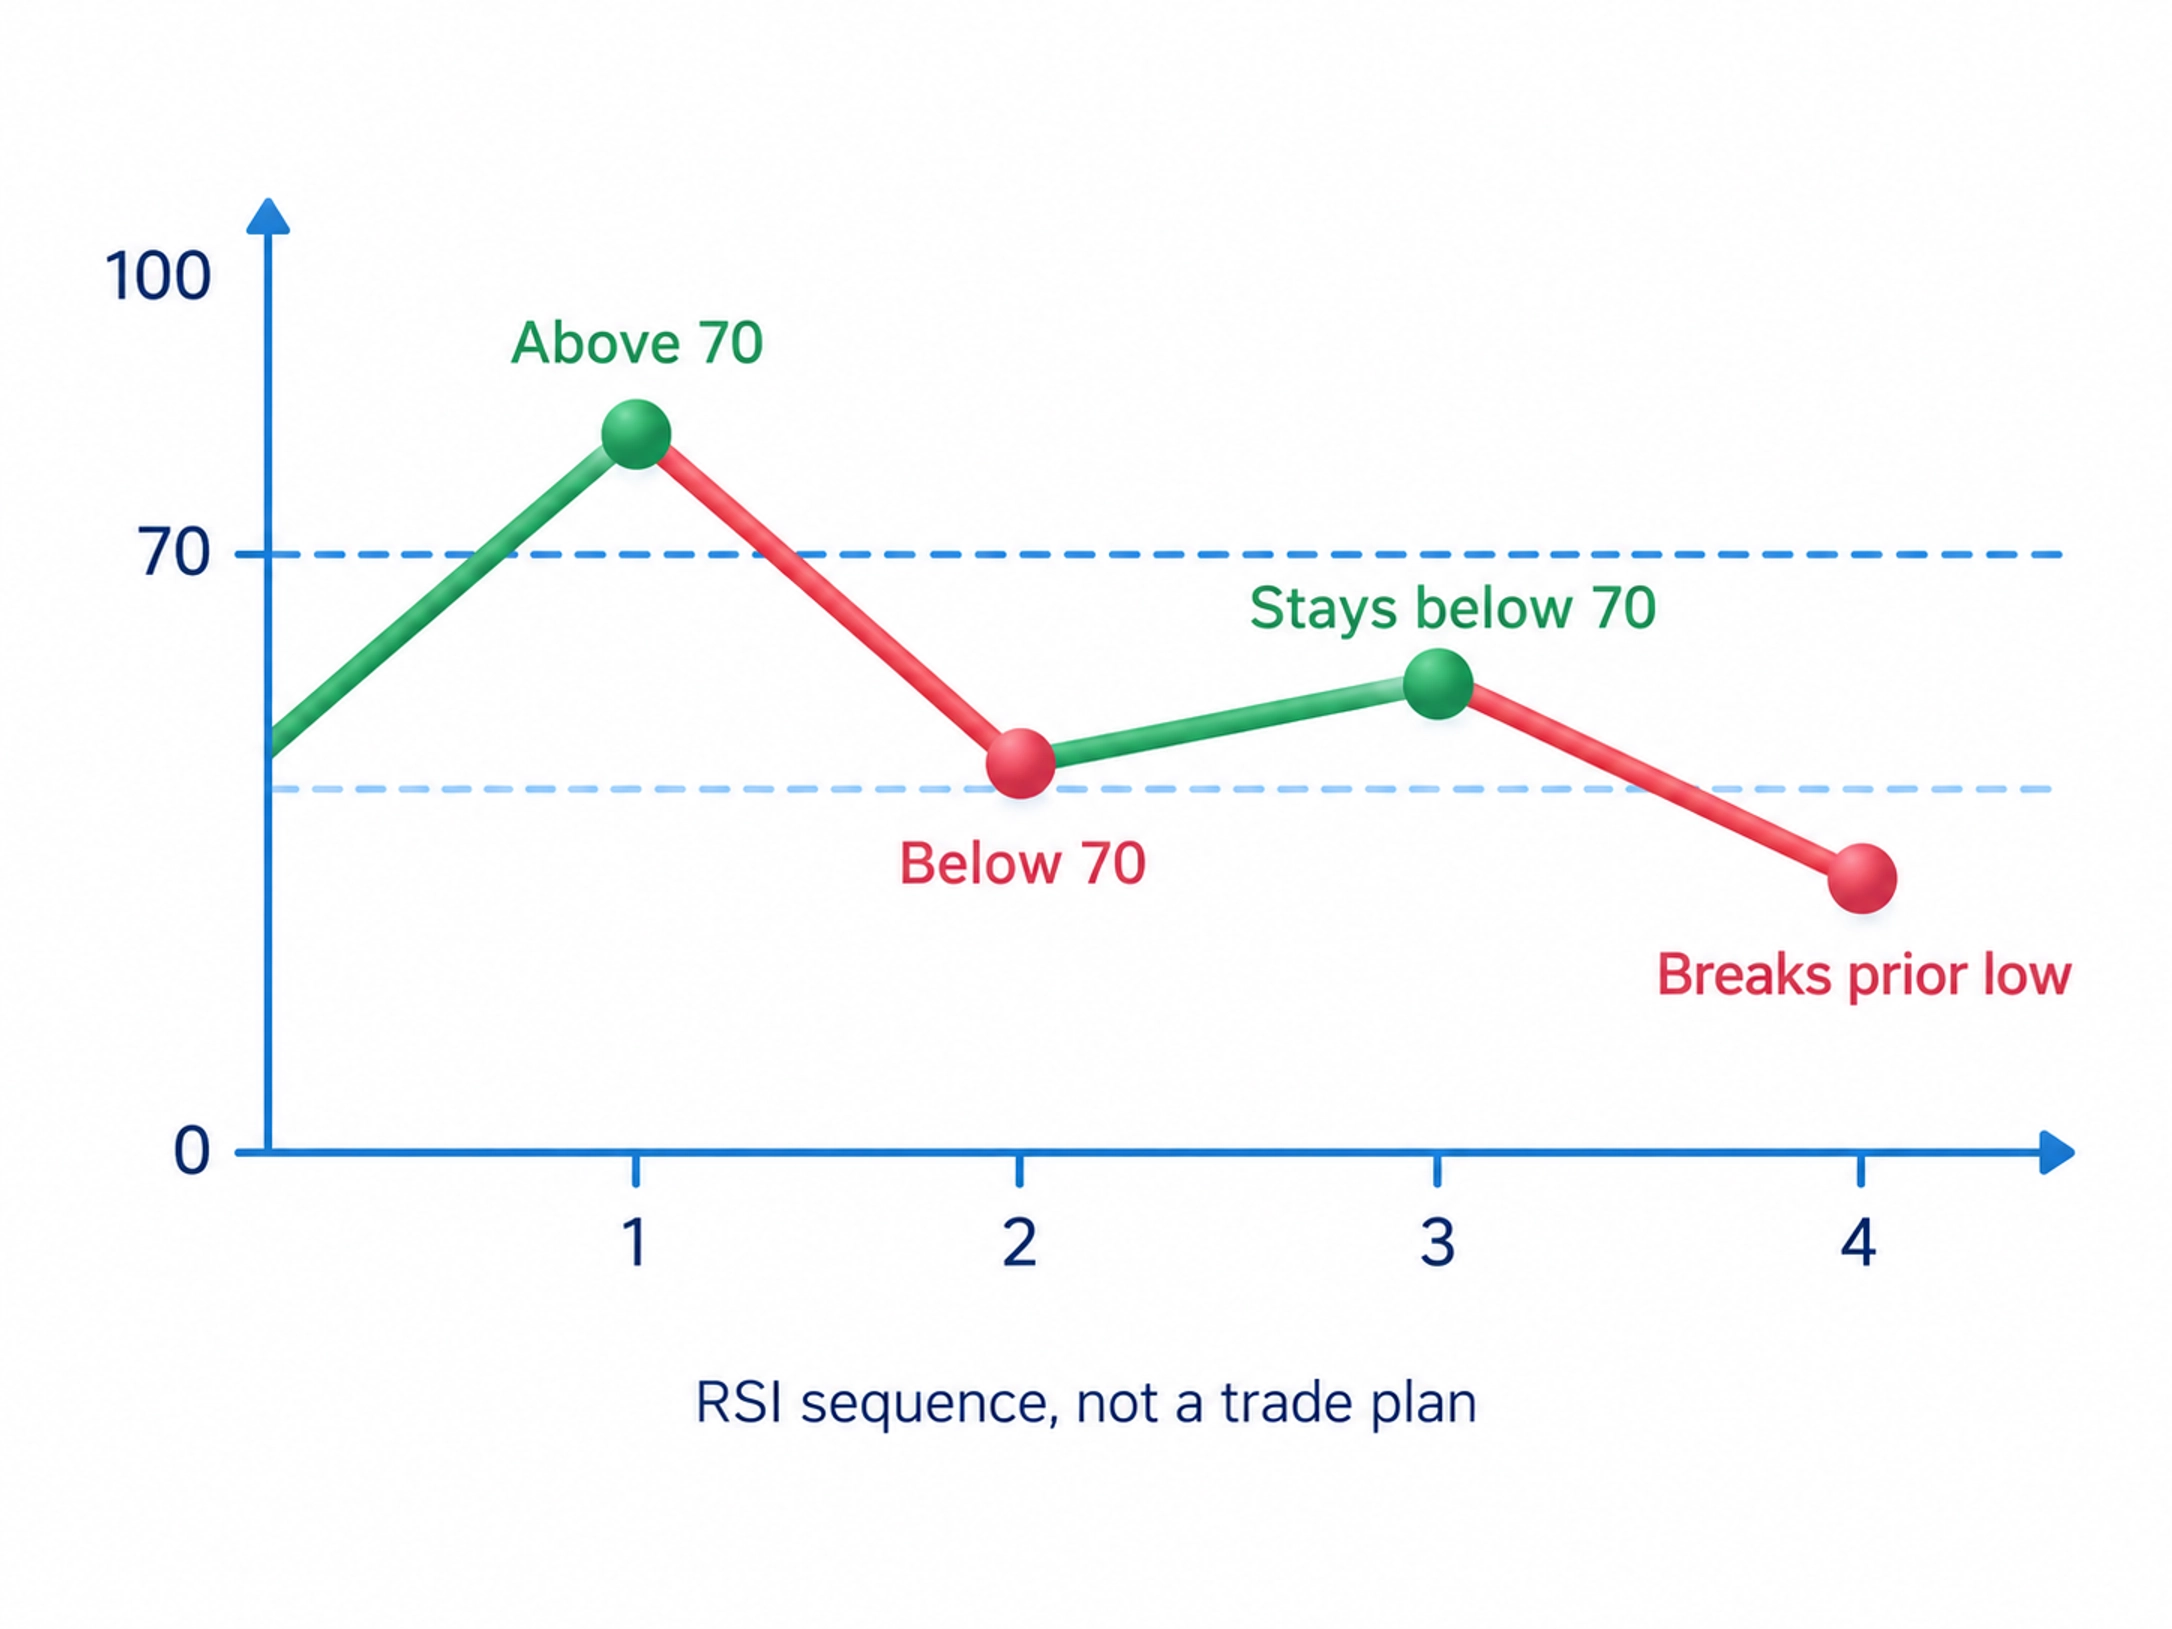
A failure swing is a different pattern on RSI's own line. In the bullish version, RSI falls below 30, returns above it, pulls back without falling below 30, then exceeds the intervening high. The bearish version starts above 70: RSI returns below it, rises without reaching 70, then breaks the intervening low. No disagreement with price extremes is required. This sequence describes the indicator; it is not yet a complete trade plan.
Other ways of processing price have their own limits. MACD, for example, compares moving averages. Agreement between MACD and RSI does not make two calculations from price independent evidence, or remove the possibility of a mistaken interpretation.
Using RSI without expecting a forecast
In the course's section on indicators, I explain their supporting role. My approach begins with price structure, levels and trading volume, the quantity traded in the selected data source. This is the course's approach, not a separate personal strategy based on RSI crossing 30 or 70.
The video on indicator lag explains why I do not build training around finding a perfect indicator. It provides optional practical context. The written RSI lesson stands on its own: describe what price is doing first, then ask what additional information the line gives. Processing recent changes does not reveal participants' future actions.
Before testing an RSI condition, record the settings, when to inspect the bar and the exact condition. Define entry, exit and the permitted money loss separately; the risk-management guide explains that loss calculation. Compare the same rules with and without the RSI condition across different periods, including failures and costs. Do not choose a new threshold after seeing each result. This tests a specified use of RSI rather than its ability to guess the market.
Frequently asked questions
RSI compares average upward and downward price changes on a scale from 0 to 100. It does not count buyers and sellers or display the probability of profit.
Average the gains and positive-sized losses separately, including zeros. Convert their ratio RS to the scale using RSI = 100 − 100 / (1 + RS). Wilder's later averages retain previous history through smoothing.
Above 70 and below 30 traditionally describe extreme balances of recent changes. They are not guaranteed reversals or estimates of underlying value. An extreme reading can persist during a trend.
Fourteen is a common starting length. A shorter length reacts faster and a longer one smooths more, but no setting is universally best. Evaluate the setting together with the rule for using it.
Yes. Hourly and daily closing prices form different sequences, so the same RSI length can produce different readings. This is not necessarily an error; the trading system must specify how the charts are compared.
Divergence can reveal a disagreement between corresponding price and RSI extremes. It does not set a reversal time and can repeat while a trend continues. A trade still needs a separate condition on price.
About the author
Igor Arapov, practising trader since 2013 and author of the ArapovTrade library. ORCID: 0009-0003-0430-778X.




