MACD compares two moving averages and shows how the distance between them changes. Its lines and columns describe information already present in the price series. To read it correctly, distinguish the main line, the signal line and their separate relationships with zero before treating any crossing as a trade condition.
A positive reading, a rising column and a price rise are not the same observation. The formula does not reveal the intentions of traders or guarantee a reversal.
What the MACD indicator shows
MACD stands for Moving Average Convergence Divergence. Gerald Appel developed it in the late 1970s. In the common version, the main line is the 12-period exponential moving average of price minus the 26-period exponential moving average.
An exponential moving average, or EMA, gives more weight to recent prices. The shorter, fast average generally responds sooner to a price change than the longer, slow average. The moving-averages guide explains the weights and starting values behind this smoothing; MACD compares the resulting averages rather than individual orders.
The classic signal line is a nine-period EMA of the MACD values. The MACD histogram is a series of columns showing MACD minus that signal line. A positive column means the main line is above the signal line; a negative one means it is below. The columns do not count purchases, sales or market participants.
Thomas Aspray introduced the histogram to display this difference. Keep the two comparisons separate: MACD measures the distance between average prices, while the histogram measures the distance between MACD and its own smoothed line. The two distances can grow or shrink at different times.
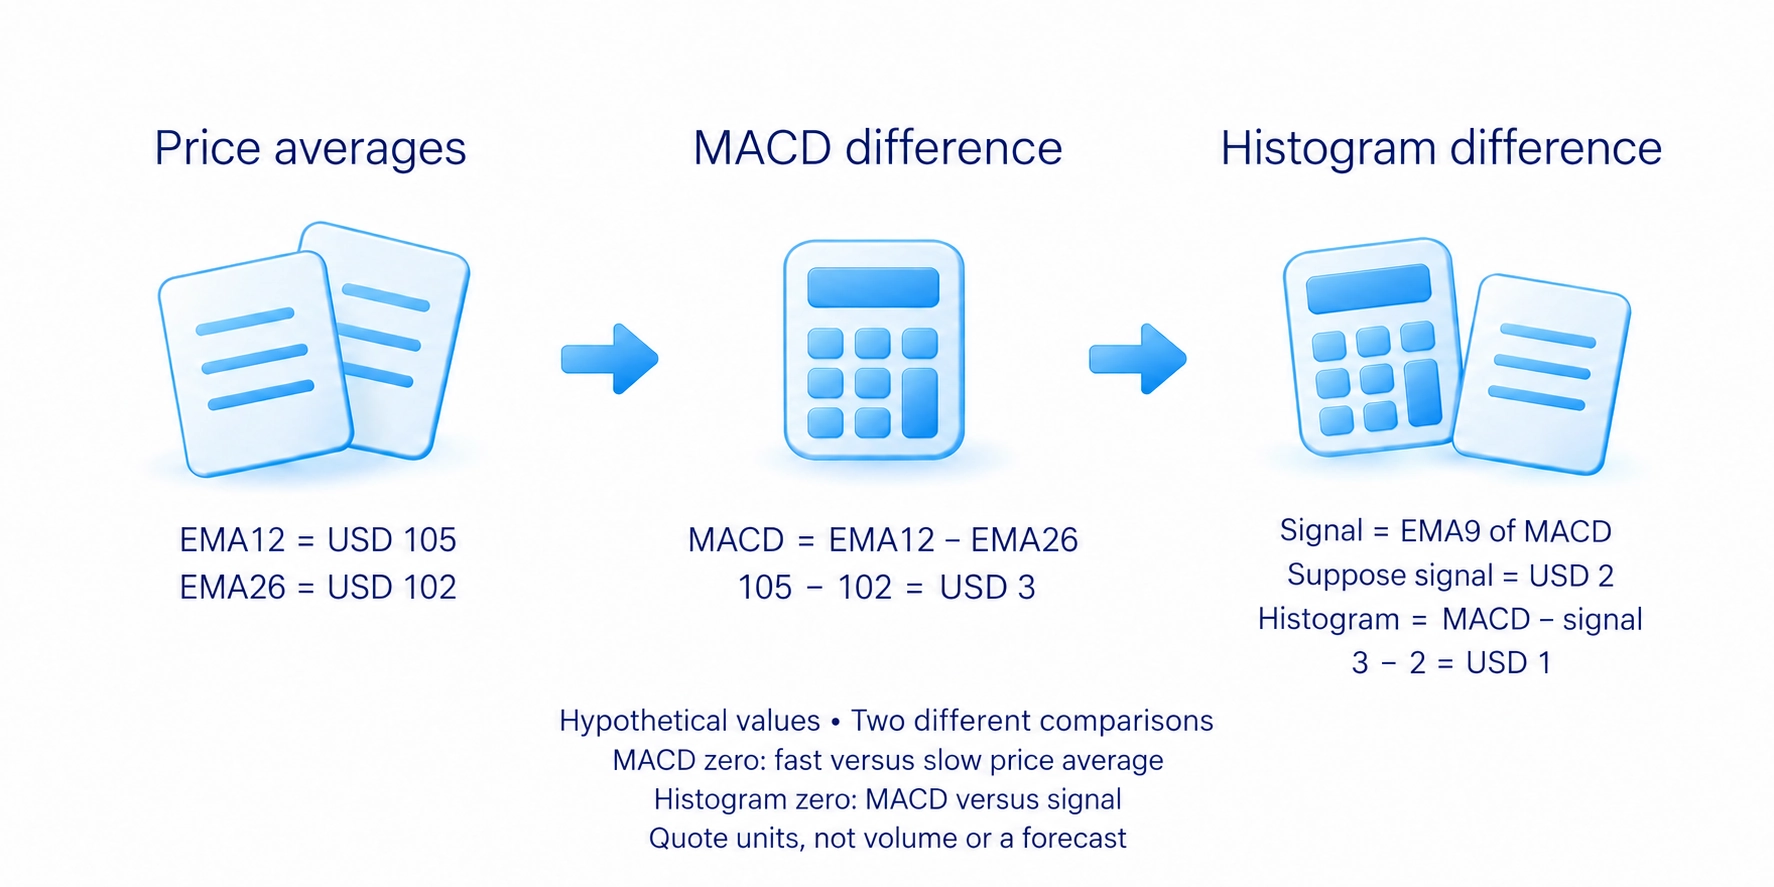
For one illustrative share quoted in US dollars, suppose the already calculated EMA12 is USD 105, EMA26 is USD 102 and the signal line is USD 2. MACD is 105 − 102 = USD 3. Its histogram is 3 − 2 = USD 1. The main line is positive and above the signal line; neither value is a trade profit or a forecast of how far price will rise.
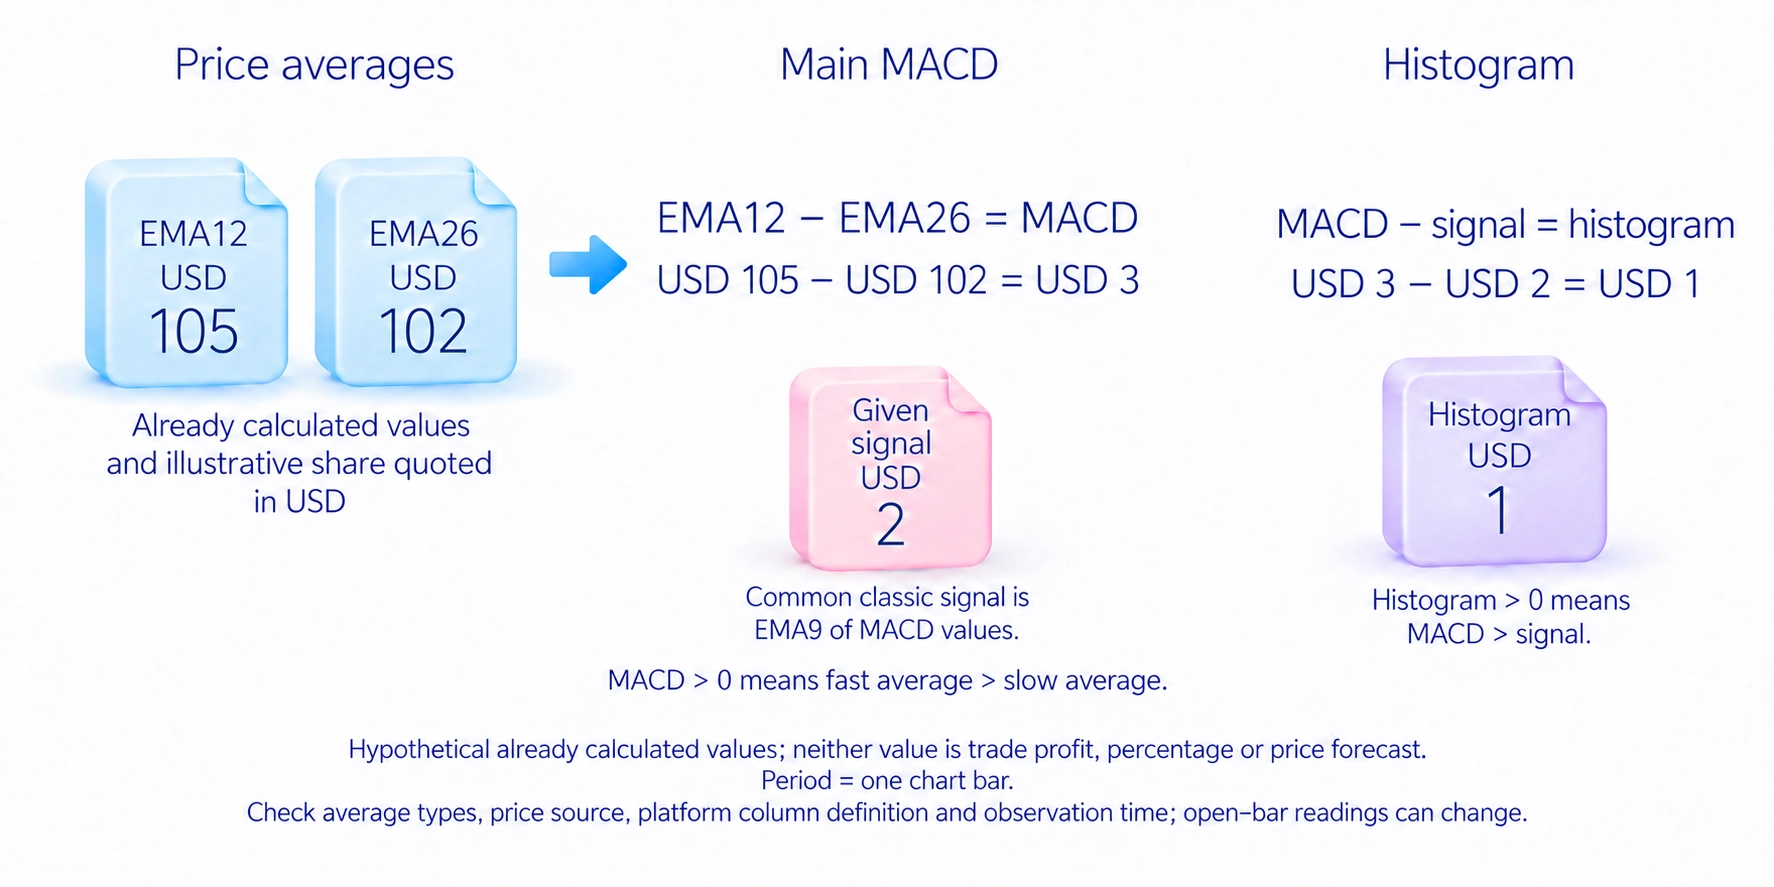
MACD uses the instrument's quote units, not a percentage scale. A reading of 3 on one share is not directly comparable with 3 on a differently priced instrument as proof of equal movement strength. MACD has no fixed upper or lower boundary, so one universal number cannot define an overbought or oversold level across markets.
Signal-line crossings and the zero line
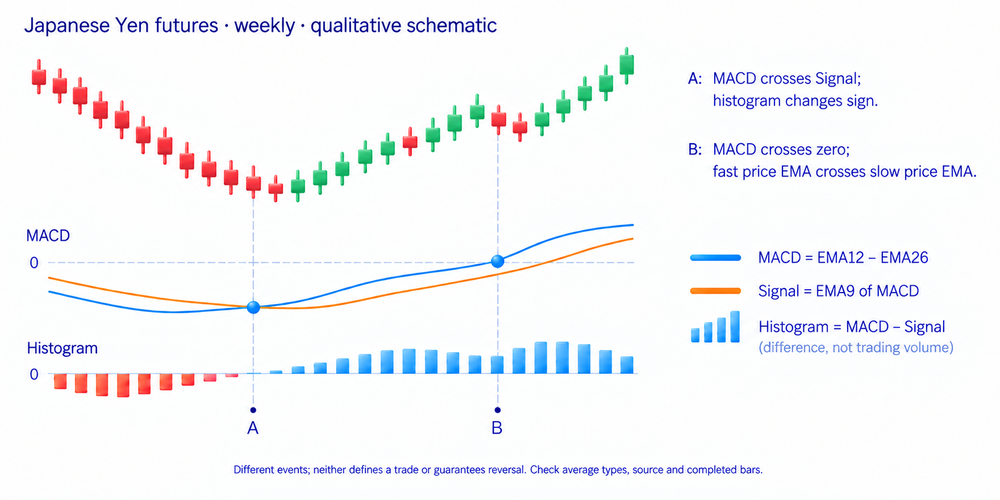
When MACD crosses above its signal line, the histogram changes from negative to positive. Crossing below changes it from positive to negative. These are two displays of the same relationship, not independent confirmations of an entry.
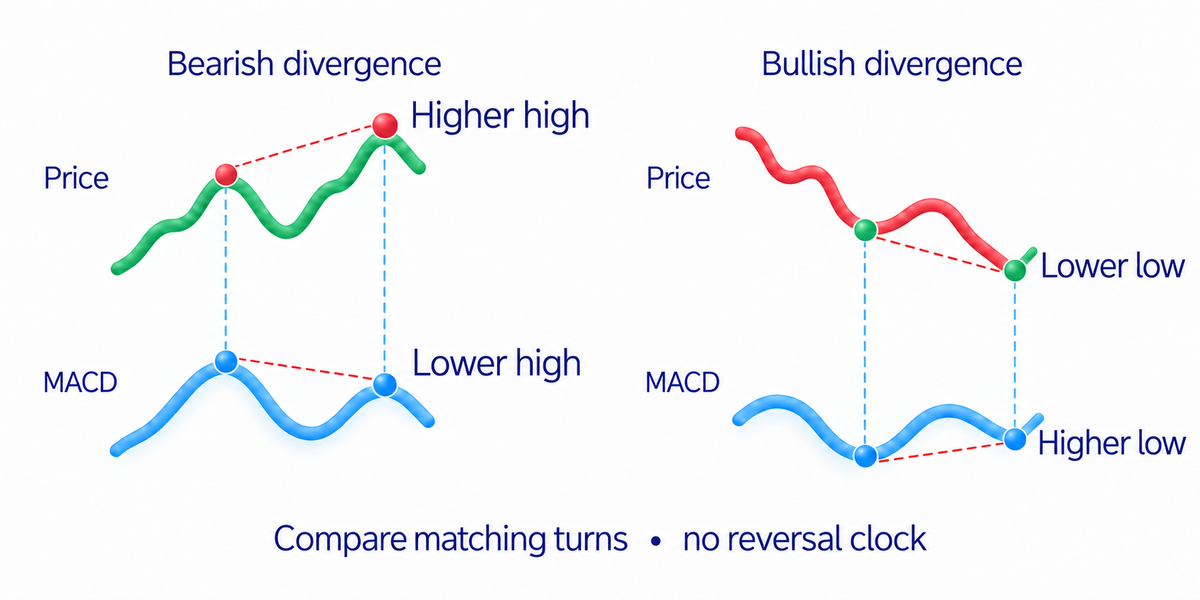
Other readings answer different questions: a zero-line crossing means the fast price average has crossed the slow one; the histogram shows the gap between MACD and its signal line; divergence means corresponding price highs or lows and indicator highs or lows disagree. For example, price may make a higher high while MACD makes a lower high. None of these observations alone specifies an entry or guarantees a reversal.
The main line crossing zero means something else: the fast price average has crossed the slow price average. Above zero, EMA12 exceeds EMA26; below zero, it is smaller. MACD can therefore cross upward through its signal line while remaining negative. Its distance below zero and its distance from the signal line answer different questions.
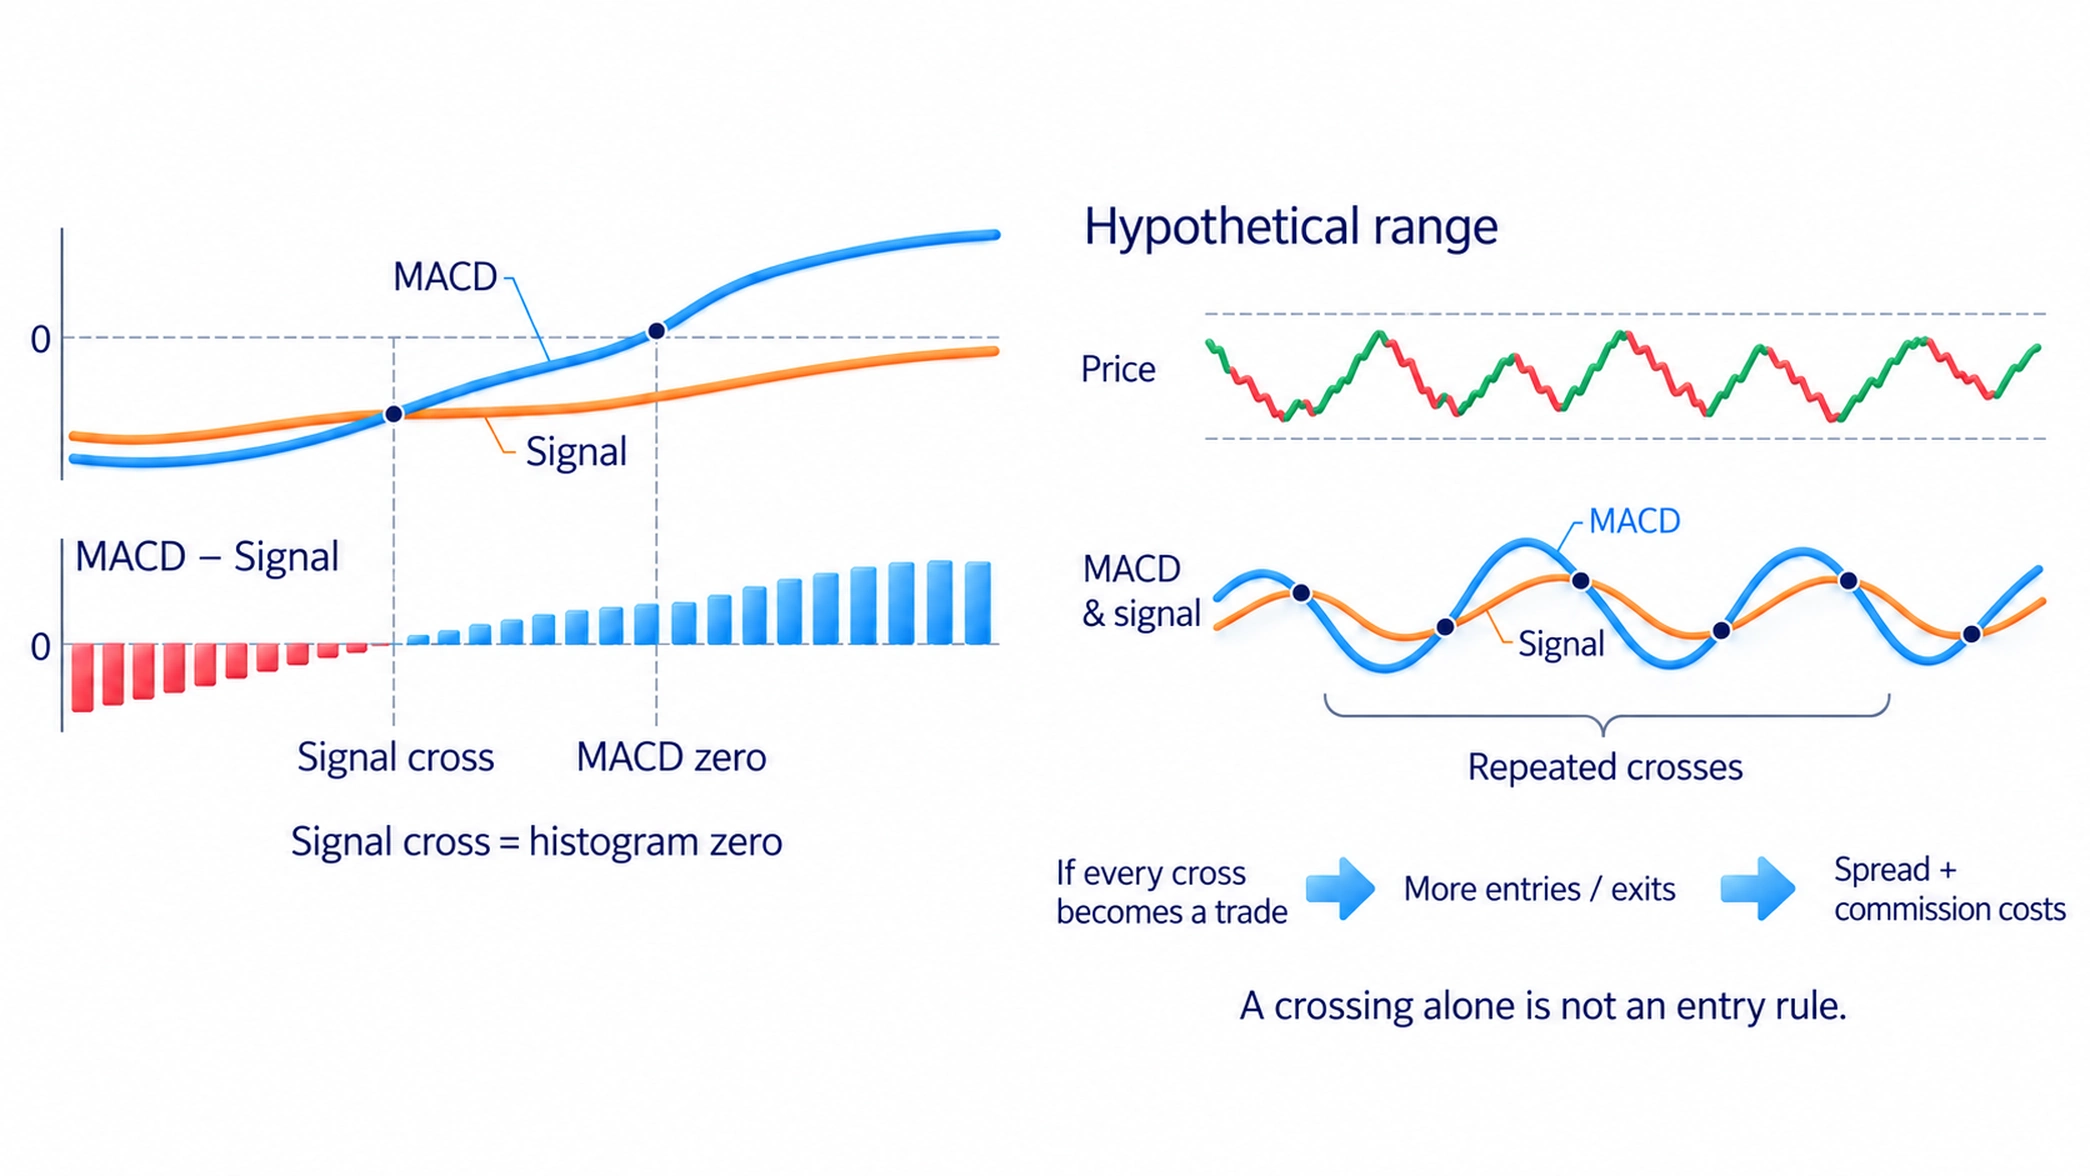
Describe columns by their sign and distance from zero. Increasing positive columns show a larger upward gap between MACD and its signal line. Negative columns shortening toward zero show a smaller downward gap. Saying that the columns are growing is ambiguous unless you say which side of zero they occupy.
A downward signal-line crossing can occur while price is still rising. The averages may move closer after growth slows, even though the upward sequence continues. The crossing identifies a change in the calculated relationship; it does not prove that a sustained decline has started.
When price moves back and forth within a range, repeated crossings can cause frequent entries and exits if each is treated as an instruction. That can add costs from the difference between buying and selling prices, plus commission costs. Test the complete entry and exit rules across failed crossings too, rather than selecting only the clear examples on a finished chart.
What MACD divergence means
MACD divergence is a disagreement between corresponding price turning points and indicator turning points. In a bearish example, price makes a higher high while MACD makes a lower high. In a bullish example, price makes a lower low while MACD makes a higher low.
The new price extreme has not produced the previous separation between its averages. This can draw attention to a change in the movement, but does not set a reversal time. A trend can continue after one divergence or several, including while MACD remains on the same side of zero.
Use comparable points on the same chart period and choose the indicator series in advance. Price divergence from the MACD line is not the same comparison as a histogram divergence from the MACD line. Do not switch from one series to another after seeing the outcome just to obtain the preferred signal.
After noting a disagreement, check price itself: is it still extending its highs or lows, has an opposing sequence appeared, and what happens around the marked area? The chart-reading guide explains these price structures and levels. Divergence gives you a question to investigate, not a complete entry decision.
MACD settings and chart periods
The common settings 12, 26 and 9 refer to the fast average, slow average and signal length. A period means one bar, one chart interval, rather than always one day. Twelve hourly bars and twelve daily bars cover different price sequences. The defaults are a starting point, not an optimum for every market.
Shortening the lengths generally makes the lines more responsive; increasing them smooths more history. Faster response does not automatically make a signal more accurate, and a smoother line does not guarantee fewer losing trades. Write down the settings before testing and apply them consistently rather than retuning after each outcome.
Check the average types and price source as well as the lengths. TradingView permits EMA or simple moving average, SMA, calculations for its main averages and signal line. An SMA gives the selected values equal weight. In MetaTrader's standard MACD, the signal is a simple average rather than the classic EMA. Matching 12, 26 and 9 alone does not establish identical calculations.
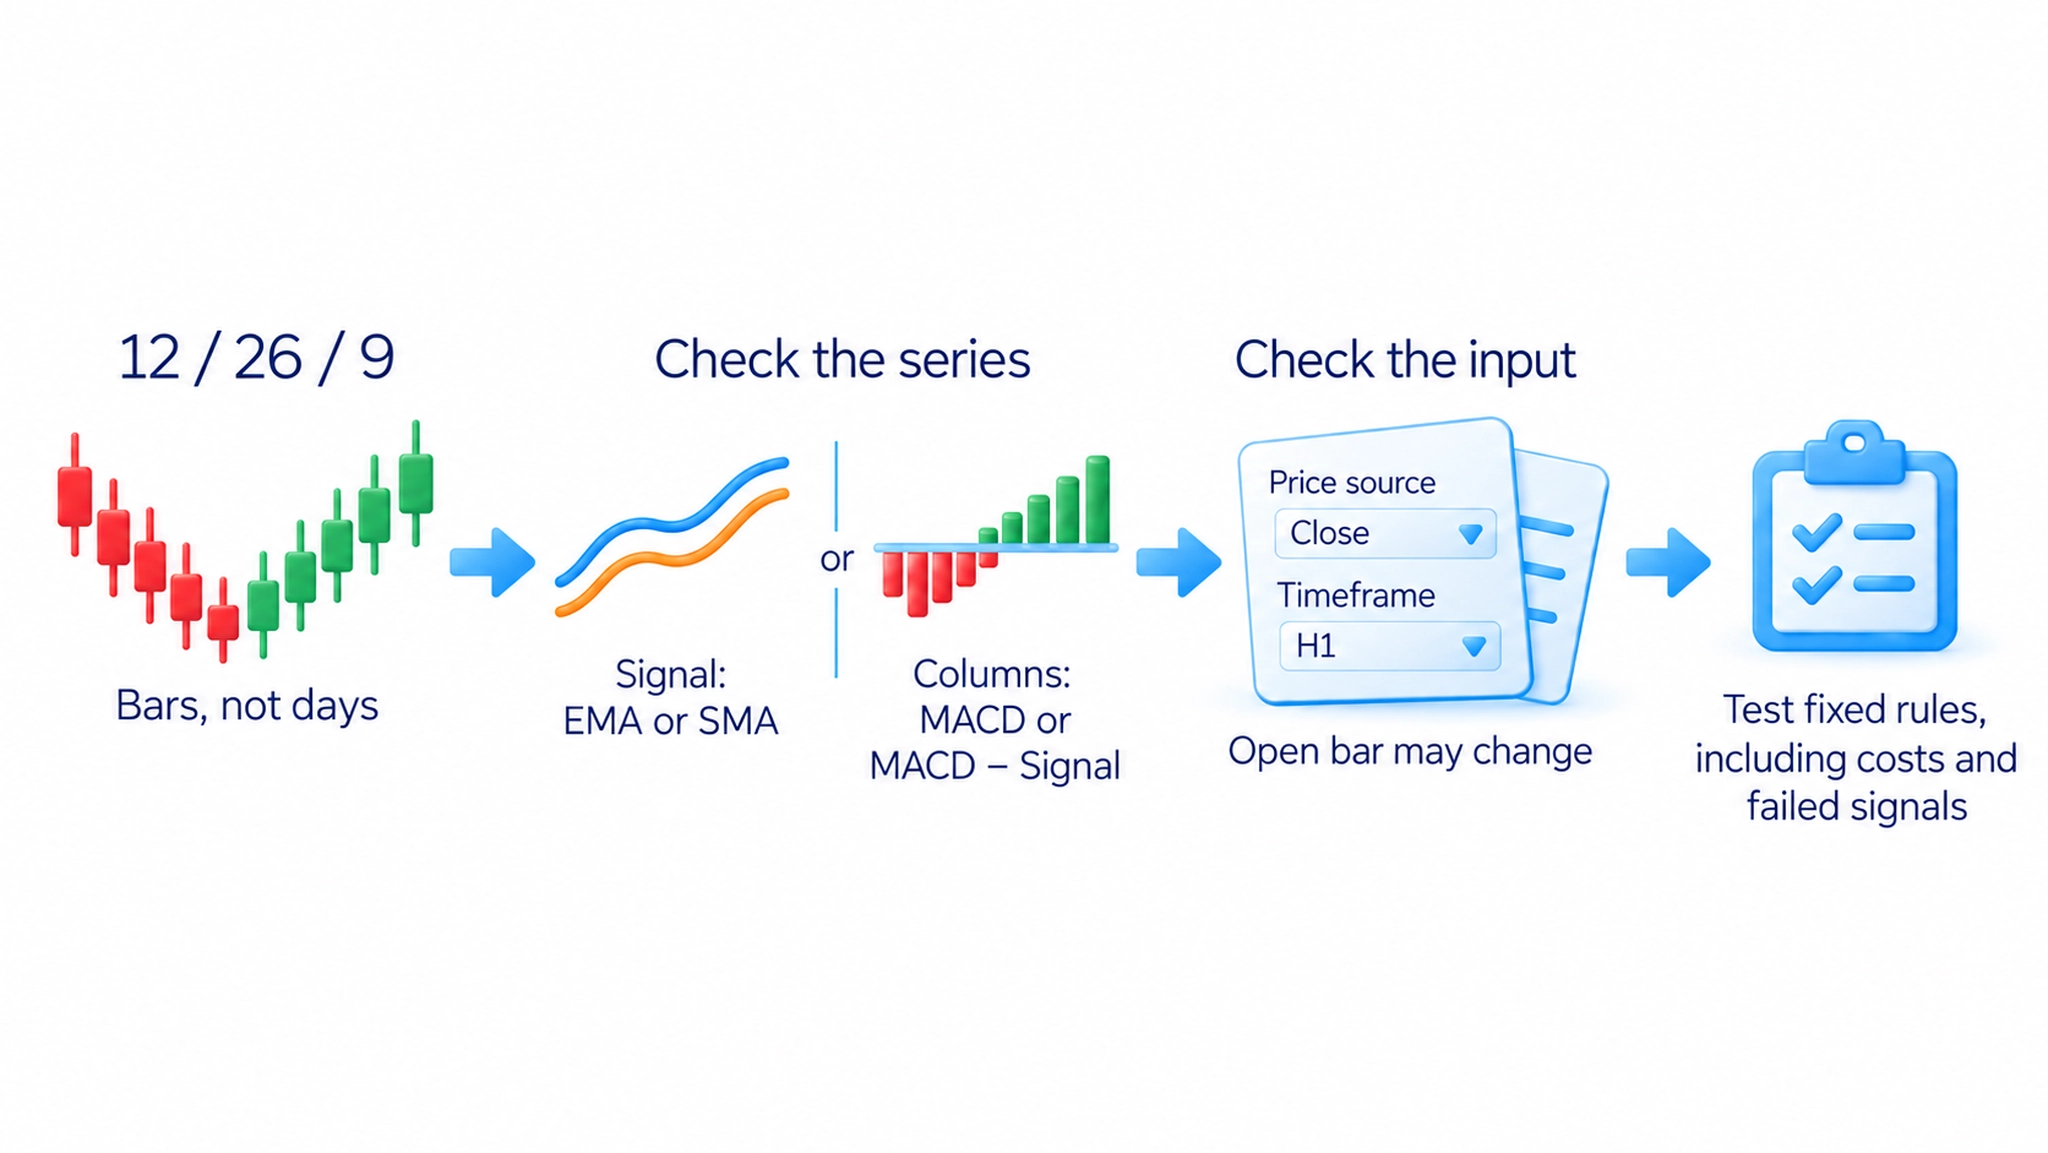
Check what the columns actually represent. Some implementations draw the main MACD difference as columns, while the usual MACD histogram shows main MACD minus signal. A display difference is not conflicting market information if the programs are plotting different series. Read the indicator's definition before comparing their colours or crossings.
The latest price can change while a bar is still open, so MACD and its crossing can change too. A crossing seen during the bar may disappear by the close. If your condition requires a completed bar, wait for it; the final historical plot does not prove that the same value was available earlier inside the bar.
An hourly MACD can be negative during a short decline while the daily MACD remains positive. The calculations process different sets of periods. This is not a vote about the next move; label the chart interval and observation time so you know which part of the movement each reading describes.
Using MACD alongside price
Price indicators can disagree because they transform the same data differently. Stochastic compares a close with a selected high-low range, while MACD compares averages. The RSI guide explains another calculation based on the balance of price changes. Agreement among these outputs does not turn them into independent evidence about participants or future orders.
In my course, I place indicators after price structure, levels and trading volume, the quantity traded in the selected data source. A calculation can help describe a movement already noticed, but should not replace the reason for a decision. The course's section on indicators establishes this supporting role; it does not provide a separate personal MACD crossover system.
The video on indicator lag explains why I do not begin training with the search for a perfect indicator. It provides optional practical context for the general calculation principle. Start the written exercise with price direction and location, then state what MACD adds: average position, a changing gap or disagreement with price.
MACD does not determine how much money you can afford to lose. A proposed trade needs its own invalidation condition and quantity to trade, explained in the risk-management guide. Several calculated lines agreeing is not a reason to increase the loss budget.
For a practical check, choose one signal definition, its settings and the observation time. You might examine a main-line crossing of the signal at the bar's close. Do not add a zero-line or divergence requirement afterward only to the successful examples. Record the instrument, chart interval and price source with each observation.
Compare the same trade rules with and without that condition, including costs and failed cases. If the result requires changing parameters after each review of history, you have not established a repeatable condition. MACD's formula explains its reading; whether a chosen use adds value needs a separate test.
Frequently asked questions
It shows the difference between two smoothed price averages. The signal line smooths MACD, and the usual histogram shows their difference. These readings describe the selected price data, not participants' intentions.
The fast price average has crossed the slow one. This differs from the main MACD crossing its signal line. MACD can cross the signal upward while remaining below zero.
The common starting lengths are 12, 26 and 9, but no set is universally best. Check average types, price source, chart period and bar-reading time too. The same lengths can produce different platform displays or calculations.
No. Divergence compares corresponding price and indicator turning points. It can draw attention to weaker movement, but the trend may continue. Price itself still needs a separate check before an entry.
They process price differently: MACD compares averages, while stochastic places a close within a range. Their readings need not agree. Even agreement does not guarantee a successful trade or supply independent information about market participants.
About the author
Igor Arapov, practising trader since 2013 and author of the ArapovTrade library. ORCID: 0009-0003-0430-778X.




