All topics: trading questions and answers
Learn what volume measures and how price-and-activity interpretations are tested. Each short answer links to its written explanation.
1. Reading trading activity
Volume analysis
What does trading volume show?
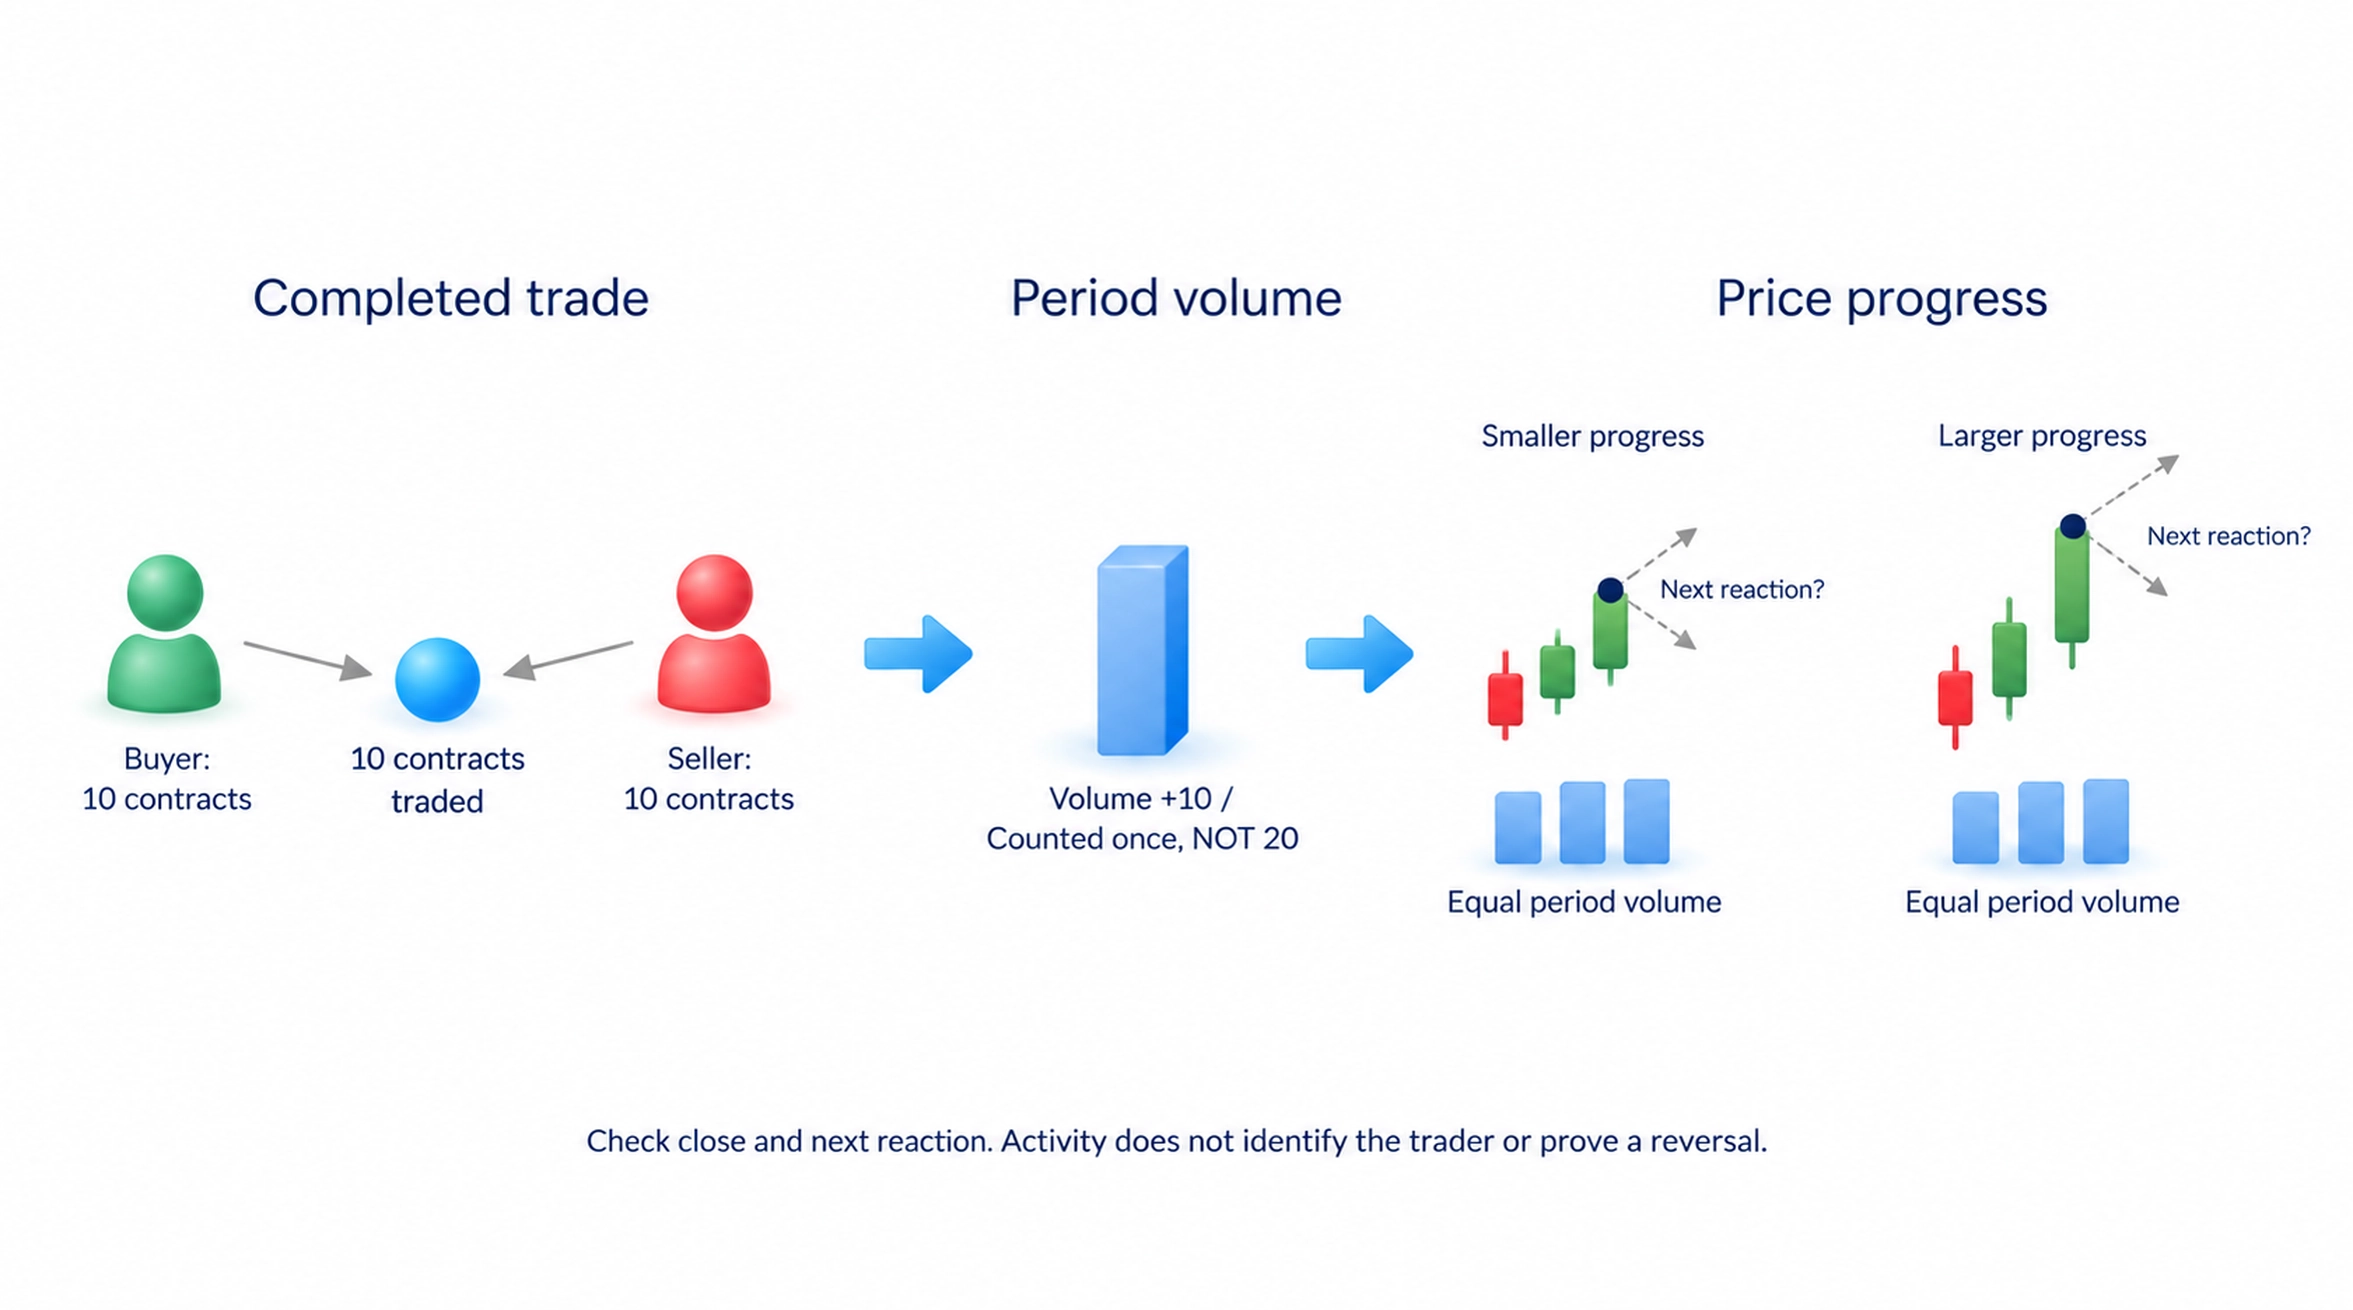
Exchange volume measures quantity traded during a period, such as shares or futures contracts, rather than the number of traders. A completed trade contributes its quantity once, although it has both a buyer and a seller.
Effort vs result
What does effort versus result mean in Wyckoff?
In Wyckoff analysis, traded quantity is the effort and price progress is the result. Large activity with limited progress can suggest opposing orders limiting movement. Check the closing position and subsequent reaction; the observation does not identify a participant or confirm a reversal.
Price-volume divergence
What does a new high on lower volume mean?
It can suggest that a price move is attracting less trading activity. Arapov treats this as a warning to examine the move, not a guaranteed reversal.
Weak demand and supply
Why can price fall without a surge in selling?
Arapov explains that reduced buying demand can allow price to fall. Similarly, limited selling supply can allow price to rise.
Volume Profile
What are POC and the value area?
POC is the price with the most traded volume in a profile. The value area covers a concentration of volume, with upper and lower boundaries called VAH and VAL.
Market Profile
How is Market Profile different from Wyckoff analysis?
Time-based Market Profile records which price areas were visited in separate time blocks; Volume Profile records traded quantity by price. Wyckoff instead examines price and activity as a developing sequence. These are different descriptions, not proof of who traded or a documented personal Market Profile rule.
Volume levels
How does Arapov choose a volume level?
In the course example, Arapov checks an area where active trading accompanied an advance that stalled. He then examines changed price structure, a return toward the earlier area and renewed movement. One volume concentration is not a complete entry condition.
Exchange vs tick volume
Is all volume data the same?
No. Exchange volume measures quantity traded in the selected market. Retail Forex tick volume counts incoming quote updates, not all global currency transactions. Futures and individual crypto exchanges also have their own coverage.
Automatic Rally
What is an Automatic Rally?
An Automatic Rally is a significant rebound after intense selling stops near a Selling Climax. In an accumulation schematic, its high helps identify the developing range’s upper area. The rebound alone does not confirm completed accumulation.
Spring vs upthrust
How is a spring different from an upthrust?
A spring passes below support and returns inside suspected accumulation. An upthrust passes above resistance and returns below it; a UTAD is that kind of test late in suspected distribution. Neither is mandatory, and the next reaction still matters.
SOS vs LPS
What are SOS and LPS?
A Sign of Strength, or SOS, is clearer upward progress in the developing range. A Last Point of Support, or LPS, is the later pullback or support test, often with a smaller price range and lower volume. SOS does not have to be the final exit from the range.
Open interest vs volume
How is open interest different from volume?
Volume counts contracts traded during a period. Open interest counts contracts still open. High trading volume does not necessarily mean more positions remain open.
High and low volume nodes
What are HVN and LVN?
High-volume nodes, or HVNs, have relatively large accumulated volume; low-volume nodes, or LVNs, have relatively little. They describe the selected profile. On a return, check whether price hesitates or passes through; neither distribution guarantees its next speed or direction.
Session vs composite profile
How is a session profile different from a composite profile?
A session profile covers one session. A composite profile combines a longer period, so the choice changes the scale and purpose of the analysis.
Initial Balance
What is Initial Balance in Market Profile?
Initial Balance is the high-to-low range during the profile’s selected opening period, often the first hour. Check the session start and included time blocks. Later movement beyond that range does not by itself predict the rest of the session.
Single prints
What are single prints?
Single prints are price rows represented by only one time block in a selected time-based profile, not by one trade. A later visit can remove that status. Detection rules and settings matter, and the area does not require a future return.
2. Interpreting market phases
Wyckoff method
What is the Wyckoff method based on?
It compares supply and demand, cause and effect, and effort versus result. Price and volume help test the development of a range. Volume does not reveal every holder’s position or guarantee the next direction.
Wyckoff market cycle
What are accumulation and distribution?
Accumulation describes position-building before an advance; distribution describes selling before a decline. The cycle also includes the rising markup and falling markdown phases.
Wyckoff accumulation
What does Arapov look for in accumulation?
The written checks look for a decline stopping, a range developing and tests of its lower area, followed by evidence of strength. A spring can be one test but is optional. Sideways movement alone does not confirm accumulation or a completed bottom.
Wyckoff on Forex and crypto
Can Wyckoff be used outside the stock market?
Arapov applies its price-and-volume ideas to other markets, but checks the data source. Forex and crypto volume have different coverage and reliability limits.
Composite Operator
Who is the Composite Operator?
It is a way of modelling the combined actions of large market participants. It does not mean one person controls the whole market.
Wyckoff phases A–E
What do accumulation phases A to E describe?
They describe the decline stopping, the range developing, a supply test, signs of strength and an advance beyond the range. Real markets need not follow the schematic exactly.
3. Understanding large participants
Smart Money
What does Smart Money mean?
Smart Money names large professional participants and their capital. Their purposes differ, and they can trade in opposite directions or lose money. Arapov compares activity with price progress and the next reaction rather than identifying a bank from one shape.
Large order execution
Why do large traders split their orders?
Buying or selling a large amount at once can move the price against them. Smaller orders can help build or close a position over time.
Smart Money and market phases
How does Arapov connect Smart Money with Wyckoff?
He uses accumulation, trending movement and distribution to explain how large participants build and close positions. Price and volume provide the observations for that interpretation.
Liquidity and manipulation
Does every market move mean manipulation?
No. Large trades can affect execution prices without deception. A false breakout does not prove spoofing, the placing of orders intended to mislead rather than execute. A permitted iceberg order that displays only part of its quantity is not automatically manipulation.
Bull trap vs bear trap
What are bull traps and bear traps?
A bull trap draws buyers into a move that fails; a bear trap draws sellers into a failed downward move. Arapov checks volume and the return through the level.
Large-player footprints
What clues does Arapov watch for large-player activity?
Arapov compares recorded trading quantity with how far price progressed and what happened next near an area. Heavy activity with limited progress can justify investigation, but does not identify the buyer or seller or prove a bank’s intentions.
SMC with volume
Why add volume to Smart Money Concepts?
Price zones can be marked in many ways after a move. Arapov adds exchange volume to check whether meaningful trading activity supports the interpretation.
BOS and CHoCH
What do BOS and CHoCH mean?
A break of structure, or BOS, usually passes a selected high or low in the existing direction. A change of character, or CHoCH, breaks against that sequence. Specify which turning points count and whether a candle must close beyond them; labels alone do not define entry.
SMC mistakes
What mistakes does Arapov warn about in SMC?
Do not enter from a marked zone or brief level crossing alone. Define the required reaction, the movement that would cancel the idea, the exit and trade quantity beforehand. If the exit distance is too large for the loss budget, reduce quantity or skip the trade.
Liquidity-grab entry
How does Arapov plan a trade after a liquidity grab?
The written scenario checks a failed break and return through the level, then the following reaction. The exit for a failed idea is planned beyond the failed break before entering. This is a conditional plan, not proof that every sweep reverses.
4. Where orders may gather
Liquidity pools
What is a liquidity pool on a trading chart?
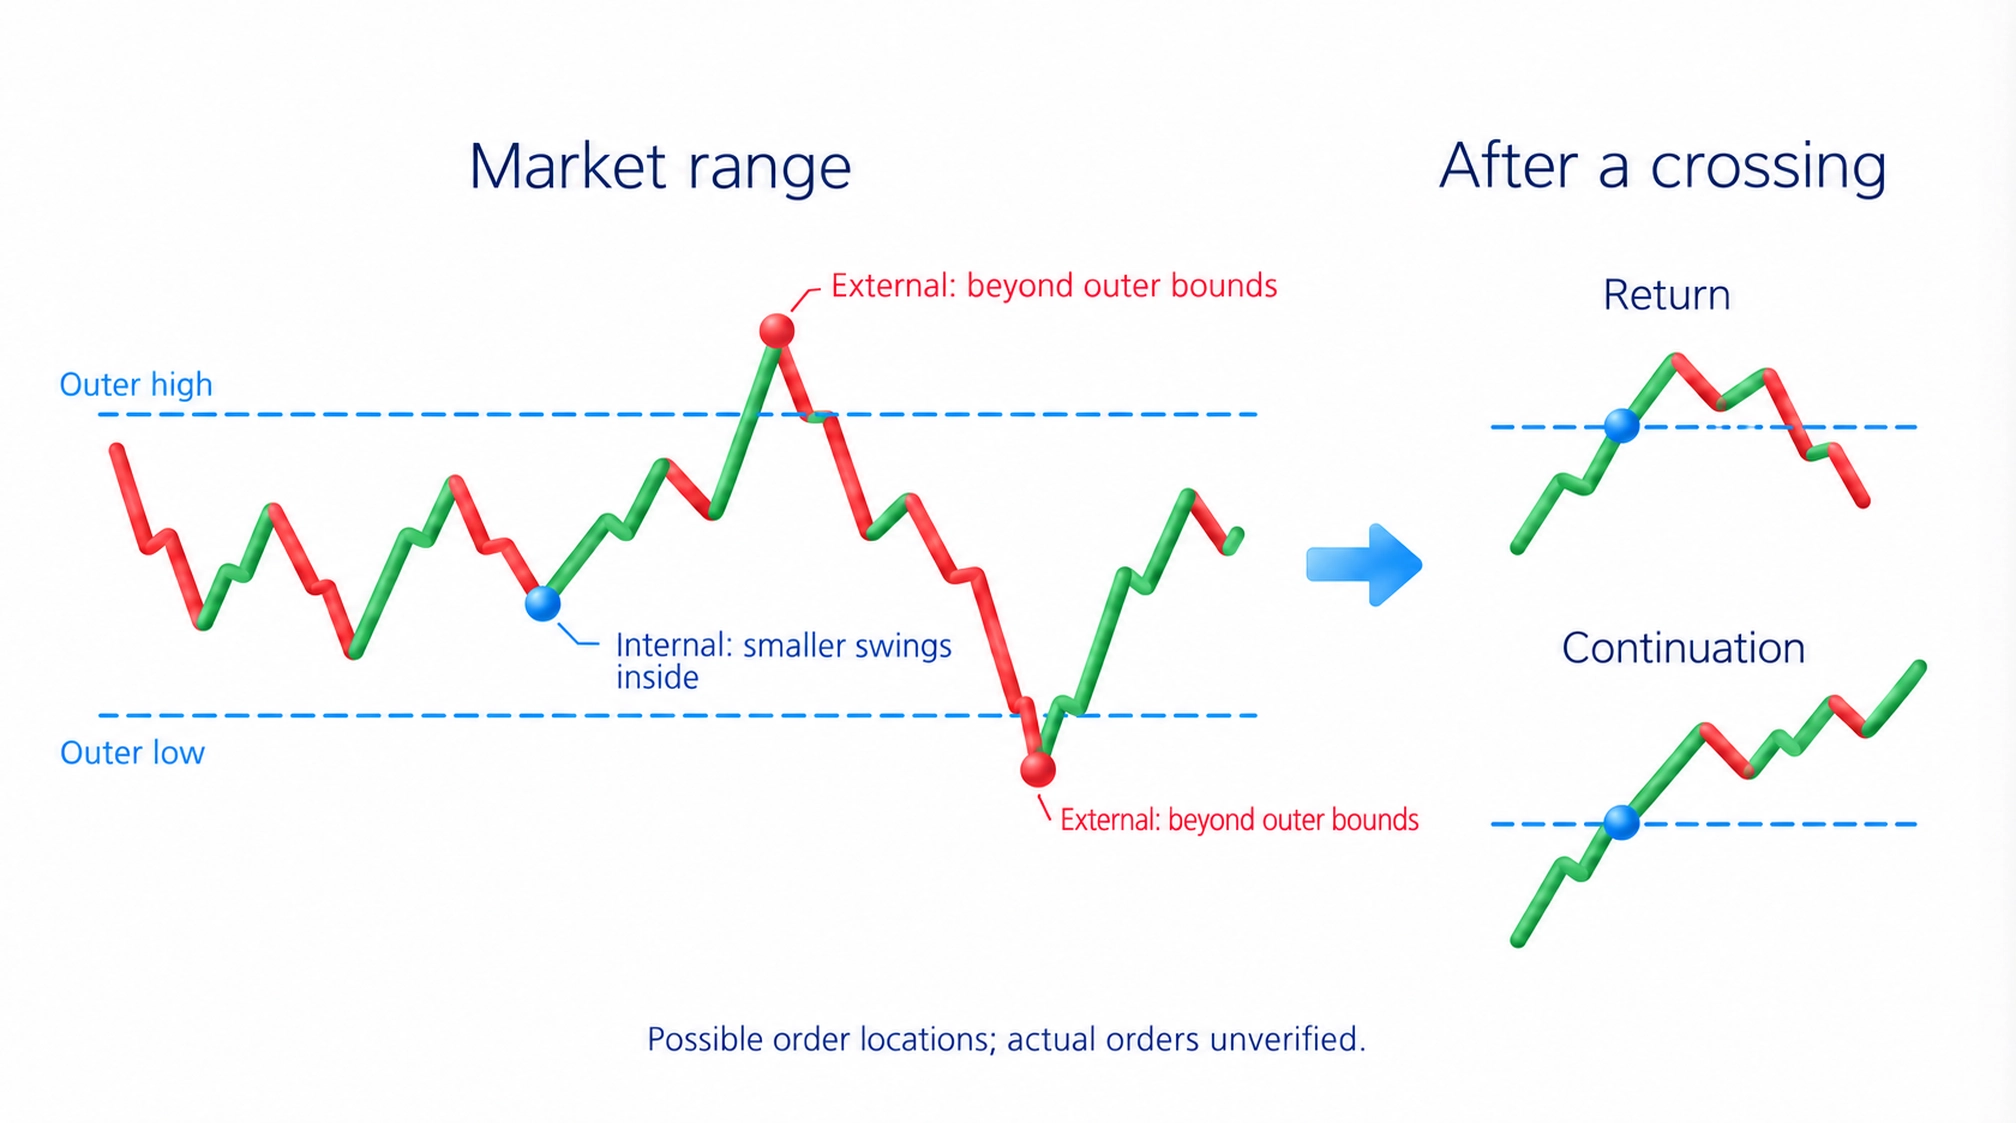
In Smart Money Concepts (SMC), it means a price area where stops or other orders may be concentrated. It is a chart interpretation rather than a visible list of every order, and it is different from a DeFi liquidity pool.
Liquidity sweep
What is a liquidity sweep?
It describes price moving through a visible price boundary associated with possible orders. Check whether price returns through that boundary or continues beyond it; crossing alone does not establish a reversal.
Equal highs and lows
Where does Arapov look for liquidity zones?
The written checklist considers repeated highs and lows, session boundaries, daily or weekly extremes and round numbers. These are possible areas to check, not a verified universal personal routine; the following price reaction matters.
Sweep confirmation
Is a liquidity sweep enough to enter?
No. A return inside the old boundary still needs a subsequent reaction, such as a pullback holding the area and renewed movement. Before entry, define what would cancel the idea, the planned exit and the quantity that fits the permitted loss. A protective exit does not guarantee an exact fill.
Internal vs external liquidity
How is internal liquidity different from external liquidity?
External liquidity is beyond a range's outer highs or lows. Internal liquidity relates to smaller structures within the range.
5. Zones before strong moves
Order block
What is an order block?
A common SMC convention marks the last opposite-direction candle before a strong move through a selected high or low. It creates an area to test on a return, not proof that bank orders remain there. The convention is separate from the course’s general price-and-activity sequence.
Finding an order block
How does Arapov find an order block?
Choose the chart period and meaningful high or low first. Find the last opposite-direction candle before the move through that boundary, then fix which prices define its area. A smaller chart period can examine the return more closely; this does not establish a compulsory personal top-down order-block rule.
Order-block entry
Does Arapov enter as soon as price touches a block?
The course checks an area, trading activity and the next movement rather than entering from the first prominent candle alone. On a return to a block, assess whether movement against the intended trade stops and the intended direction resumes. Marking blocks is not a separate compulsory course rule.
Order-block mitigation
What does mitigation mean in SMC?
It describes a return to and reaction at a previously identified order block. A later return still needs fresh assessment rather than assuming the zone will hold.
Breaker block
What is a breaker block?
It is a former order block that has been broken and is considered in a new role. A former demand area may act as resistance, or supply as support.
6. Areas left by rapid moves
Imbalance vs FVG
How is an imbalance different from an FVG?
Imbalance can mean unmatched buying or selling quantity under a venue’s order rules. In SMC it often names rapid directional movement. An FVG is a particular three-candle non-overlap; its rectangle does not measure the exact difference between orders or prove an empty market.
Fair Value Gap
How do I recognise an FVG?
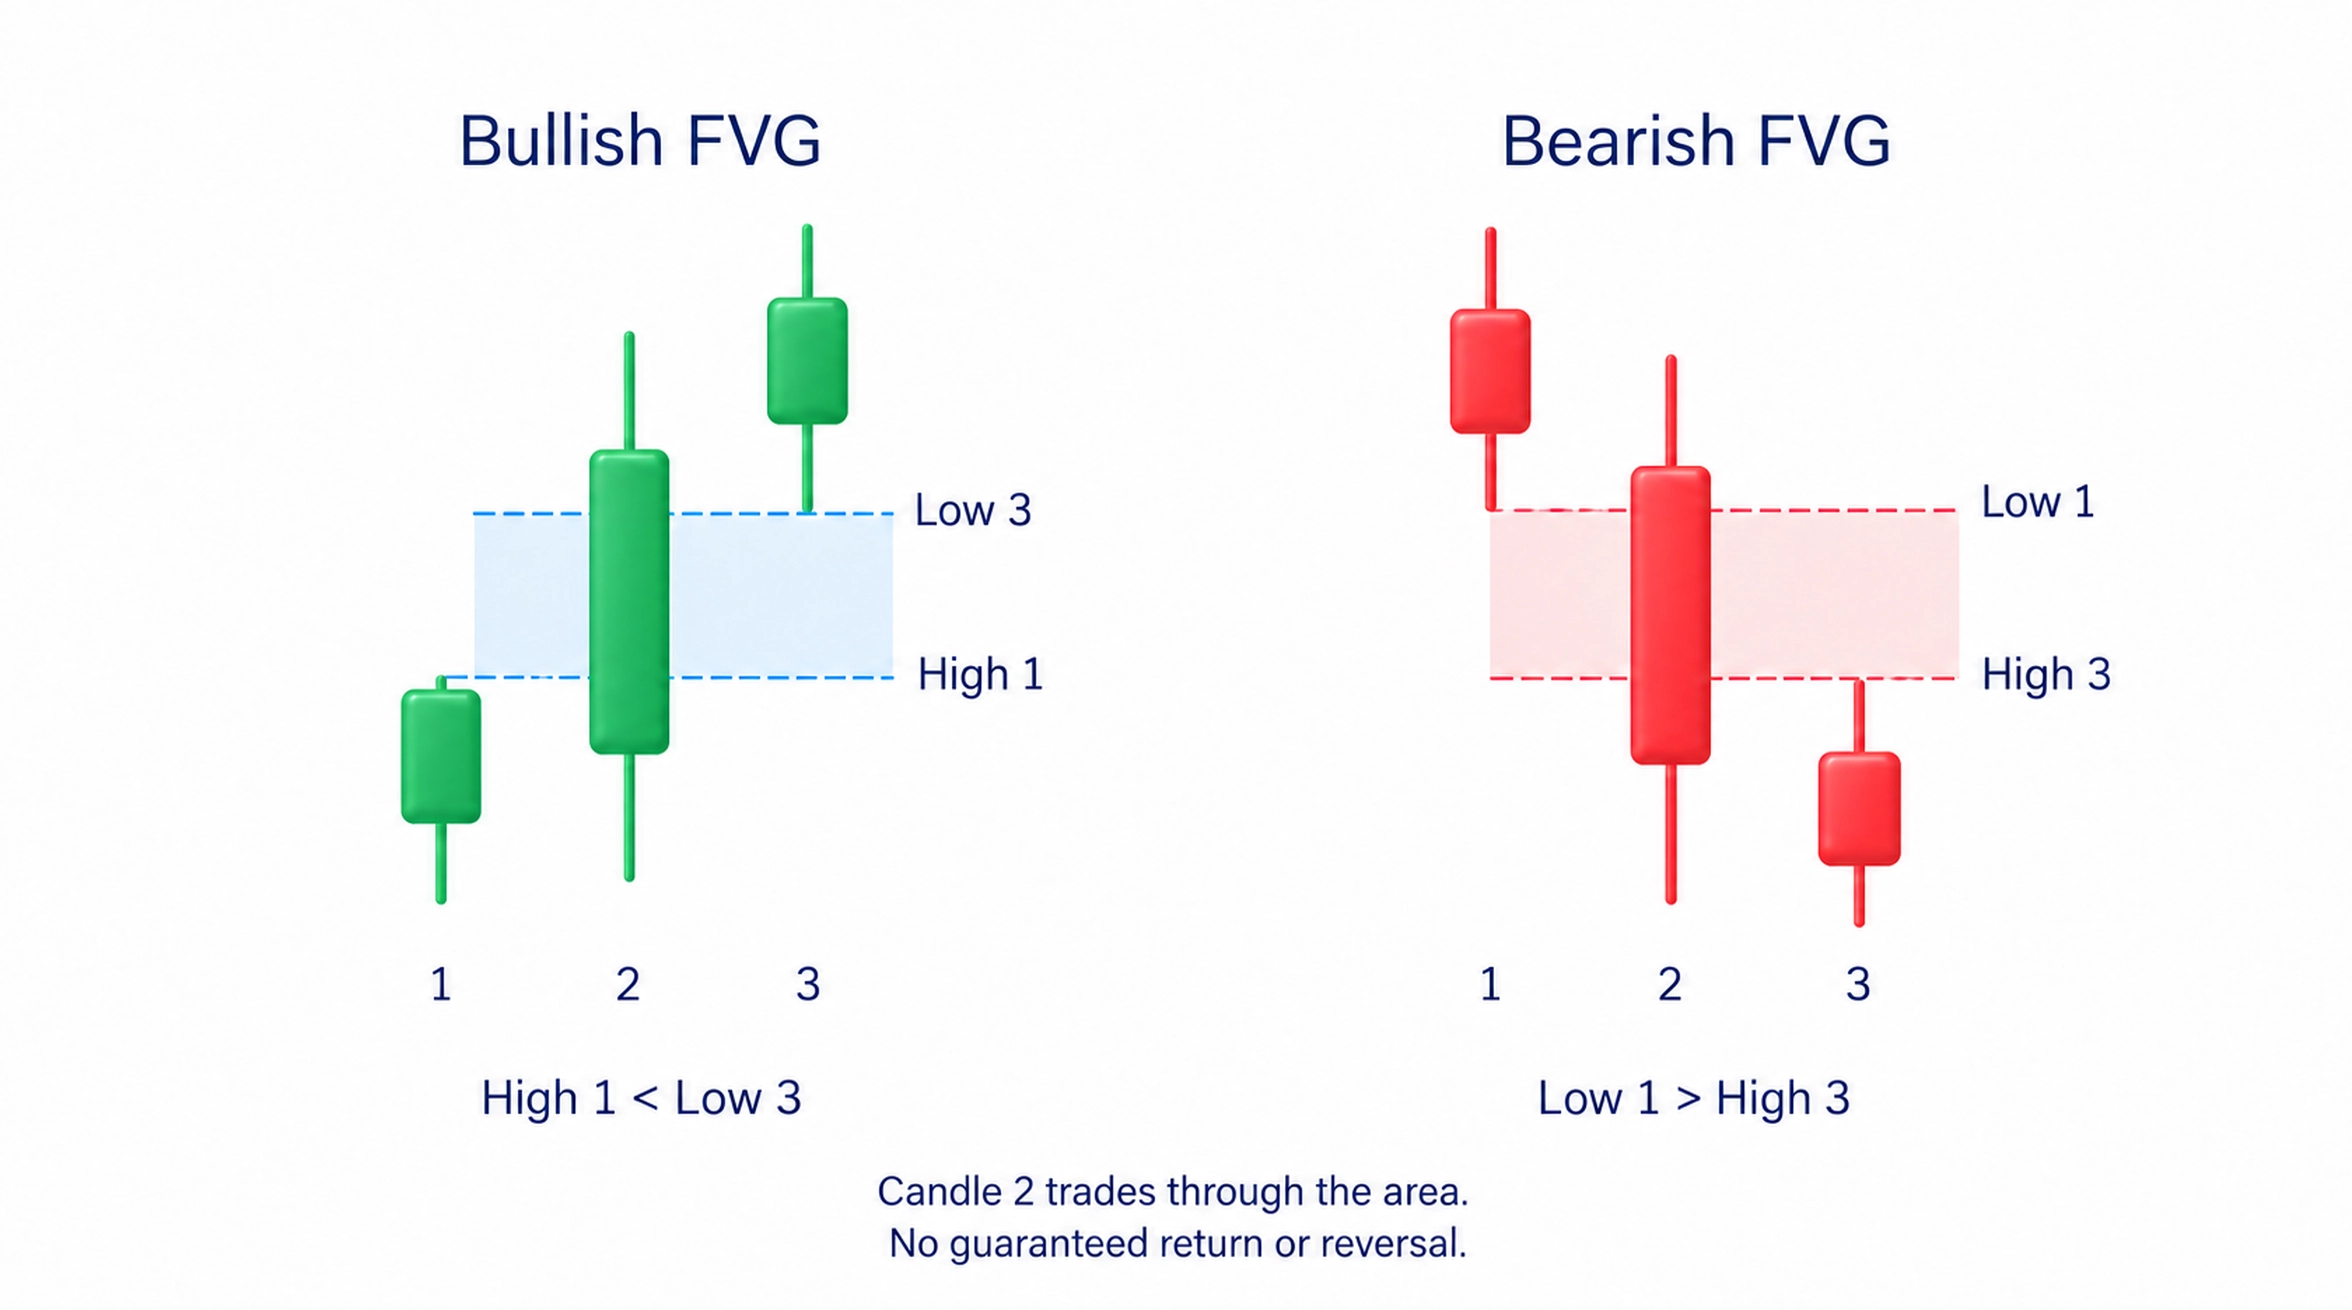
In a bullish FVG, the third candle's low is above the first candle's high. A bearish FVG reverses that relationship. The middle candle carries the strong move.
FVG pullback
Does price always return to an FVG?
No. The area can remain unvisited, and price can cross it without reversing. A marked gap does not guarantee later trading interest.
Order block and imbalance
How can an order block connect with an imbalance?
An order block uses a selected candle near a move’s starting area; an FVG uses non-overlap between the first and third candles. They can describe the same move and overlap, so they are not automatically two independent confirmations. Check the later reaction and trading activity.
FVG and volume
What makes an FVG worth watching in Arapov's approach?
The course checks a return toward an earlier breakout area, the trading activity and whether the expected direction resumes. It does not establish a compulsory FVG marking rule. If an FVG is present, it supplies a location to examine; its name cannot replace the later response.
About these learning materials
This section draws on the ArapovTrade library and Igor Arapov’s educational videos. It offers definitions, instrument comparisons, explanations of market mechanics and the author’s trading approach.
The library’s author is Igor Arapov, a practising trader since 2013. The detailed lessons explain each subject in context; these short answers provide a starting point.




