All topics: trading questions and answers
Learn what price charts show and how to read candles, movement and marked areas. Each short answer links to its written explanation.
1. Reading a price chart
Technical analysis
What is technical analysis?
It studies price charts and trading volume to assess market movement. Traders use it to identify possible conditions for a trade.
Types of price charts
How are line, bar and candlestick charts different?
A line chart usually connects closing prices, although its input can be changed. Ordinary bars and candles also show the opening price and the highest and lowest prices for the period. Check the settings before comparing their shapes.
Bars vs candles
Do bars and candles show different data?
Ordinary bars and candles show the same opening, highest, lowest and closing prices for a period, with different drawings. Some bar settings omit the opening price. Synthetic charts can show calculated prices rather than the original recorded prices.
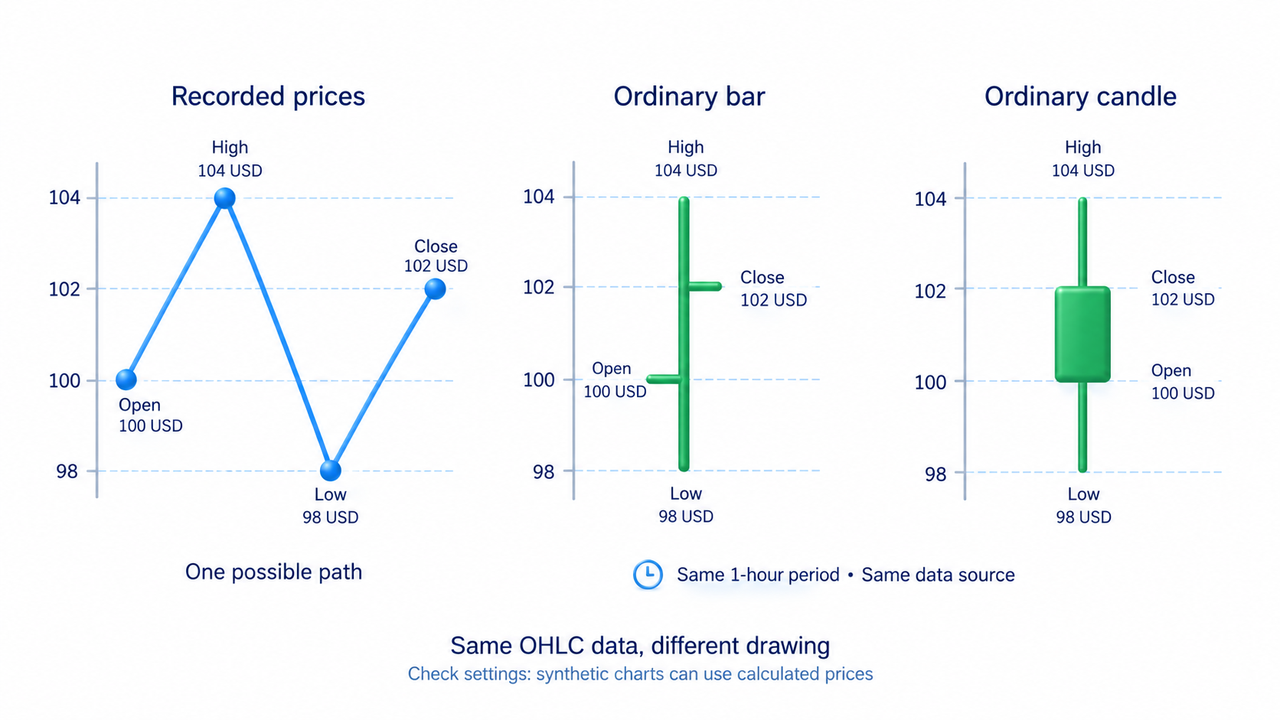
Chart timeframe
What is a timeframe?
It is the period covered by one candle or bar. On an hourly chart, each candle represents one hour of price movement.
Multiple timeframes
Why look at more than one timeframe?
A higher timeframe shows the broader movement. A lower one can help examine an entry more closely, keeping the trade in context.
Trend vs range
What is a trend, and what is a range?
A trend is a sustained move mainly up or down. A range is movement between boundaries without a clear lasting direction.
Support and resistance
Why treat support and resistance as zones?
Price may react near a previous level rather than exactly at it. Arapov therefore looks at an area of reactions instead of a single precise line.
Trading between levels
How does Arapov trade from one level to another?
He looks for an entry near a meaningful zone and a target near the next one. The plan includes where to exit if the idea fails.
Trend channel
What is a trend channel?
It is an area between two boundaries along which price moves. A channel can slope up, slope down or run sideways.
Impulse and pullback
How is a pullback different from an impulse?
An impulse advances the main move. A pullback temporarily moves in the opposite direction and gives back part of that move.
Chart pattern context
Why check levels before trading a pattern?
A shape alone does not explain the whole market situation. Arapov uses levels and volume to assess where the pattern formed and how price behaves there.
Volume on a chart
How does volume help with chart analysis?
Volume measures quantity traded in the selected data source. Compare that quantity with how far price moved and how it reacted near a level. More trading alone does not identify participants or establish the next direction.
2. When price crosses a level
Price breakout
What is a breakout?
It is a move beyond a support or resistance zone. Traders then check whether price stays beyond the boundary or quickly returns.
False breakout
How can I spot a false breakout?
Price moves beyond a level but returns inside the previous area. Arapov checks volume, whether price holds beyond the level and what happens next.
Stops beyond a level
Why can price break a level and quickly turn back?
Stops and other orders may sit beyond a visible level. When they trigger, they create trades, but that activity may not sustain further movement.
Breakout retest
What is a retest?
It is a return to a level after price has broken through it. The return helps show whether price behaves differently around that zone.
Breakout stop and target
Where does Arapov place a breakout stop and target?
In the failed downward-break purchase example, the low of that failed break helps define where the idea would be contradicted. An opposing price area provides a possible profit target. These references depend on the setup; a protective exit does not guarantee an exact fill.
3. Reading candle shapes
Japanese candlestick
What does a candlestick show?
It shows the open, close, high and low over a chosen period. The body spans the open and close; the wicks reach the highest and lowest prices.
Bullish vs bearish candle
What makes a candle bullish or bearish?
A bullish candle closes above its opening price. A bearish candle closes below it. Colours can be changed, so the prices matter more than the colour.
Pin bar
What is a pin bar?
A pin bar has a small body near one end, a dominant long wick at the other and a relatively short opposite wick. Price moved toward the long wick but returned before the candle closed. Its shape alone does not confirm a reversal.
Engulfing candle
What is an engulfing pattern?
It is a two-candle pattern in which the second body covers the first in the opposite direction. Its meaning depends on location and the next price move.
Hammer, doji and evening star
How are a hammer, doji and evening star different?
A hammer has a long lower wick; a doji closes near its opening price. An evening star is a three-candle pattern considered after a rise.
Candlestick confirmation
Is one candle enough to enter a trade?
The same candle can appear in very different conditions. Arapov also checks the level, volume and the following price reaction.
Harami pattern
What is a harami?
It is a two-candle pattern where the smaller candle's body sits within the previous larger body. It may show a pause, but does not confirm a reversal by itself.
Hanging man vs hammer
How is a hanging man different from a hammer?
Their shapes are similar: a small body with a long lower wick. A hammer is considered after a fall; a hanging man after a rise.
4. Recognising price patterns
Trading patterns
What is a chart pattern?
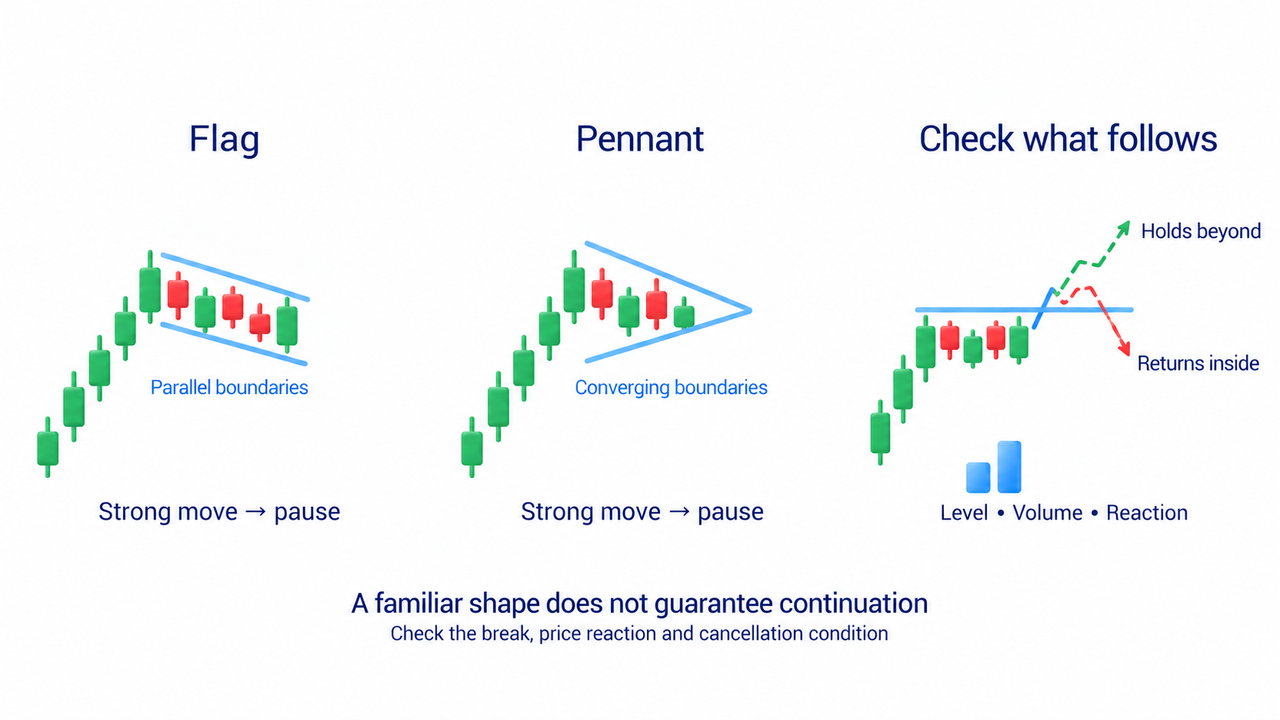
It is a recognisable price shape, such as a double top or triangle. A familiar shape does not guarantee a successful trade.
Reversal vs continuation
How do reversal and continuation patterns differ?
A reversal pattern points to a possible change in direction. A continuation pattern suggests a pause before the existing move resumes. Both need further checking.
Head and shoulders
How is a head-and-shoulders pattern confirmed?
A usual head-and-shoulders pattern has three peaks, with the middle peak higher. Its neckline joins the intervening lows; a break below that boundary completes the proposed reversal pattern. The shape and break do not guarantee further decline.
Double top and bottom
Do two peaks or lows always mean a reversal?
No. Price can remain in a range and continue the earlier move. Watch the level between the peaks or lows and how price behaves after it breaks.
Triangle patterns
What types of triangle patterns are there?
Ascending, descending and symmetrical triangles have narrowing boundaries. The shape alone does not guarantee which way price will break.
Flag vs pennant
How is a flag different from a pennant?
Both are pauses after a strong move. A flag has roughly parallel boundaries; a pennant has boundaries that converge.
Cup and handle
What is a cup-and-handle pattern?
Price forms a rounded decline and recovery resembling a cup, followed by a smaller pullback near its upper area called the handle. A break above the handle is the proposed completion condition. A familiar shape does not guarantee continuation.
1-2-3 reversal
What is a 1-2-3 pattern?
In a bullish example, point one is a low, two is the rebound high and three is a higher low. A break above two completes the proposed reversal. Entering at three is earlier and risks acting before that condition occurs; the bearish version reverses the directions.
Pattern entry signals
Is a chart shape enough to open a trade?
No. Arapov also checks the price level, volume, market reaction and stop location. Similar shapes can lead to different outcomes.
Rising and falling wedge
What is a wedge pattern?
A wedge has two narrowing boundaries sloping in the same direction. A rising or falling wedge may suggest weakening movement, but the breakout still needs checking.
5. Understanding wave counts
Elliott Wave basics
What is Elliott Wave Theory?
It labels directional movement and pullbacks as waves nested within larger waves. The basic teaching model has a five-wave phase followed by an A–B–C correction, but corrections can be more complex. A count is an interpretation, not a guaranteed future sequence.
Wave psychology
How do Elliott waves relate to trader emotions?
The theory interprets its patterns as changes in crowd confidence. A wave label does not measure any participant’s emotions, and a plausible count does not make the next movement certain.
Wave-counting mistakes
Why can people count Elliott waves differently?
Different starts, levels within the wave hierarchy and boundaries of an unfinished correction can produce different counts. Record those choices and the price condition that would invalidate the count before viewing later prices. Renumbering after the outcome does not prove the earlier count was useful.
6. Measuring pullbacks and targets
Fibonacci retracement
What do Fibonacci retracement levels show?
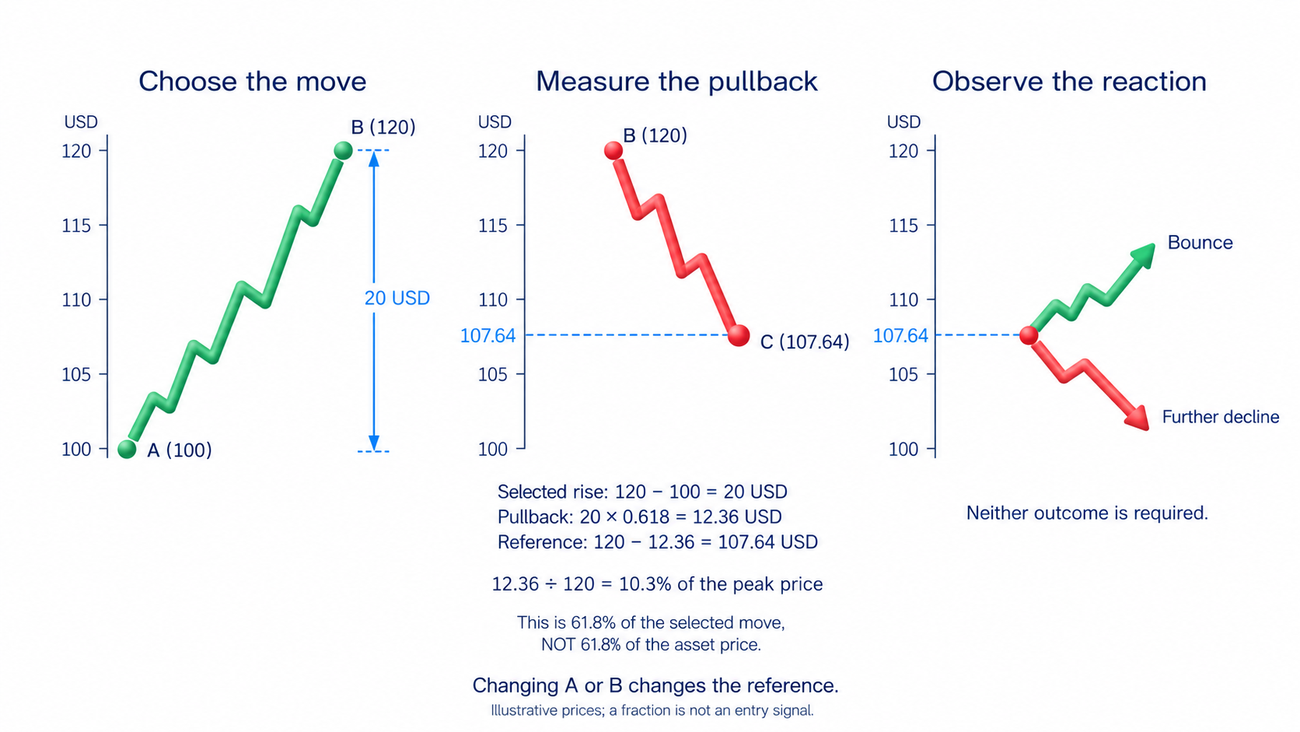
They mark fractions of one selected price movement. A 61.8% retracement gives back that fraction of the move, not necessarily 61.8% of the asset’s value. The marks are references to observe, not compulsory turning points.
Drawing Fibonacci levels
How do I draw a Fibonacci retracement?
Choose a clear price move and mark its start and end. Changing those points also changes the levels shown on the chart.
61.8% retracement
Does price always turn at 61.8%?
No. A 61.8% retracement describes the fraction of the selected move given back; it does not force a reversal or establish the strongest entry level.
Fibonacci trade setup
How does Arapov plan a Fibonacci trade?
The course example checks a price area, the response of price and trading activity. It does not specify a compulsory personal Fibonacci entry or stop rule. For a drawing, choose the move first, then set the price reaction and cancellation condition before testing it.
Fibonacci and volume
Why combine Fibonacci with volume?
Volume is the quantity traded in the selected source. Read it with the response of price near the chosen reference area: a large quantity alone does not confirm a reversal. The course teaches that relationship, not a separate compulsory Fibonacci setup.
Fibonacci extension
How is a Fibonacci extension different from a retracement?
A retracement measures the part of a selected move given back. An extension projects a chosen multiple of a move; in a three-point tool the projection starts at C. Depending on that start and multiplier, the projected price need not lie outside the original range.
About these learning materials
This section draws on the ArapovTrade library and Igor Arapov’s educational videos. It offers definitions, instrument comparisons, explanations of market mechanics and the author’s trading approach.
The library’s author is Igor Arapov, a practising trader since 2013. The detailed lessons explain each subject in context; these short answers provide a starting point.




