Price Action studies the sequence of price movements and reactions around selected areas. Its practical purpose is to connect observation with a decision: what is being tested, when confirmation becomes available and what subsequent movement would invalidate the hypothesis. This guide combines structure, levels and candles into one workflow. Definitions of individual patterns are covered in the Japanese candlestick reference; here the focus is their role within a complete scenario. Every diagram and numerical example below is hypothetical.
What reading price means in practice
Price leaves a sequence of highs, lows and closes. A single candle shows only part of that sequence: a similar shape can appear after an impulse, during a pullback or in the middle of a range. Analysis therefore begins with the current movement; recognising a pattern helps refine that initial question.
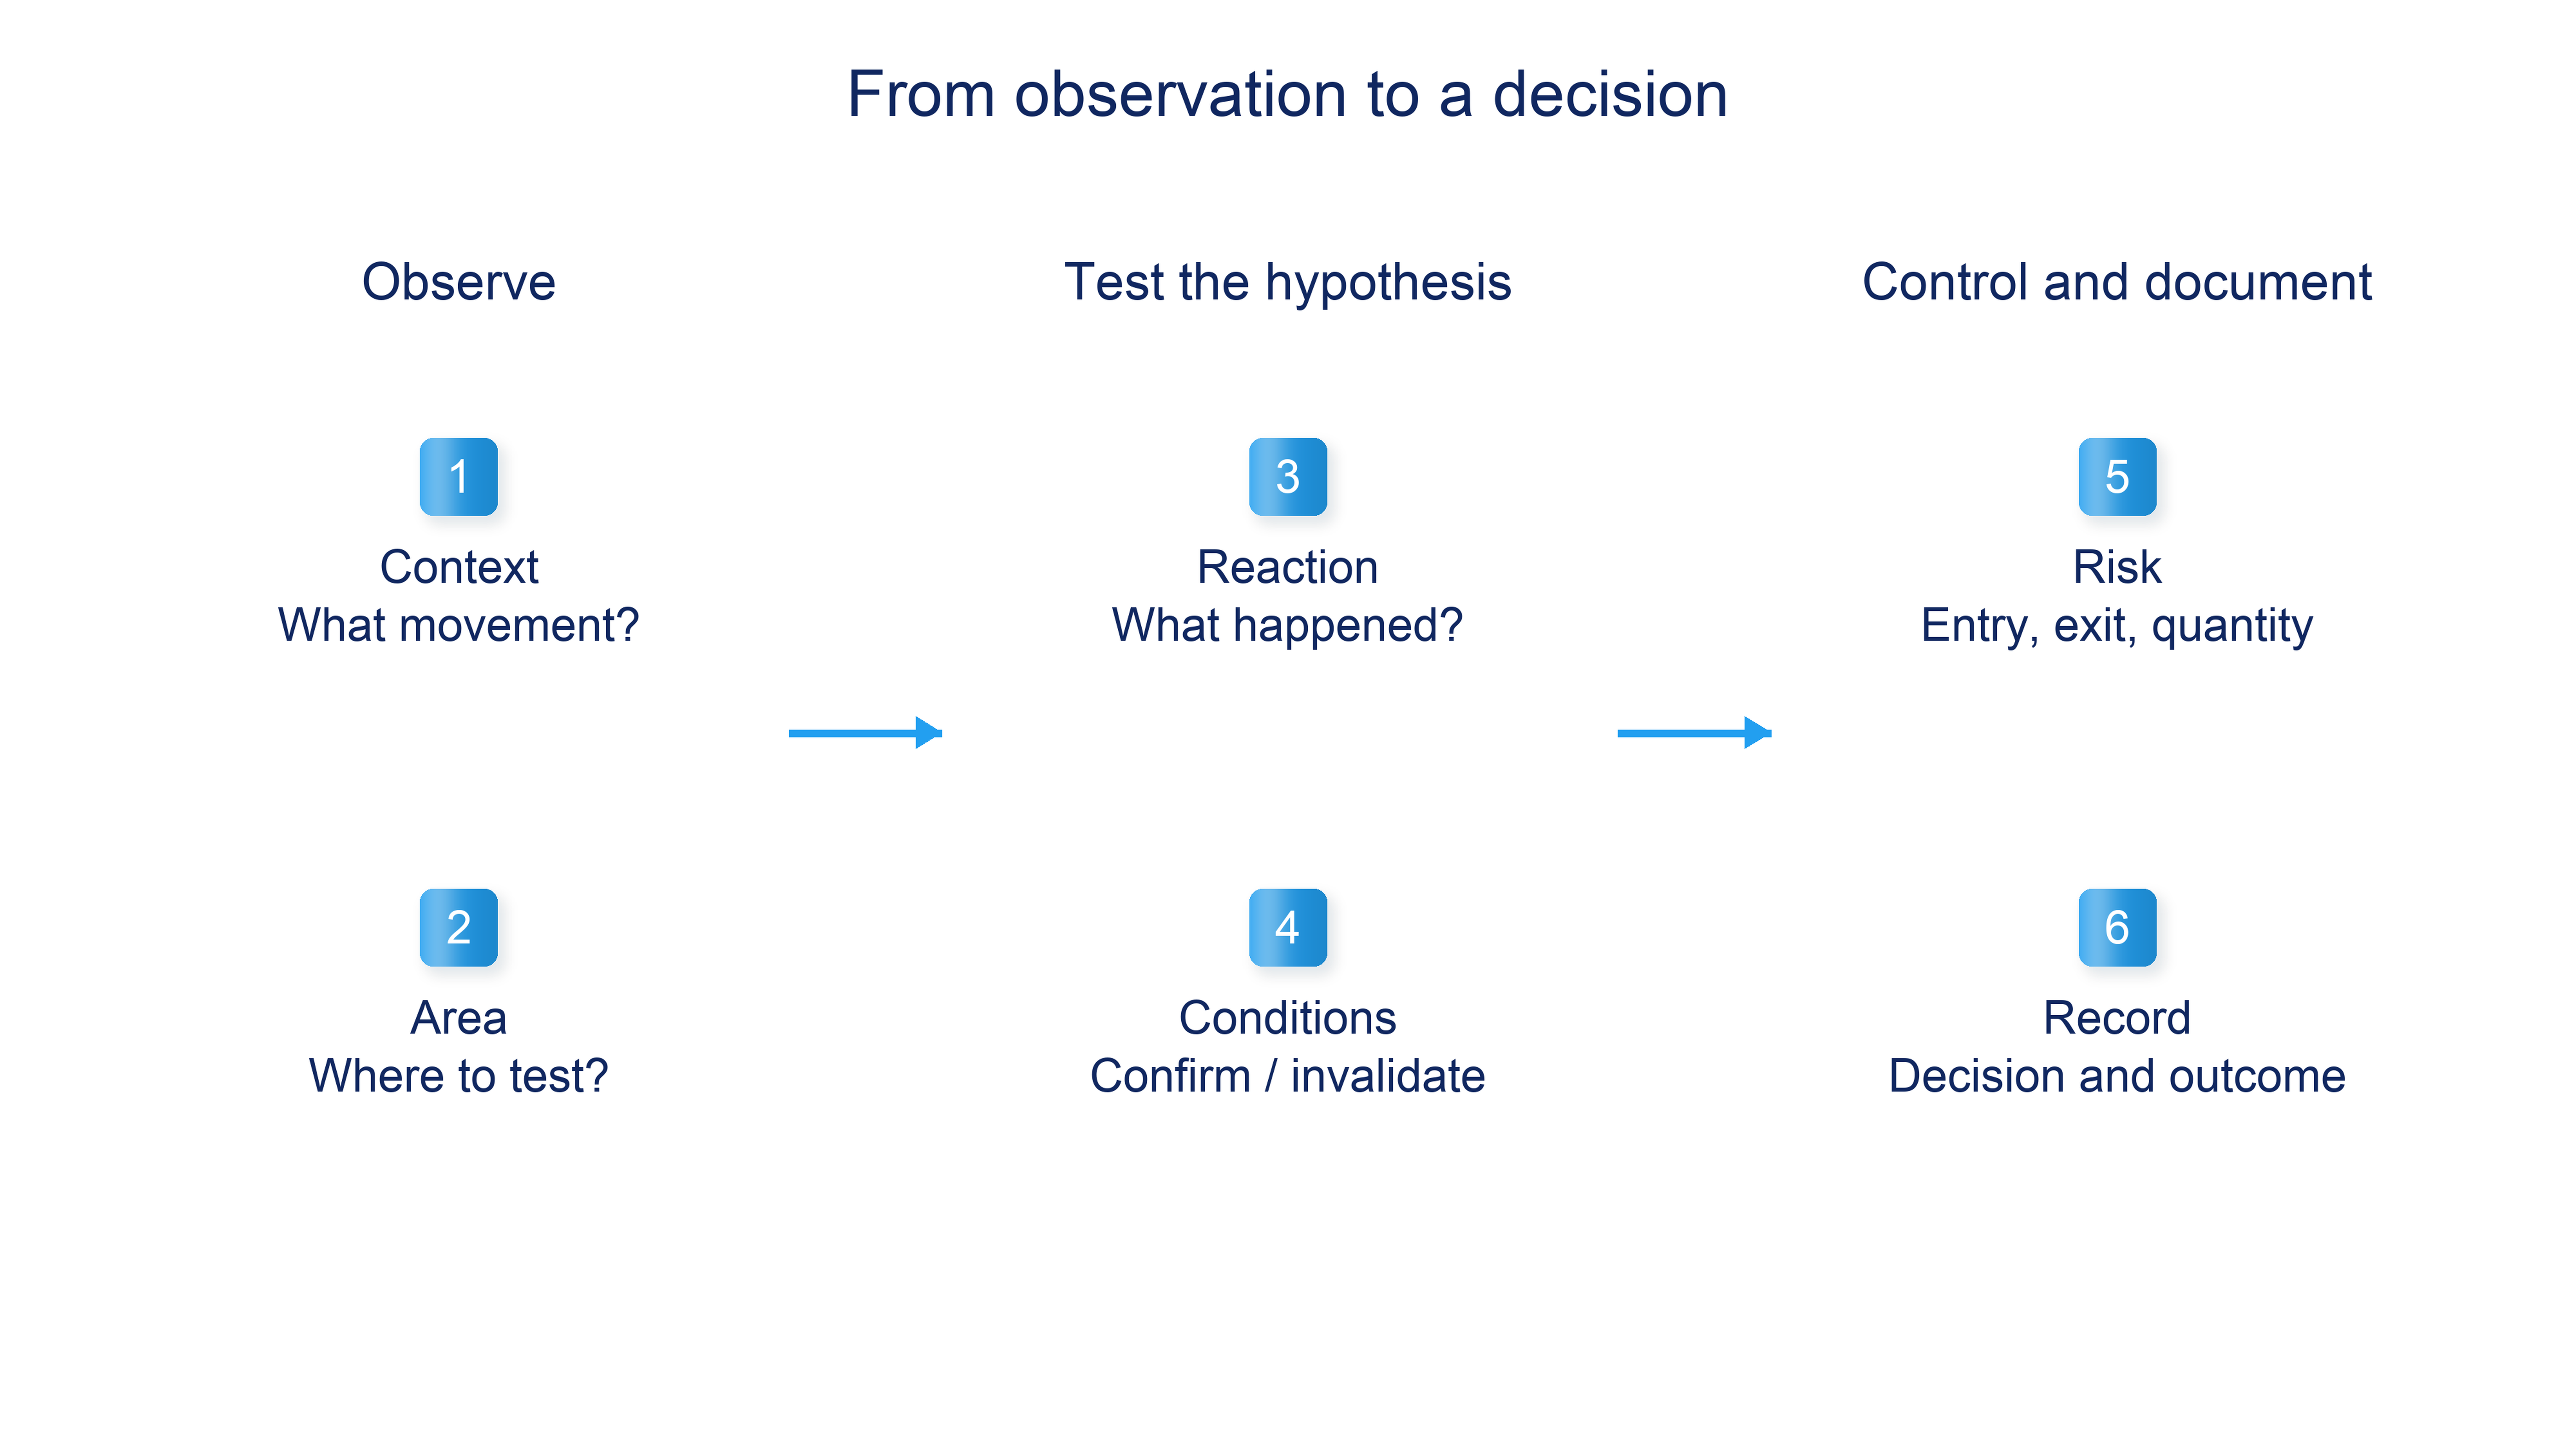
The working sequence is to identify context, select an area of interest, wait for a reaction and check for a predefined continuation. Then compare the available entry price with the exit if the hypothesis fails. When a required condition is missing, the decision may be to skip the trade rather than relabel the same candle.
For example, an approach to previous support raises the question of whether it holds. A return above the area can be the first observation, and a subsequent close above a local high the confirmation condition. Continuation below the selected low invalidates that particular hypothesis that support will hold; it does not rewrite what has already happened.
This process can be combined with volume or other analytical tools. Each additional observation needs a clear role. If it neither changes the decision conditions nor is tested separately, adding more marks to the chart does not by itself make the scenario more accurate.
Selecting context and an area of interest
Start with an instrument, a quote source and a working timeframe. Record which turning points count as significant, and compare movements on a consistent scale. Otherwise a small pullback can appear to be either a reversal or a continuation merely because the display scale or point-selection rule has changed.
Choose the question: continuation after a pullback, reaction at a range boundary, or holding outside the range after a breakout. The section on market structure explains trends and ranges. Here they are the starting conditions for a scenario, rather than definitions to repeat before every trade.
Mark the area of interest before the signal candle appears. Apply a consistent procedure based on previous reactions; the support and resistance section explains that process. Decide in advance how wide the area can be and what kind of move beyond it will count as significant.
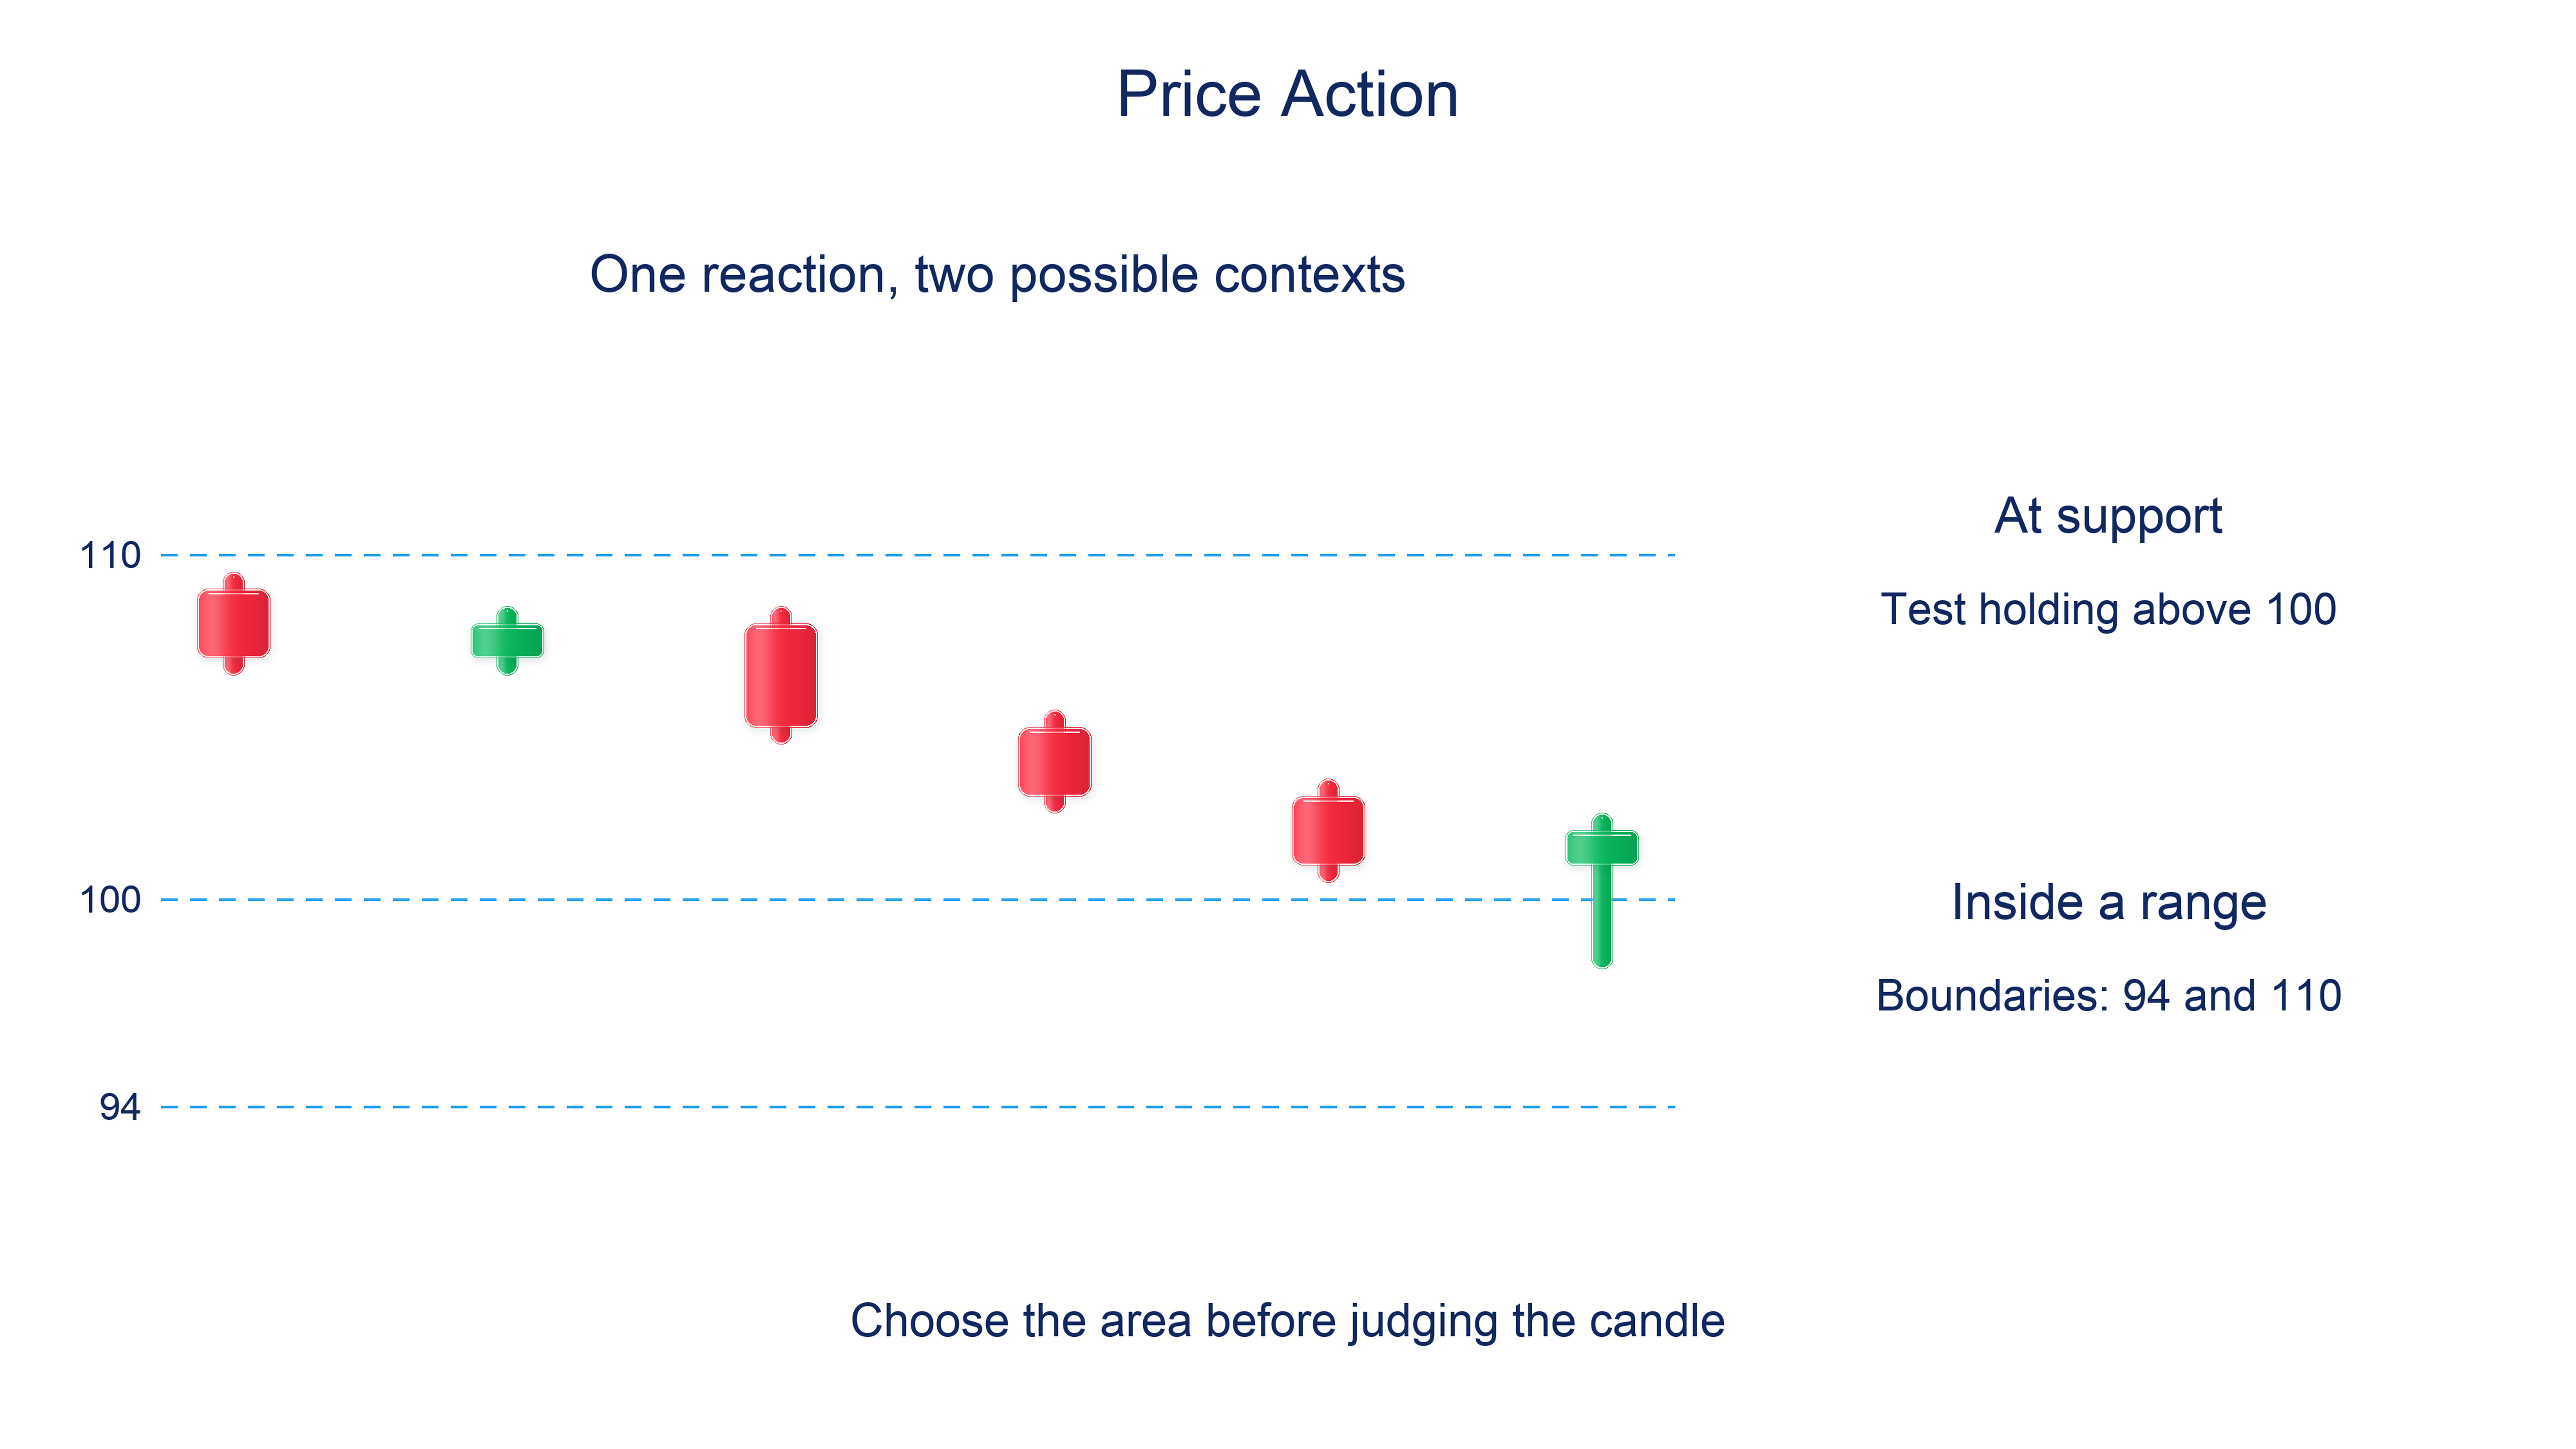
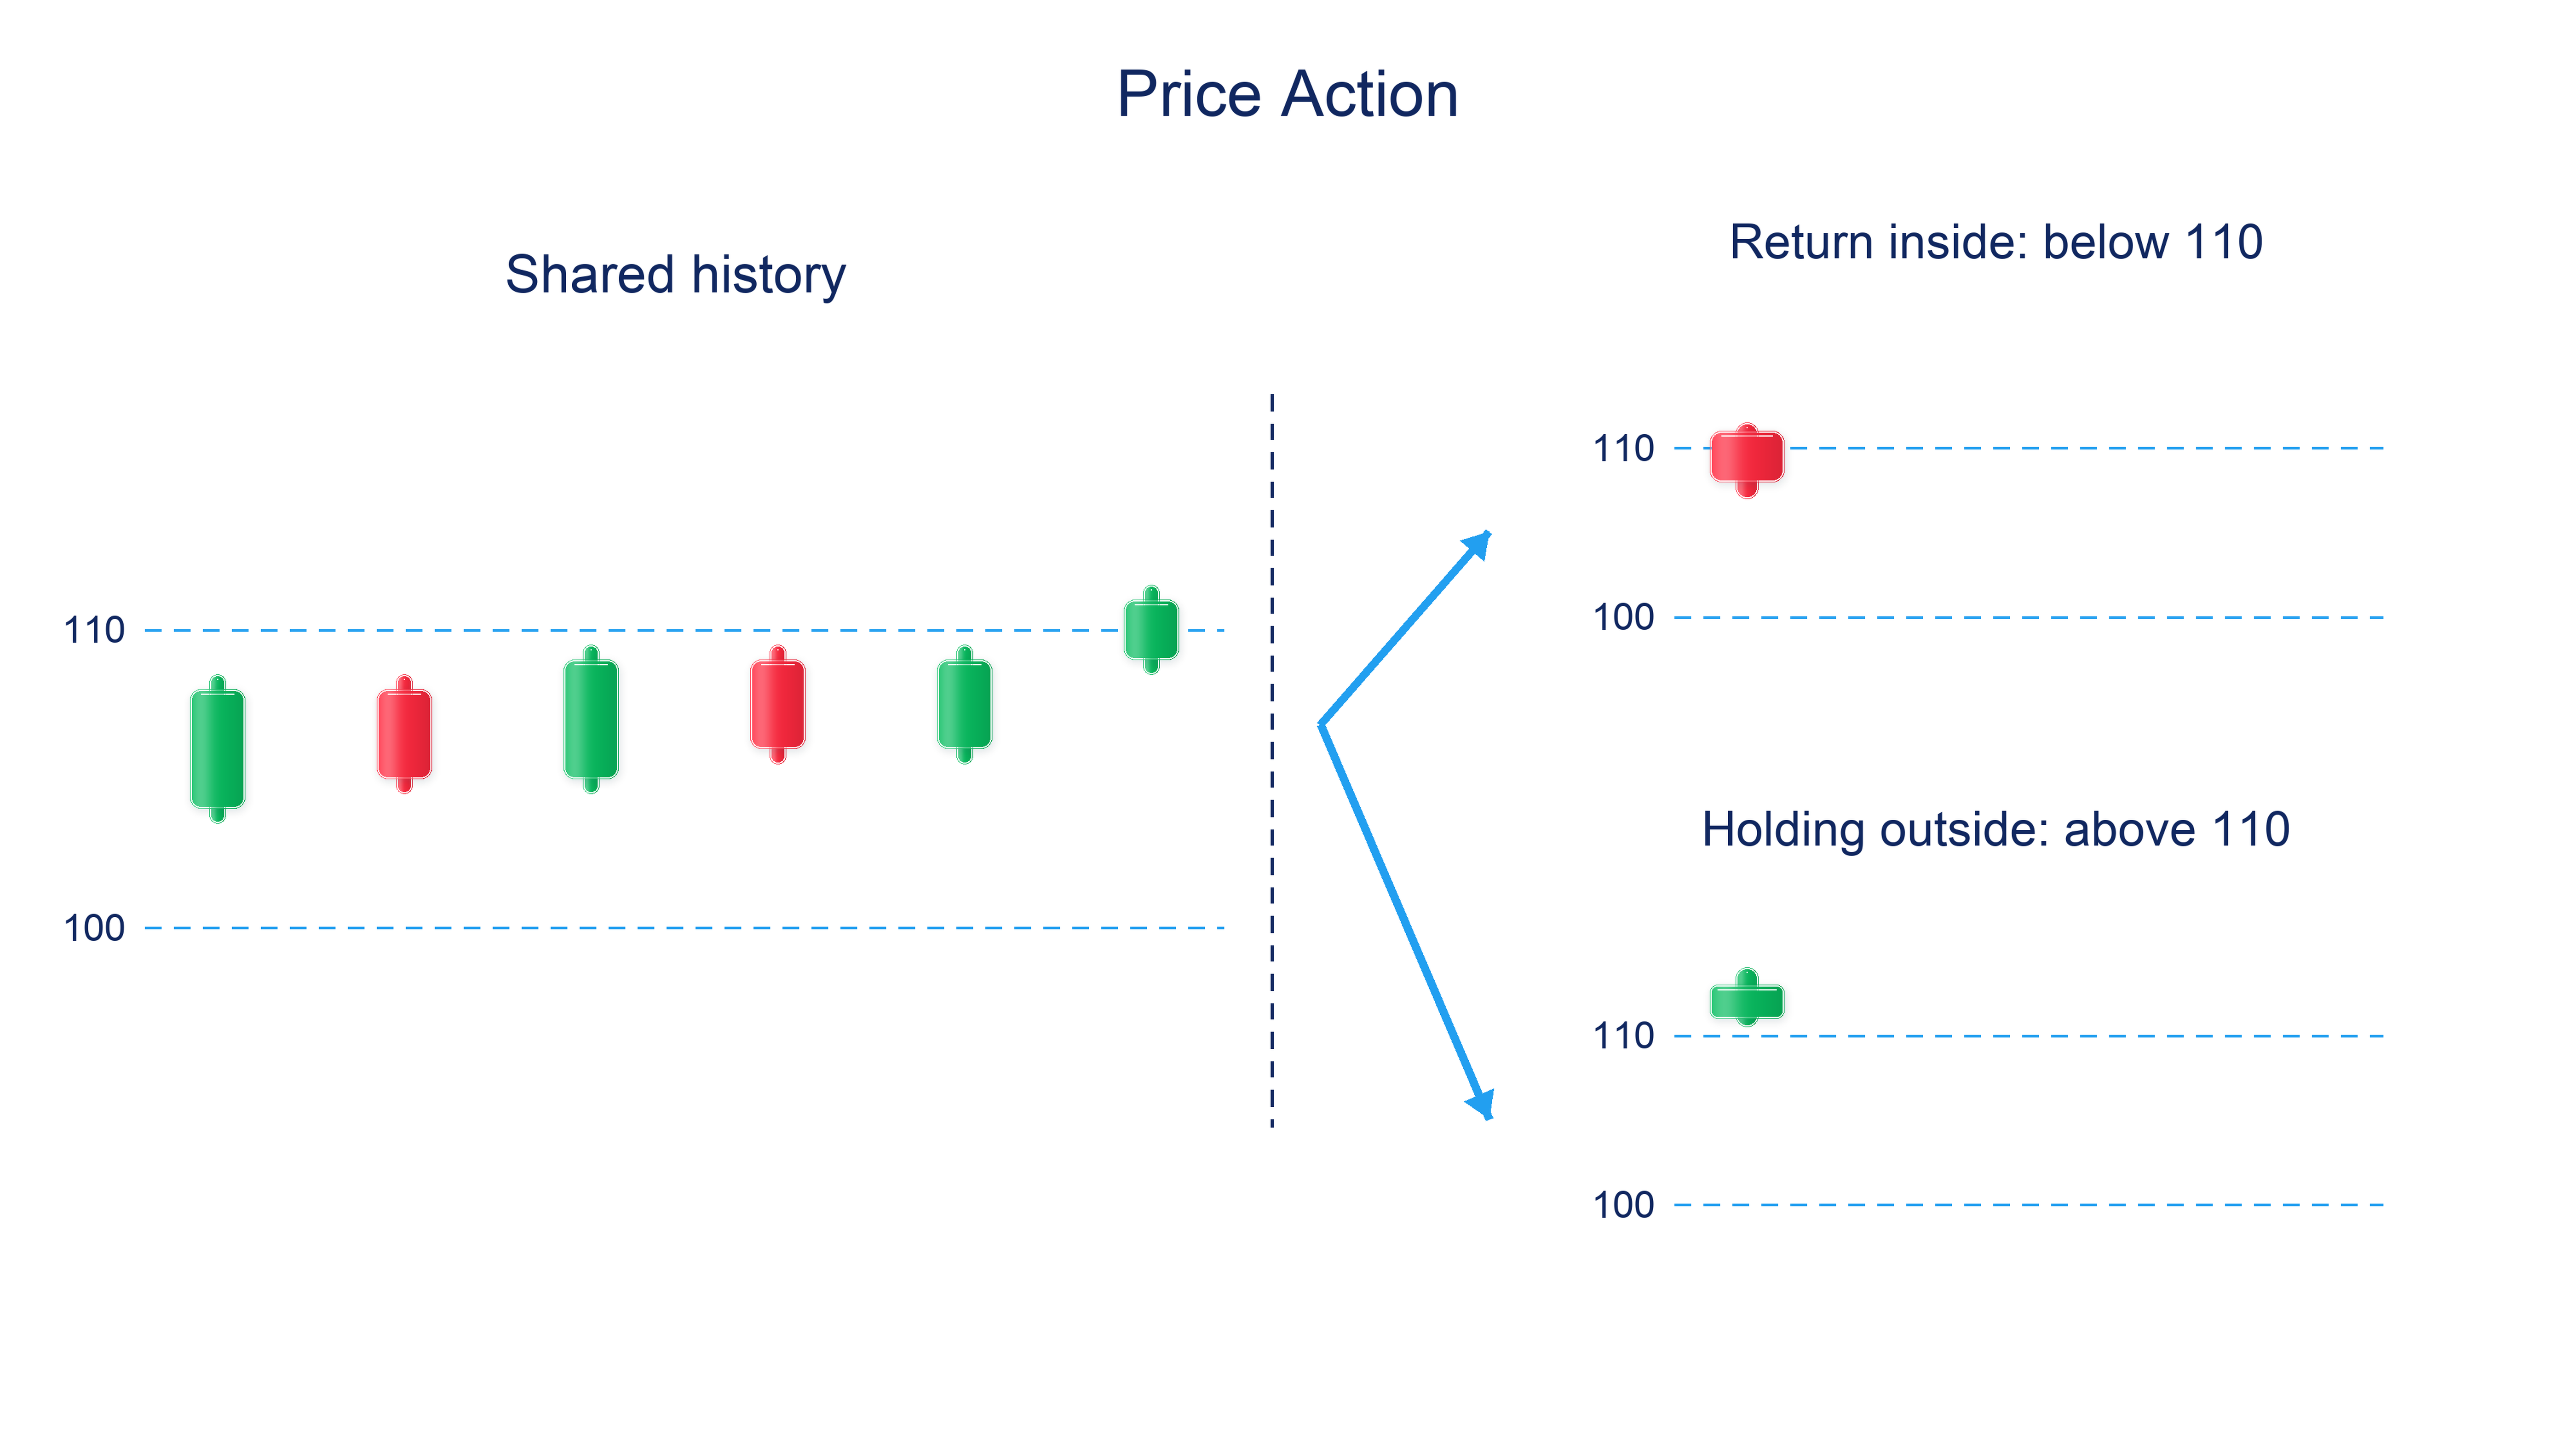
The illustration shows one candle reaction in two possible contexts: a test of support at 100, or a position inside a wider range from 94 to 110. The same candle shape answers different questions in those contexts. If the reaction has no connection with the selected scenario, waiting for an approach to the area of interest is an option. Recognising a shape does not create an obligation to enter.
A trend pullback: what needs to remain intact
After a directional move, price can retrace against the latest impulse. A continuation scenario depends on more than the presence of a pullback: the selected structure needs to remain intact and price must show a new reaction in the direction of the trend. Before the continuation, it is unknown whether the retracement will remain limited or develop into a deeper decline.
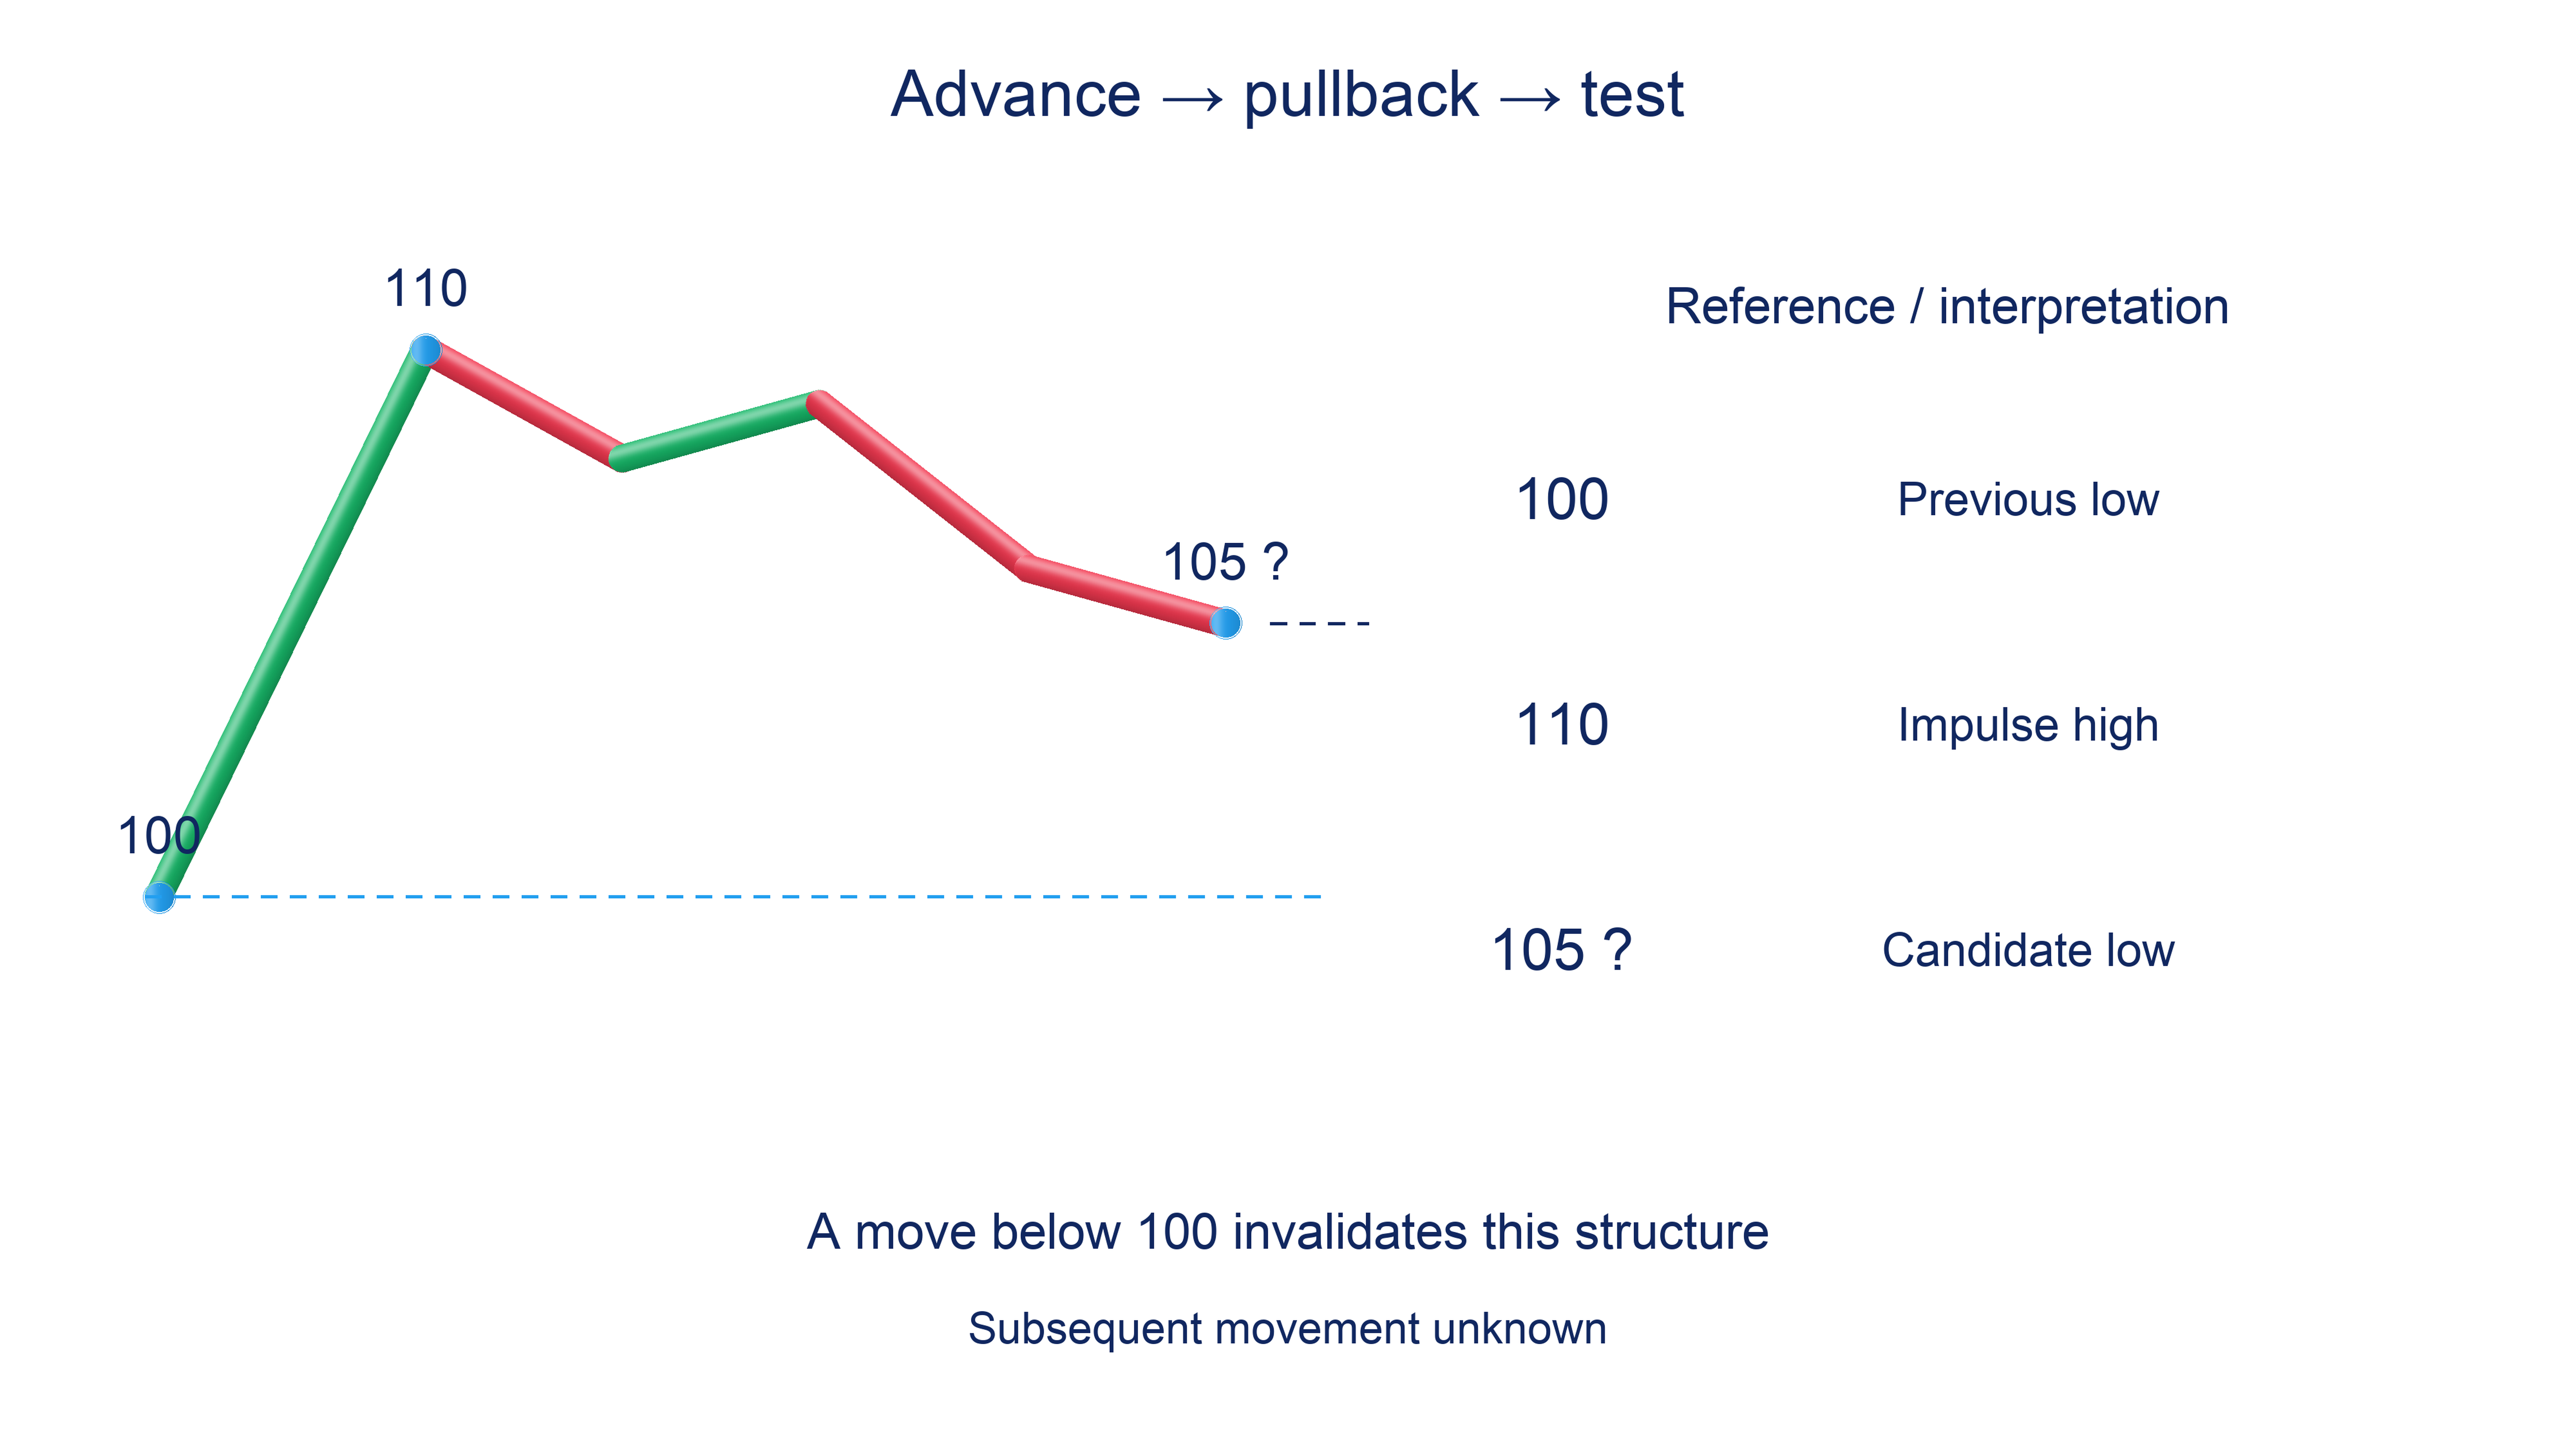
In the hypothetical upward example, the previous significant low is 100, the impulse reaches 110 and the pullback pauses around 105. While price remains above 100, it has not breached the selected structural condition. However, 105 only becomes a confirmed turning point after subsequent movement, not at the first touch.
One predefined test could require a close above the pullback’s local high. Buying before that close would be a different rule set. If price first moves below 100, the scenario based on that structure is invalidated. Moving the original low down simply to keep the idea alive would change the test.
A higher low describes the relationship between two observed points; it does not promise a new high. Consider the distance to the nearest opposing area. Confirmation may arrive so late that the potential reward relative to the risk no longer suits the entry price that can actually be obtained.
A range and a breakout require different questions
Inside a range, first decide whether the scenario concerns a return from a boundary towards the interior or continuation after an outward break. These are different hypotheses. The same candle near resistance cannot automatically justify both buying a breakout and selling a return inside.
Near a boundary, an observation can be related to a specific invalidation area more directly. In the middle, price can move towards either side, and the distances to both boundaries become part of the assessment. Prioritising boundaries means choosing a clearer question, not assuming that every trade near a level has an advantage.
After an outward move, a close meeting the chosen rule can confirm the first stage without guaranteeing that price will hold outside. A return inside changes the assessment. The breakout assessment section explains continuation and false breaks; the important point here is to apply one rule before knowing the result.
If entry requires a return to the broken area, record that retest requirement beforehand. A retest may never occur. Specific reactions are covered in the retest section. If the required return never occurs, skipping the trade is a valid outcome; there is no need to chase a price that has already moved away.
The job of a candlestick pattern
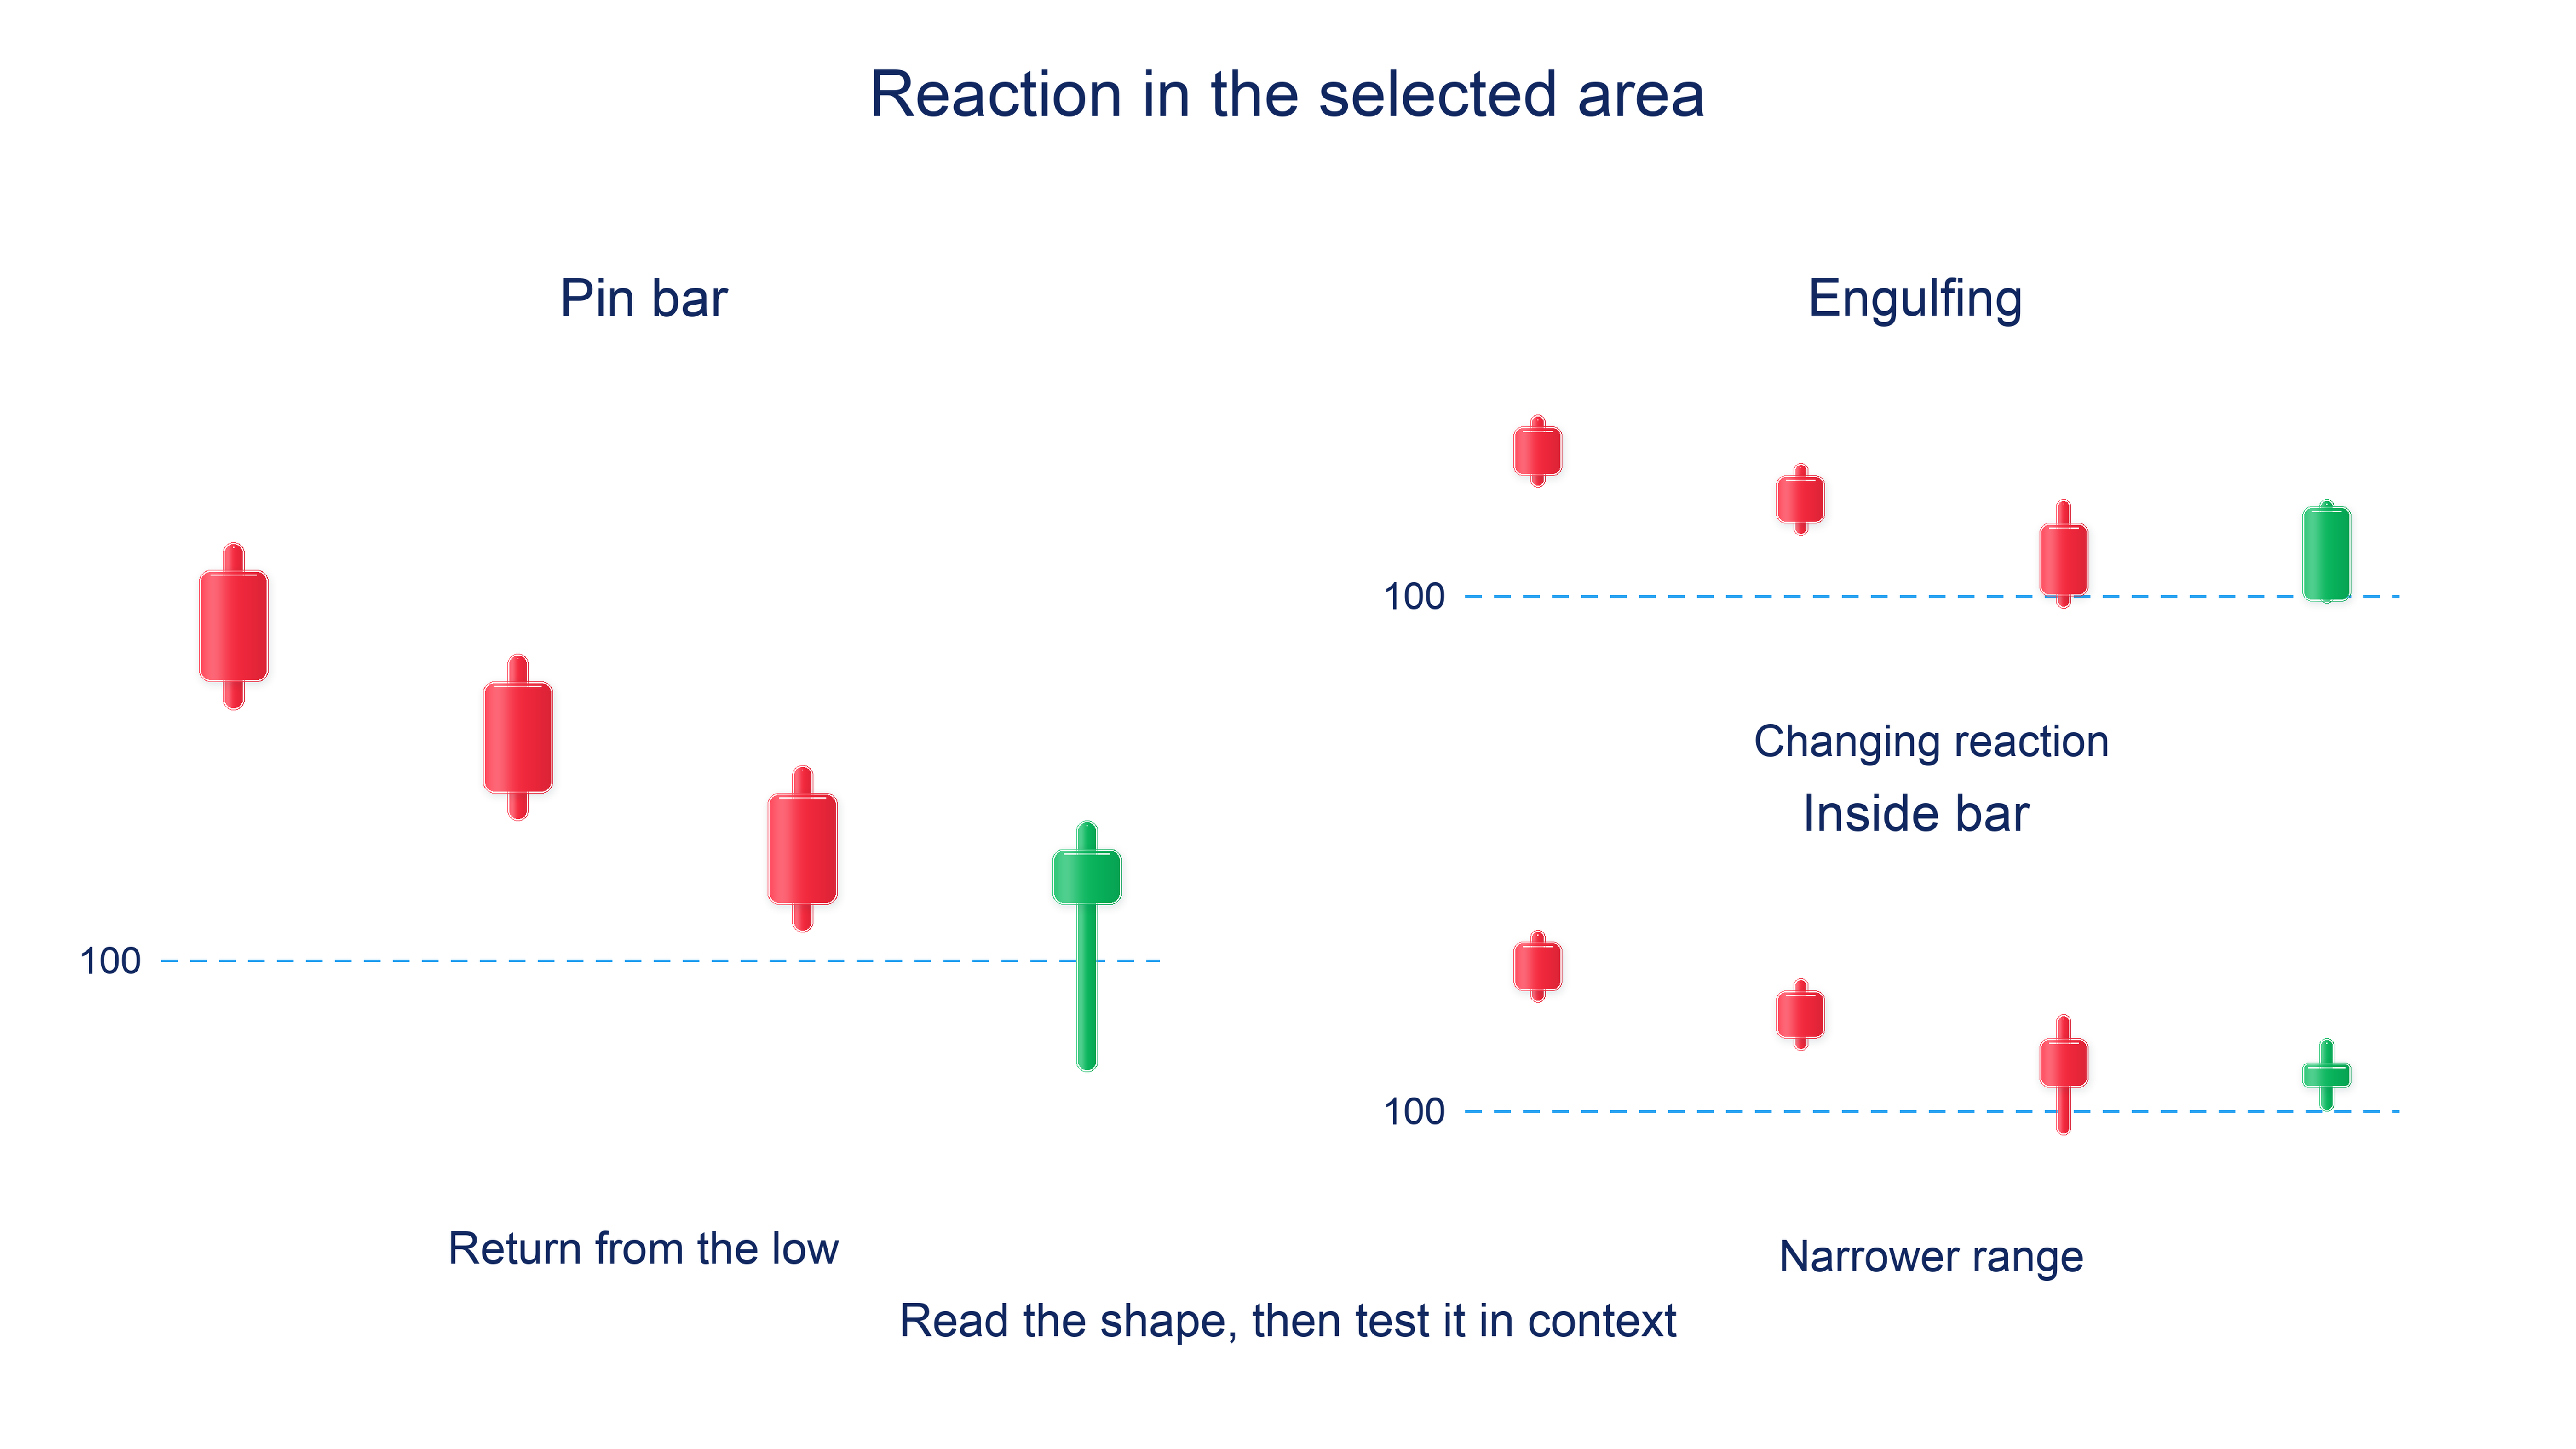
A candlestick reaction helps describe what happened in the selected area. A pin bar can record a return from an extreme, an engulfing pattern a change in the relationship between neighbouring bodies, and an inside bar a narrower range. None of these observations alone identifies the direction of the next candle.
At support, a pin bar can be part of a holding test, but the same silhouette in the middle of a range does not confirm that particular hypothesis. Its shape and context are defined in the pin bar, hammer and hanging man section. Here the test concerns its connection with location and the subsequent condition.
An engulfing pattern after a pullback can indicate a change in the price response if it fits the scenario’s predefined direction. Body comparisons are explained in the engulfing and harami section. Inside and outside bars compare something different; their distinction belongs to the section on neighbouring candle ranges.
A decision based on a completed pattern becomes possible after its last candle closes. Until then, its body and extremes can change. Do not add confirmation retrospectively: if the rule requires the next close, that value is unknown when the first reaction appears and must not be presented as a fact already available.
The same past, two possible continuations
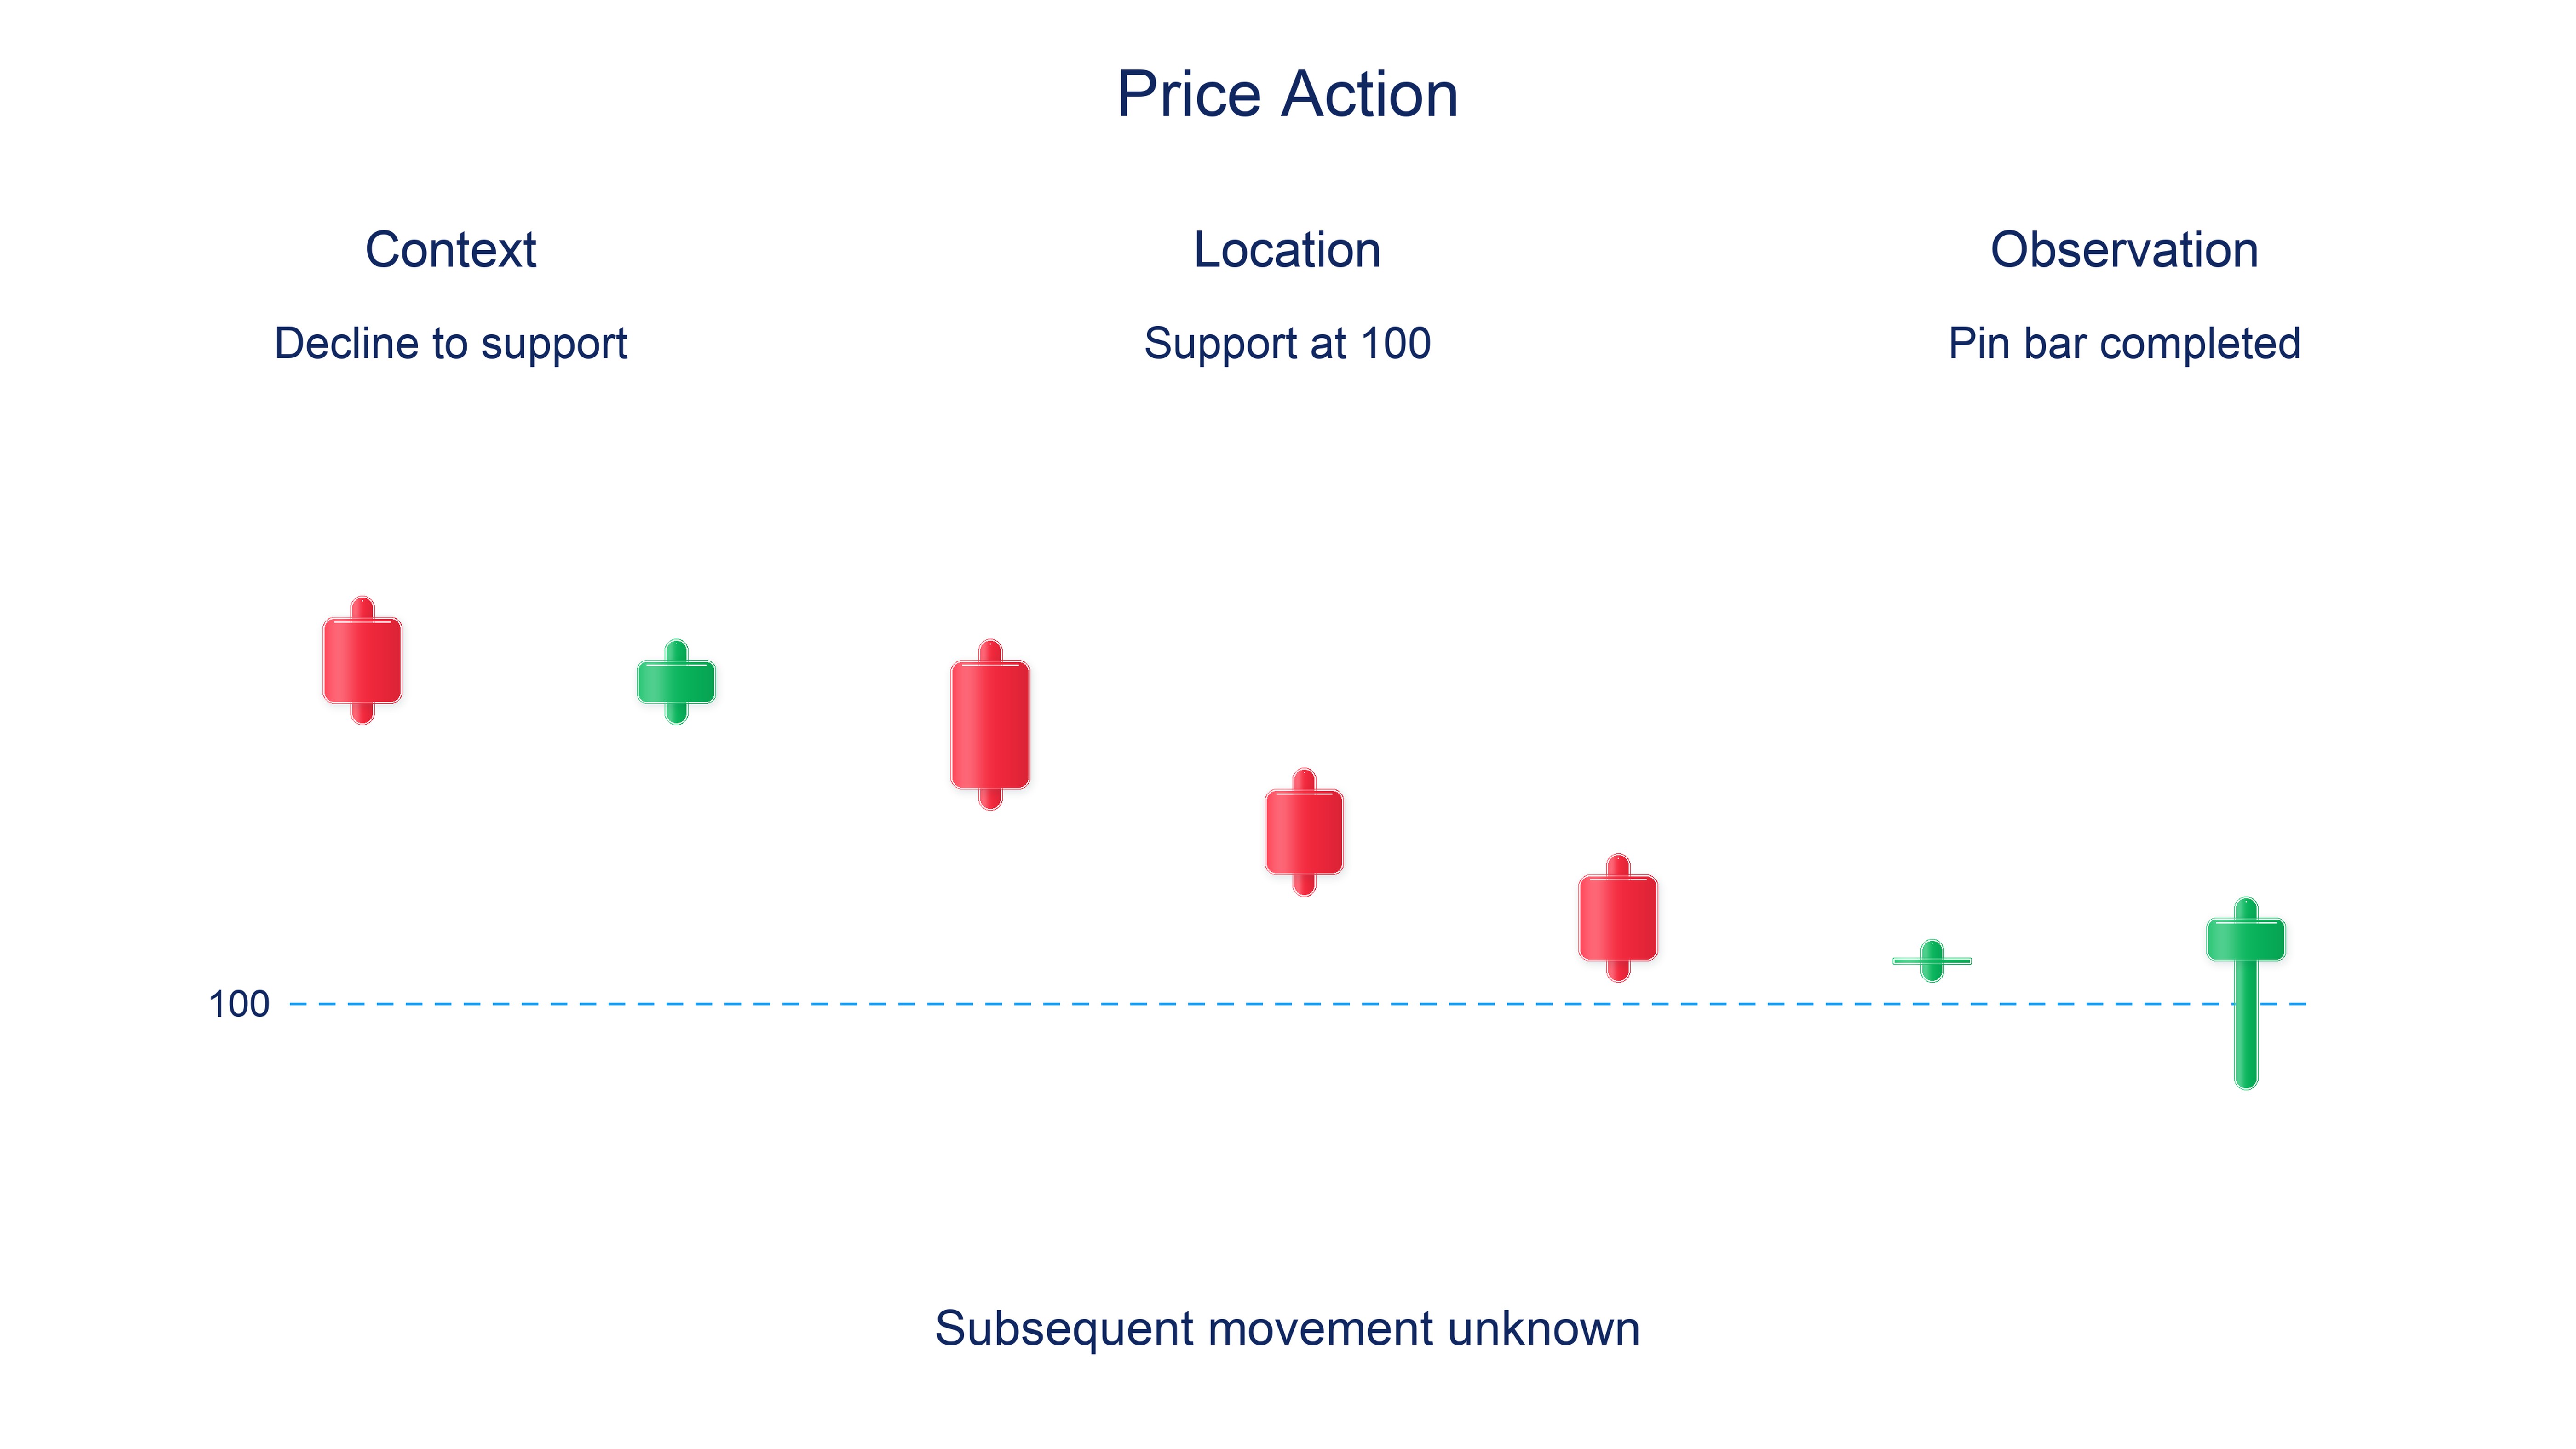
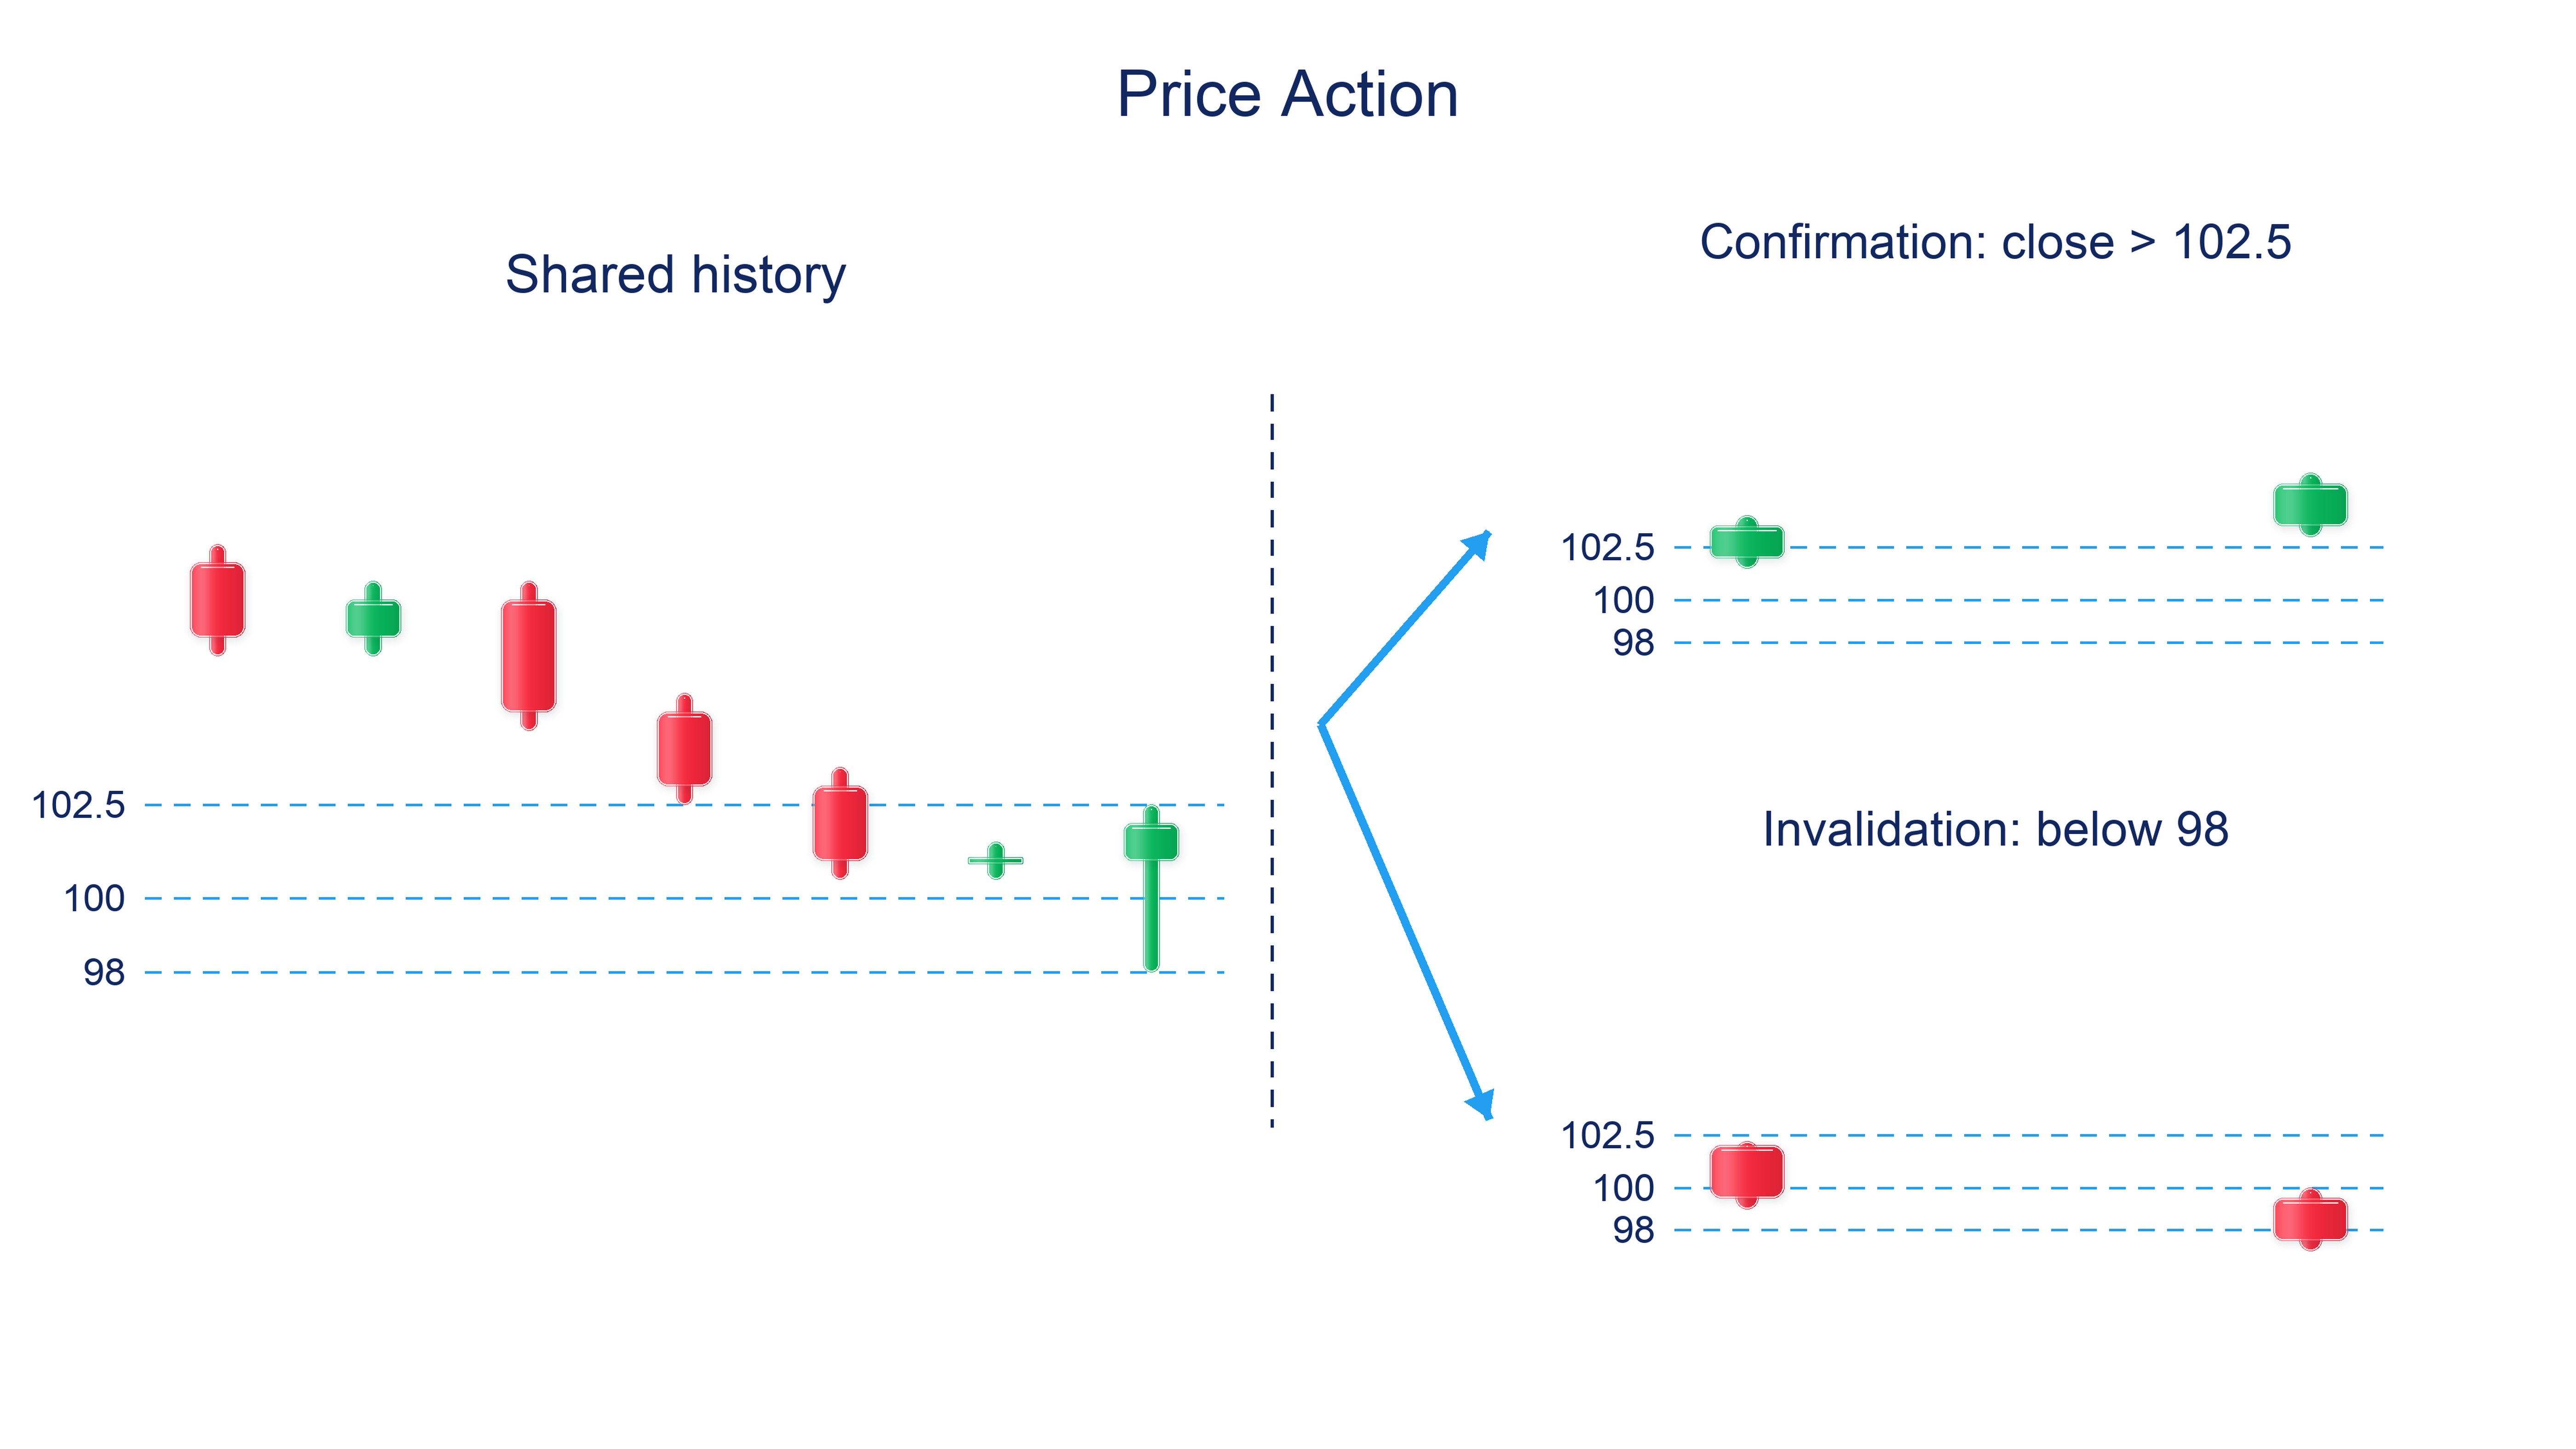
The shared history contains seven candles: a decline towards support at 100 ends with a pin bar at O = 101, H = 102.5, L = 98 and C = 102. The history before the vertical dashed line is common to both outcomes. In the confirmation scenario, the next candle closes at 103.5; in the invalidation scenario, a later candle closes at 97.5.
The predefined confirmation that support holds is a close above the high at 102.5. It appears only in the confirmation scenario. Moving below the low at 98 invalidates the initial hypothesis under the selected rule; no confirmation occurred before the invalidation. The pin bar records the same return above support in both branches, while the later reaction differs.
Suppose a separate opportunity to buy at USD 103 becomes available after confirmation, with a protective exit at USD 97.80. This is an assumed later entry, not a retrospective fill at the 103.5 confirming close. The planned entry-to-exit distance is 103 − 97.80 = USD 5.20 per share. With a USD 100 budget, 100 / 5.20 ≈ 19.23; round down to 19 whole shares.
Their planned loss before costs is 19 × 5.20 = USD 98.80. Fees, slippage and gaps can increase the loss, so an allowance is needed; a stop does not promise execution at its trigger price. The stop and position-size section explains the calculation. If no suitable entry appears after confirmation, the trade is skipped.
Combining timeframes without knowing the future
A lower timeframe reveals the components of a higher-timeframe move, but not its future close. Comparisons require the same instrument, source, session boundaries and aligned intervals. Otherwise two apparently related candles can cover different minutes, making the comparison inconsistent.
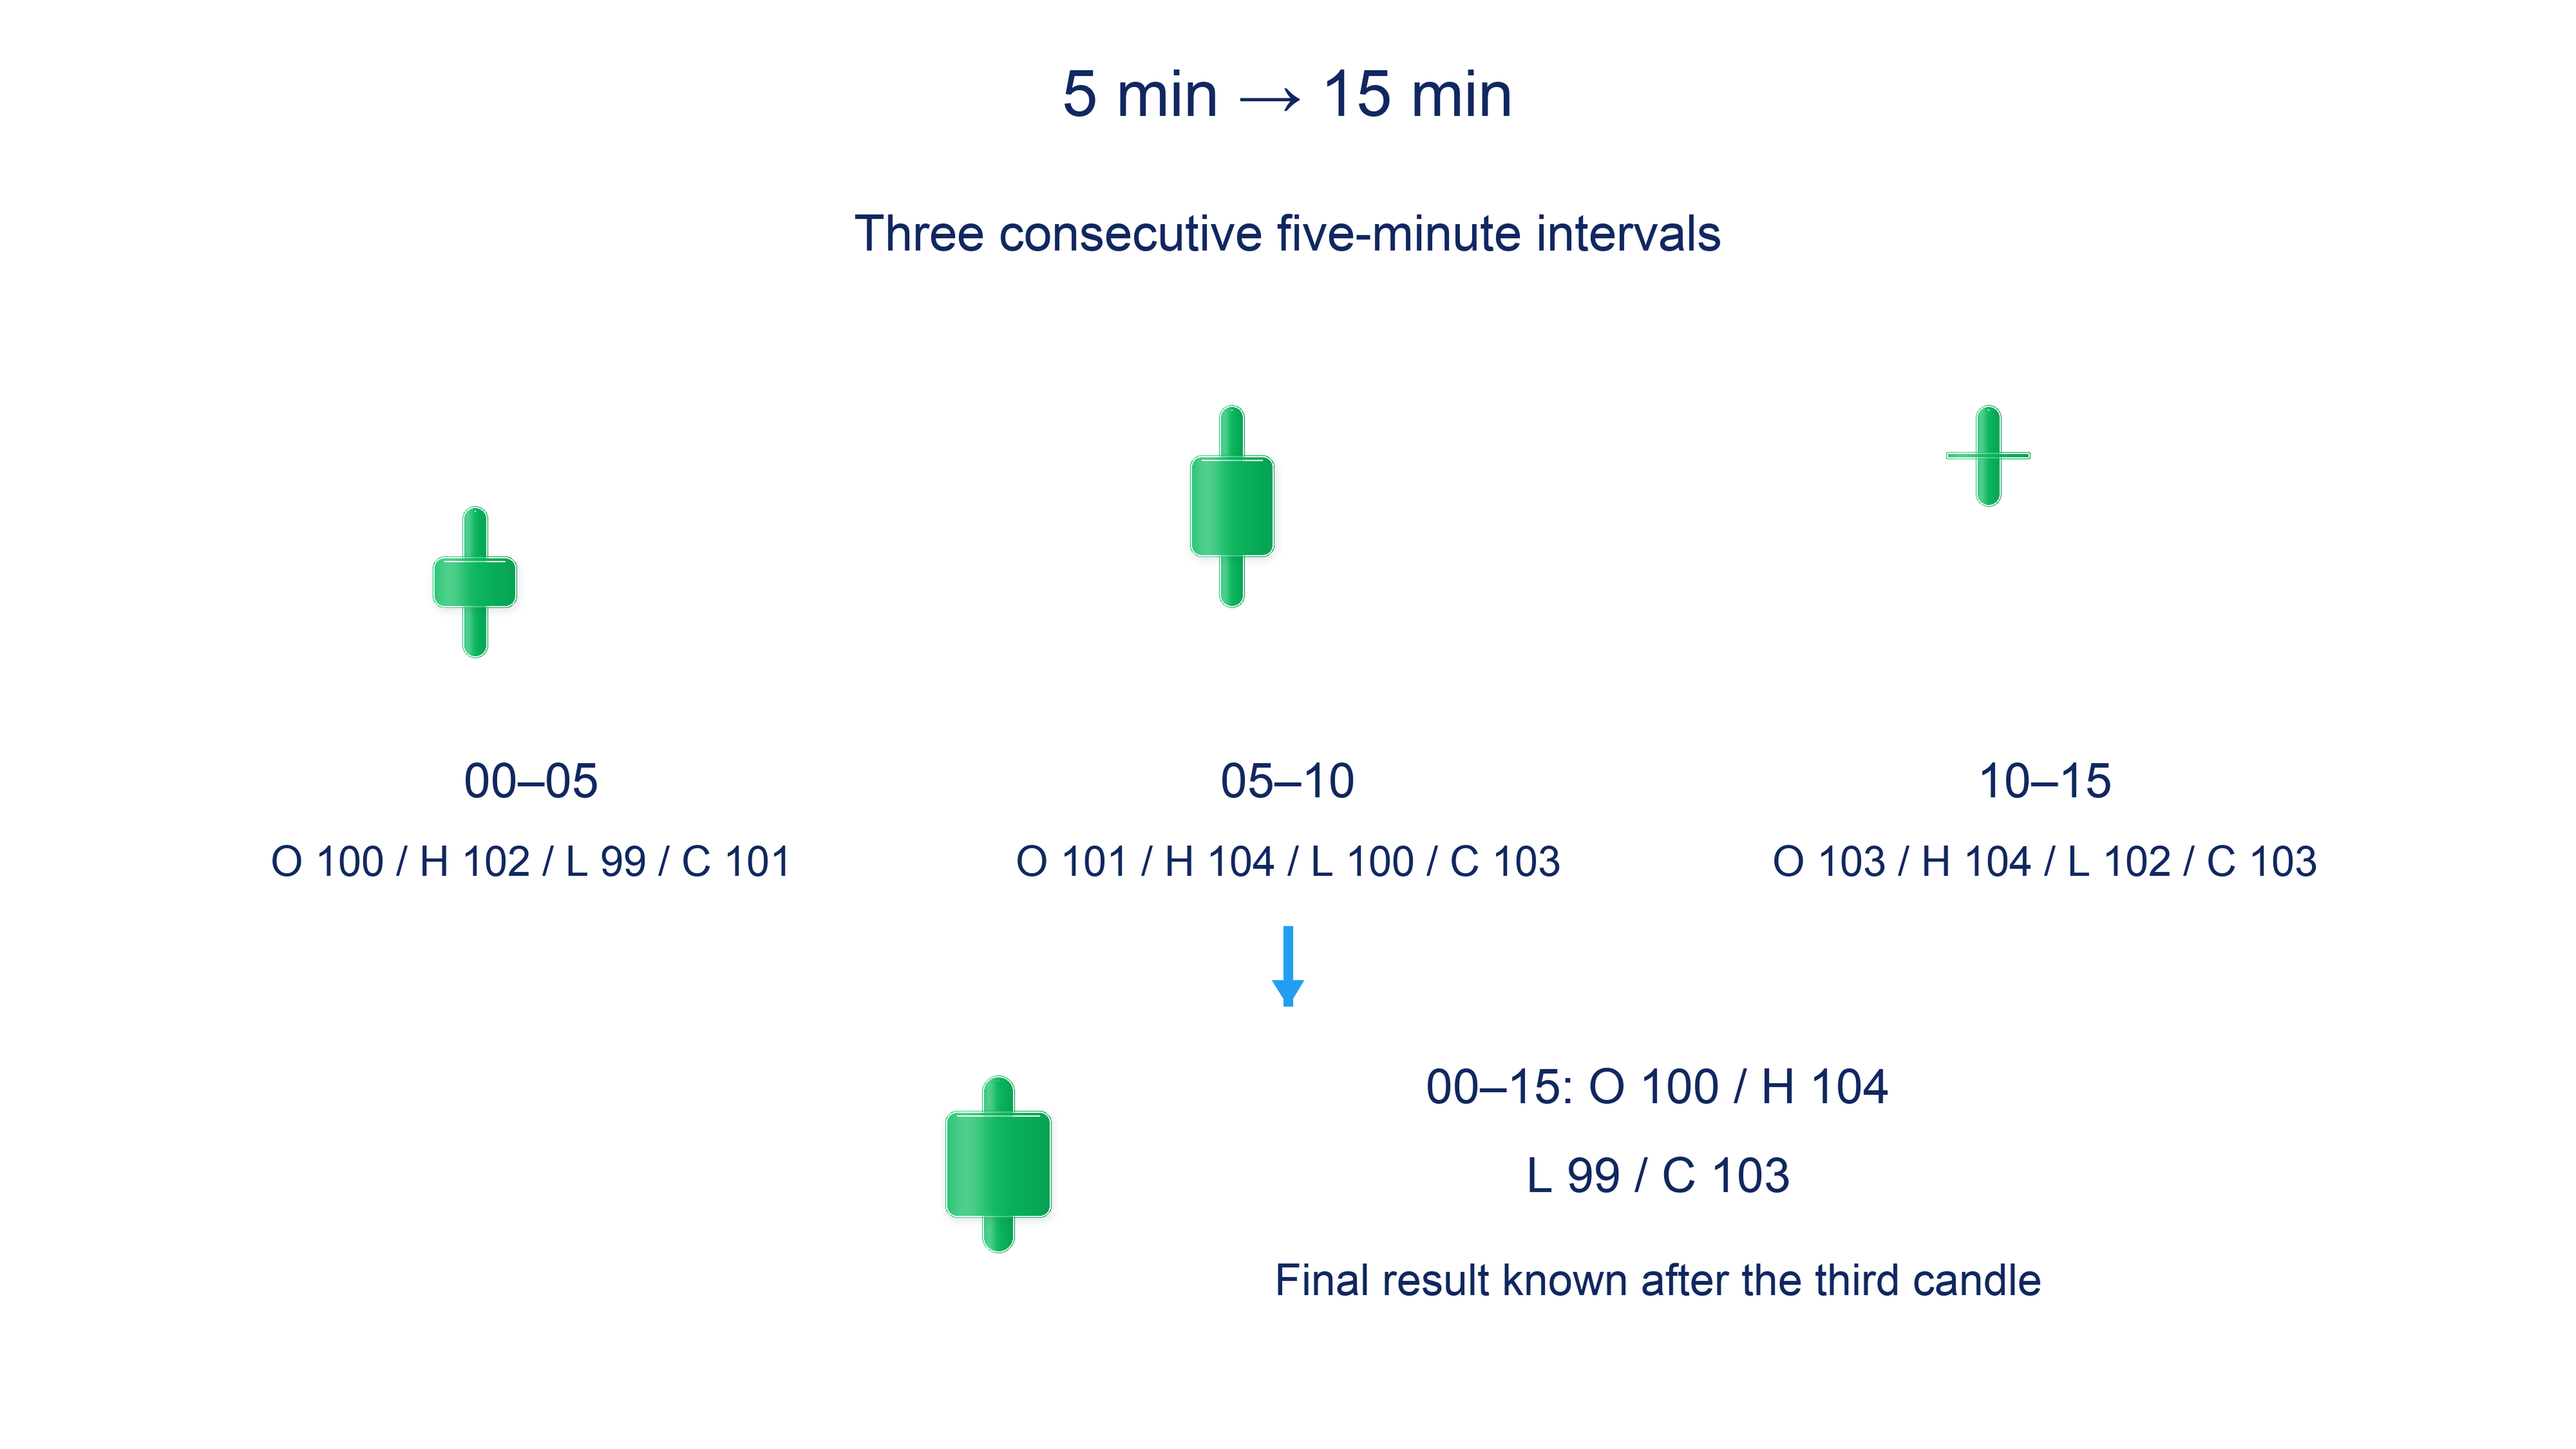
In this teaching example, three consecutive five-minute candles form one fifteen-minute candle. Their OHLC values are 100 / 102 / 99 / 101; 101 / 104 / 100 / 103; and 103 / 104 / 102 / 103. The resulting candle opens at 100, reaches a high of 104 and low of 99, and closes at 103.
After the first five-minute candle, only part of the higher-timeframe candle is known: its current close of 101 is not final. After the second, 103 is available, but the third interval still lies ahead. Using the final fifteen-minute result to make decisions at those earlier moments would introduce future information.
When a higher timeframe provides context, specify whether the rule uses its last completed candle or changing current data. These are different conditions. The lower timeframe can reveal the sequence of reactions, but it must not become a way to choose a convenient confirmation that did not yet exist at the decision time.
Testing a complete scenario in the journal
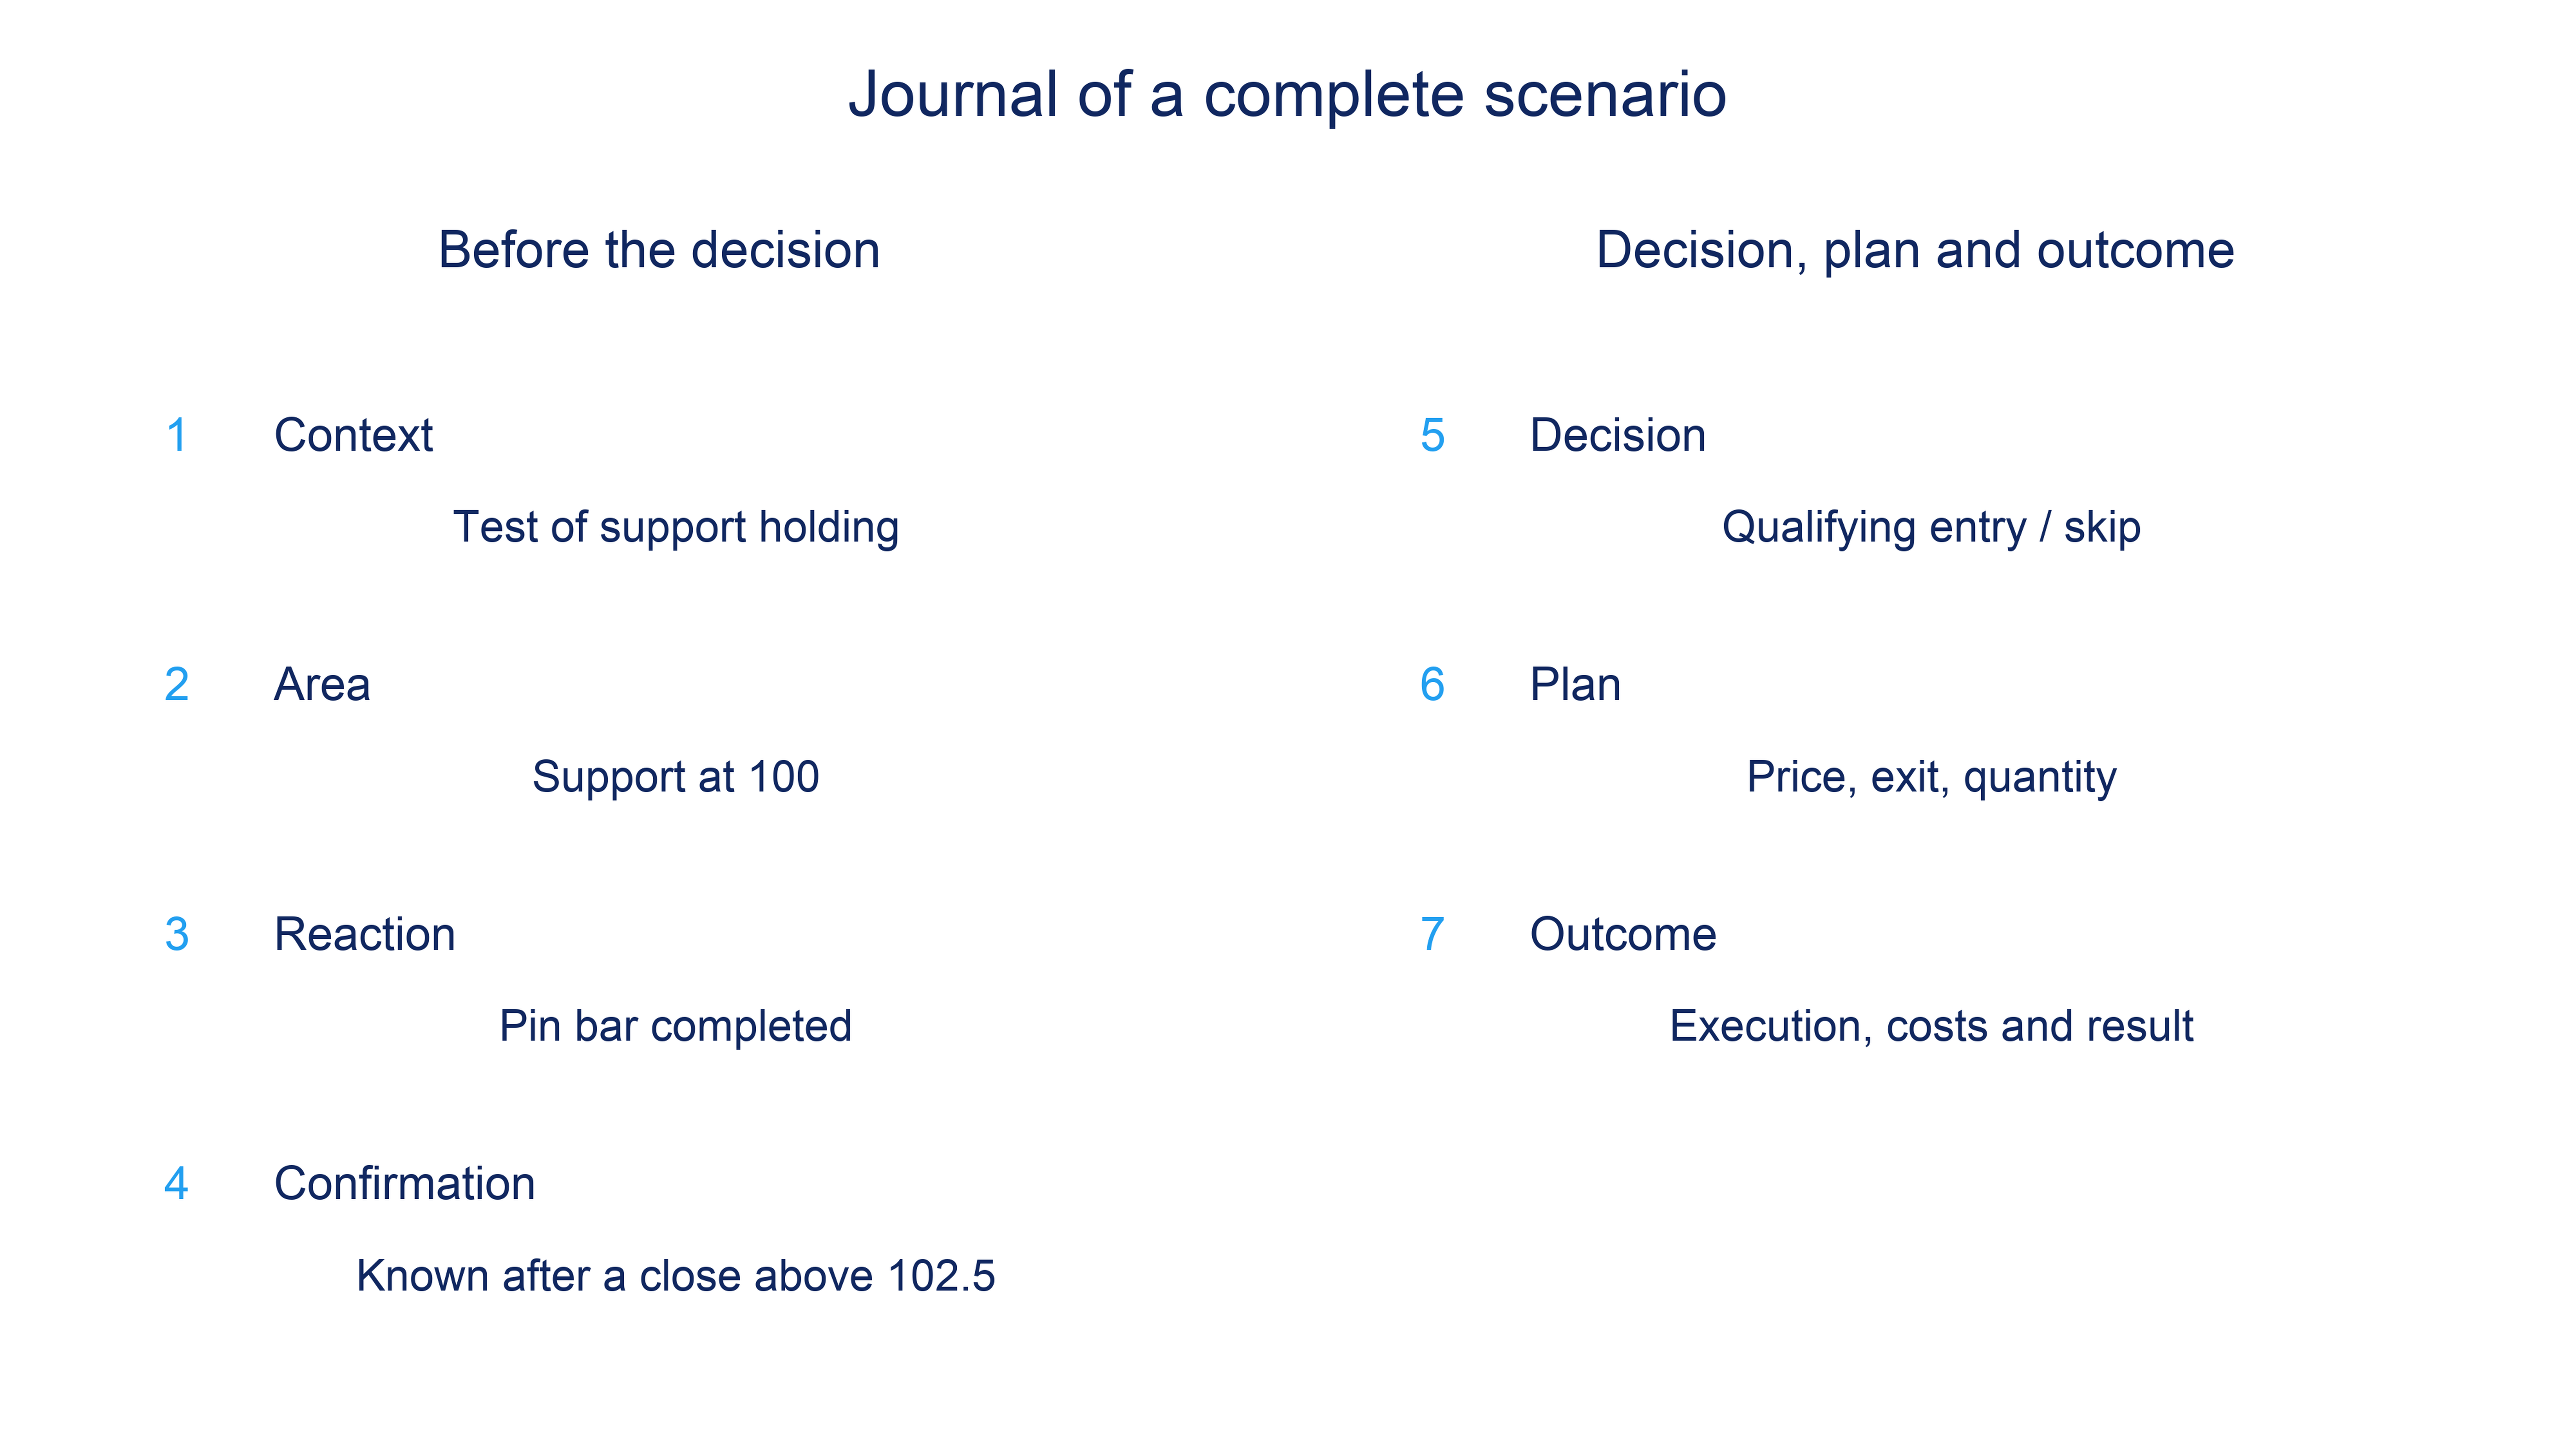
Test one connected set of conditions: context, area, reaction, confirmation, allowable entry and exit if the hypothesis fails. Statistics for candle shape alone answer a different question. Changing the level, timeframe and entry condition together after a failure makes it impossible to isolate which change produced the result.
At the observation time, save a snapshot while the continuation is still hidden. Record available evidence, the decision condition and the reason for skipping a trade if no entry occurs. After price develops, add the outcome, actual execution and costs. An invalidated hypothesis and a losing trade are different records: the former may never involve a position.
The final sample needs every case meeting the original conditions, not just successful illustrations. Treat a changed rule as a new version and test it on another data segment. Record execution errors and breaches of your own conditions separately so they are not confused with the outcome of following the scenario.
A useful result of practice is a reproducible decision based on information available at that time. The library’s worked trading scenarios provide comparisons while you keep your own selection criteria. As the journal grows, assess the connection between conditions, decisions, costs and outcomes rather than the attractiveness of a pattern.
Frequently asked questions
No. This guide considers a candle reaction together with market structure, location, confirmation and invalidation. Definitions of individual patterns belong to the candlestick reference.
No. A pattern must fit the selected scenario. If the location, confirmation or available entry price fails to meet the rules, the result is a skipped trade.
No. It describes one turning point relative to another. Renewed movement and suitable entry conditions require their own checks.
Otherwise they represent different starting situations. A fair comparison requires matching prices, scale, time and trading volume, if shown, before the branch.
Yes, if the rule explicitly allows changing data. It must not be assigned a final close that only became known later.
A scenario can be invalidated before entry, with no position or trading loss. A trading loss arises from an actual position and may be realised or unrealised.