A trading strategy sets conditions for entering, exiting and limiting planned risk. These examples show how I apply those conditions to Nasdaq futures, Bitcoin and Euro FX futures: first mark a level, then check the price's response, and only then assess a possible trade. A move that looks attractive afterward does not establish that the entry met the rules.
The charts contain my annotations, not a verified record of all the orders shown. They mark a proposed entry, a protective stop-loss, an order intended to exit if the price moves against the position, and a possible profit target. The transaction histories are not published here. A separate student practice report lets us examine several figures from completed trades.
How I Look for an Entry
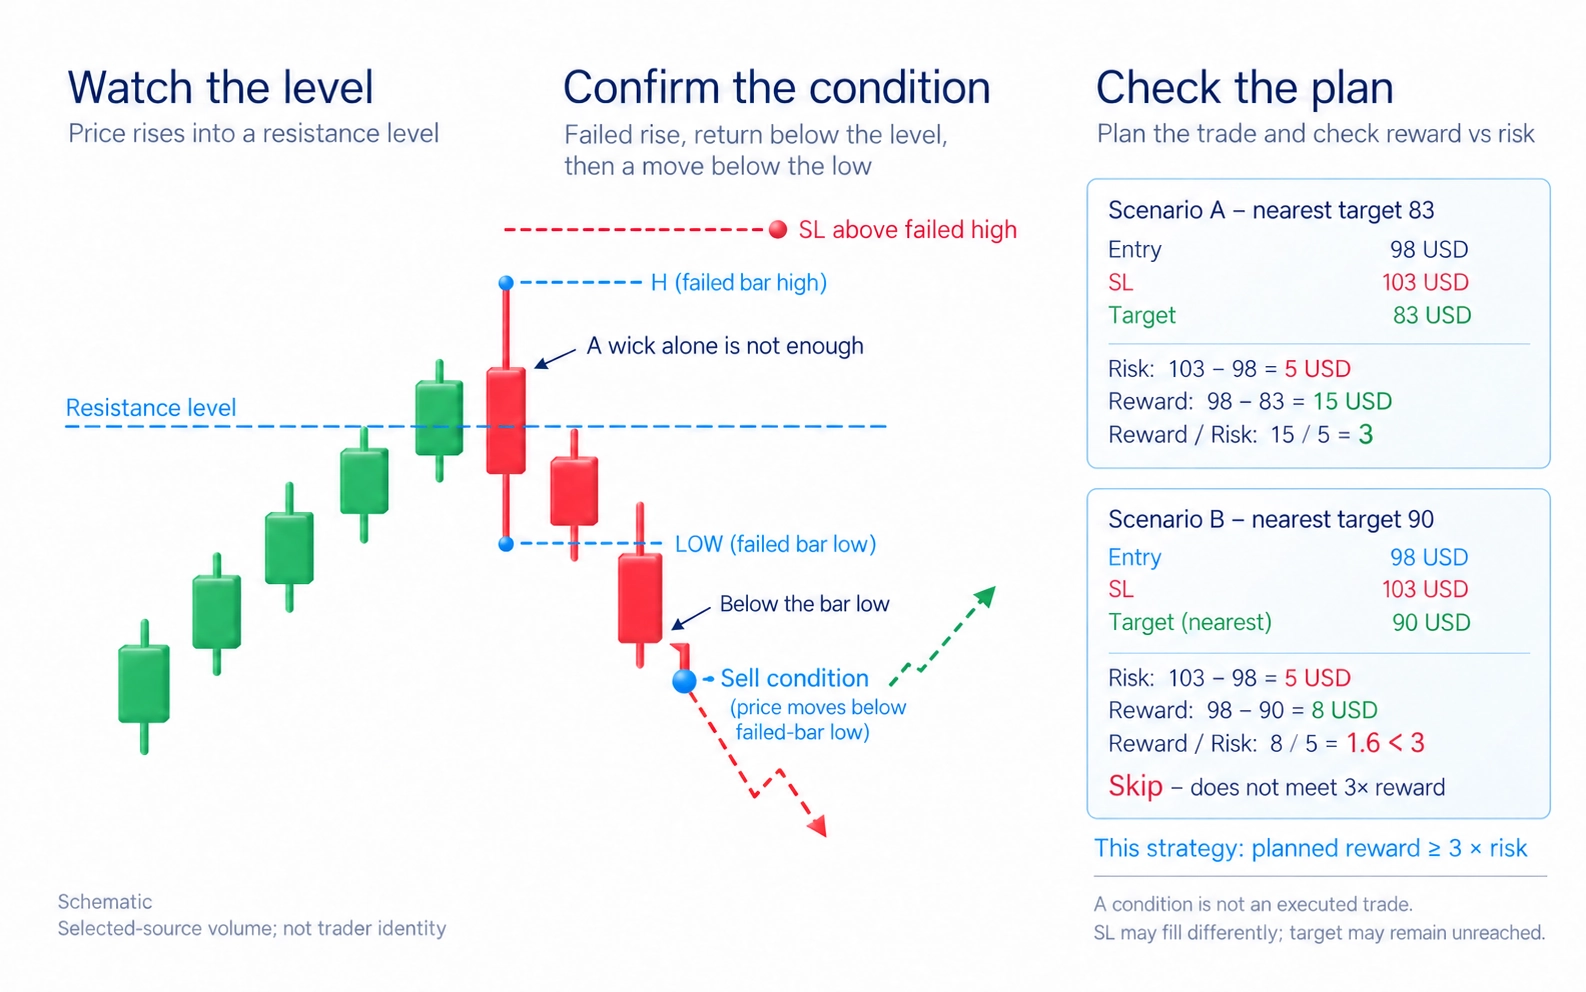
My starting point is a significant level and the price's behavior near it. For a possible sell trade, I look for growth to stall, a brief move above the boundary, and a return below it. That failed move beyond the boundary is called a false breakout. Touching the level or leaving a long upper candle wick is not enough: in these examples, I wait for price to pass below the low of the bar that went above the level without sustaining the rise. A bar shows the price range during a chosen period, as a candle does.
The larger chart interval identifies the area to watch; the smaller interval shows events within it. A timeframe is the duration represented by one bar or candle, such as four hours or fifteen minutes. I use a volume increase beside a failed attempt to rise as an additional condition. Volume measures the quantity traded in the selected data source, such as futures contracts or BTC. It does not identify who made the trades. The Smart Money guide discusses that participant model separately.
On the annotated charts, 1 marks the initial level, 2 and 3 track attempts to rise, 4 marks the entry condition, 5 the protective stop, and 6 the intended target. For a sell trade, the stop is above the high whose failure prompted the idea. The target is the next significant area below. I skip the entry if that area leaves too little room relative to the stop distance.
For these practice scenarios, I require planned reward of at least three times the risk, before costs. This is a filter in my strategy, not a guarantee of profitability. A stop may execute at a different price, a target may remain unreached, and costs reduce the result. The price-chart guide explains the chart structure used to make these observations.
Trading Strategy Examples on the Charts
1. Nasdaq Futures: A Return Below Resistance
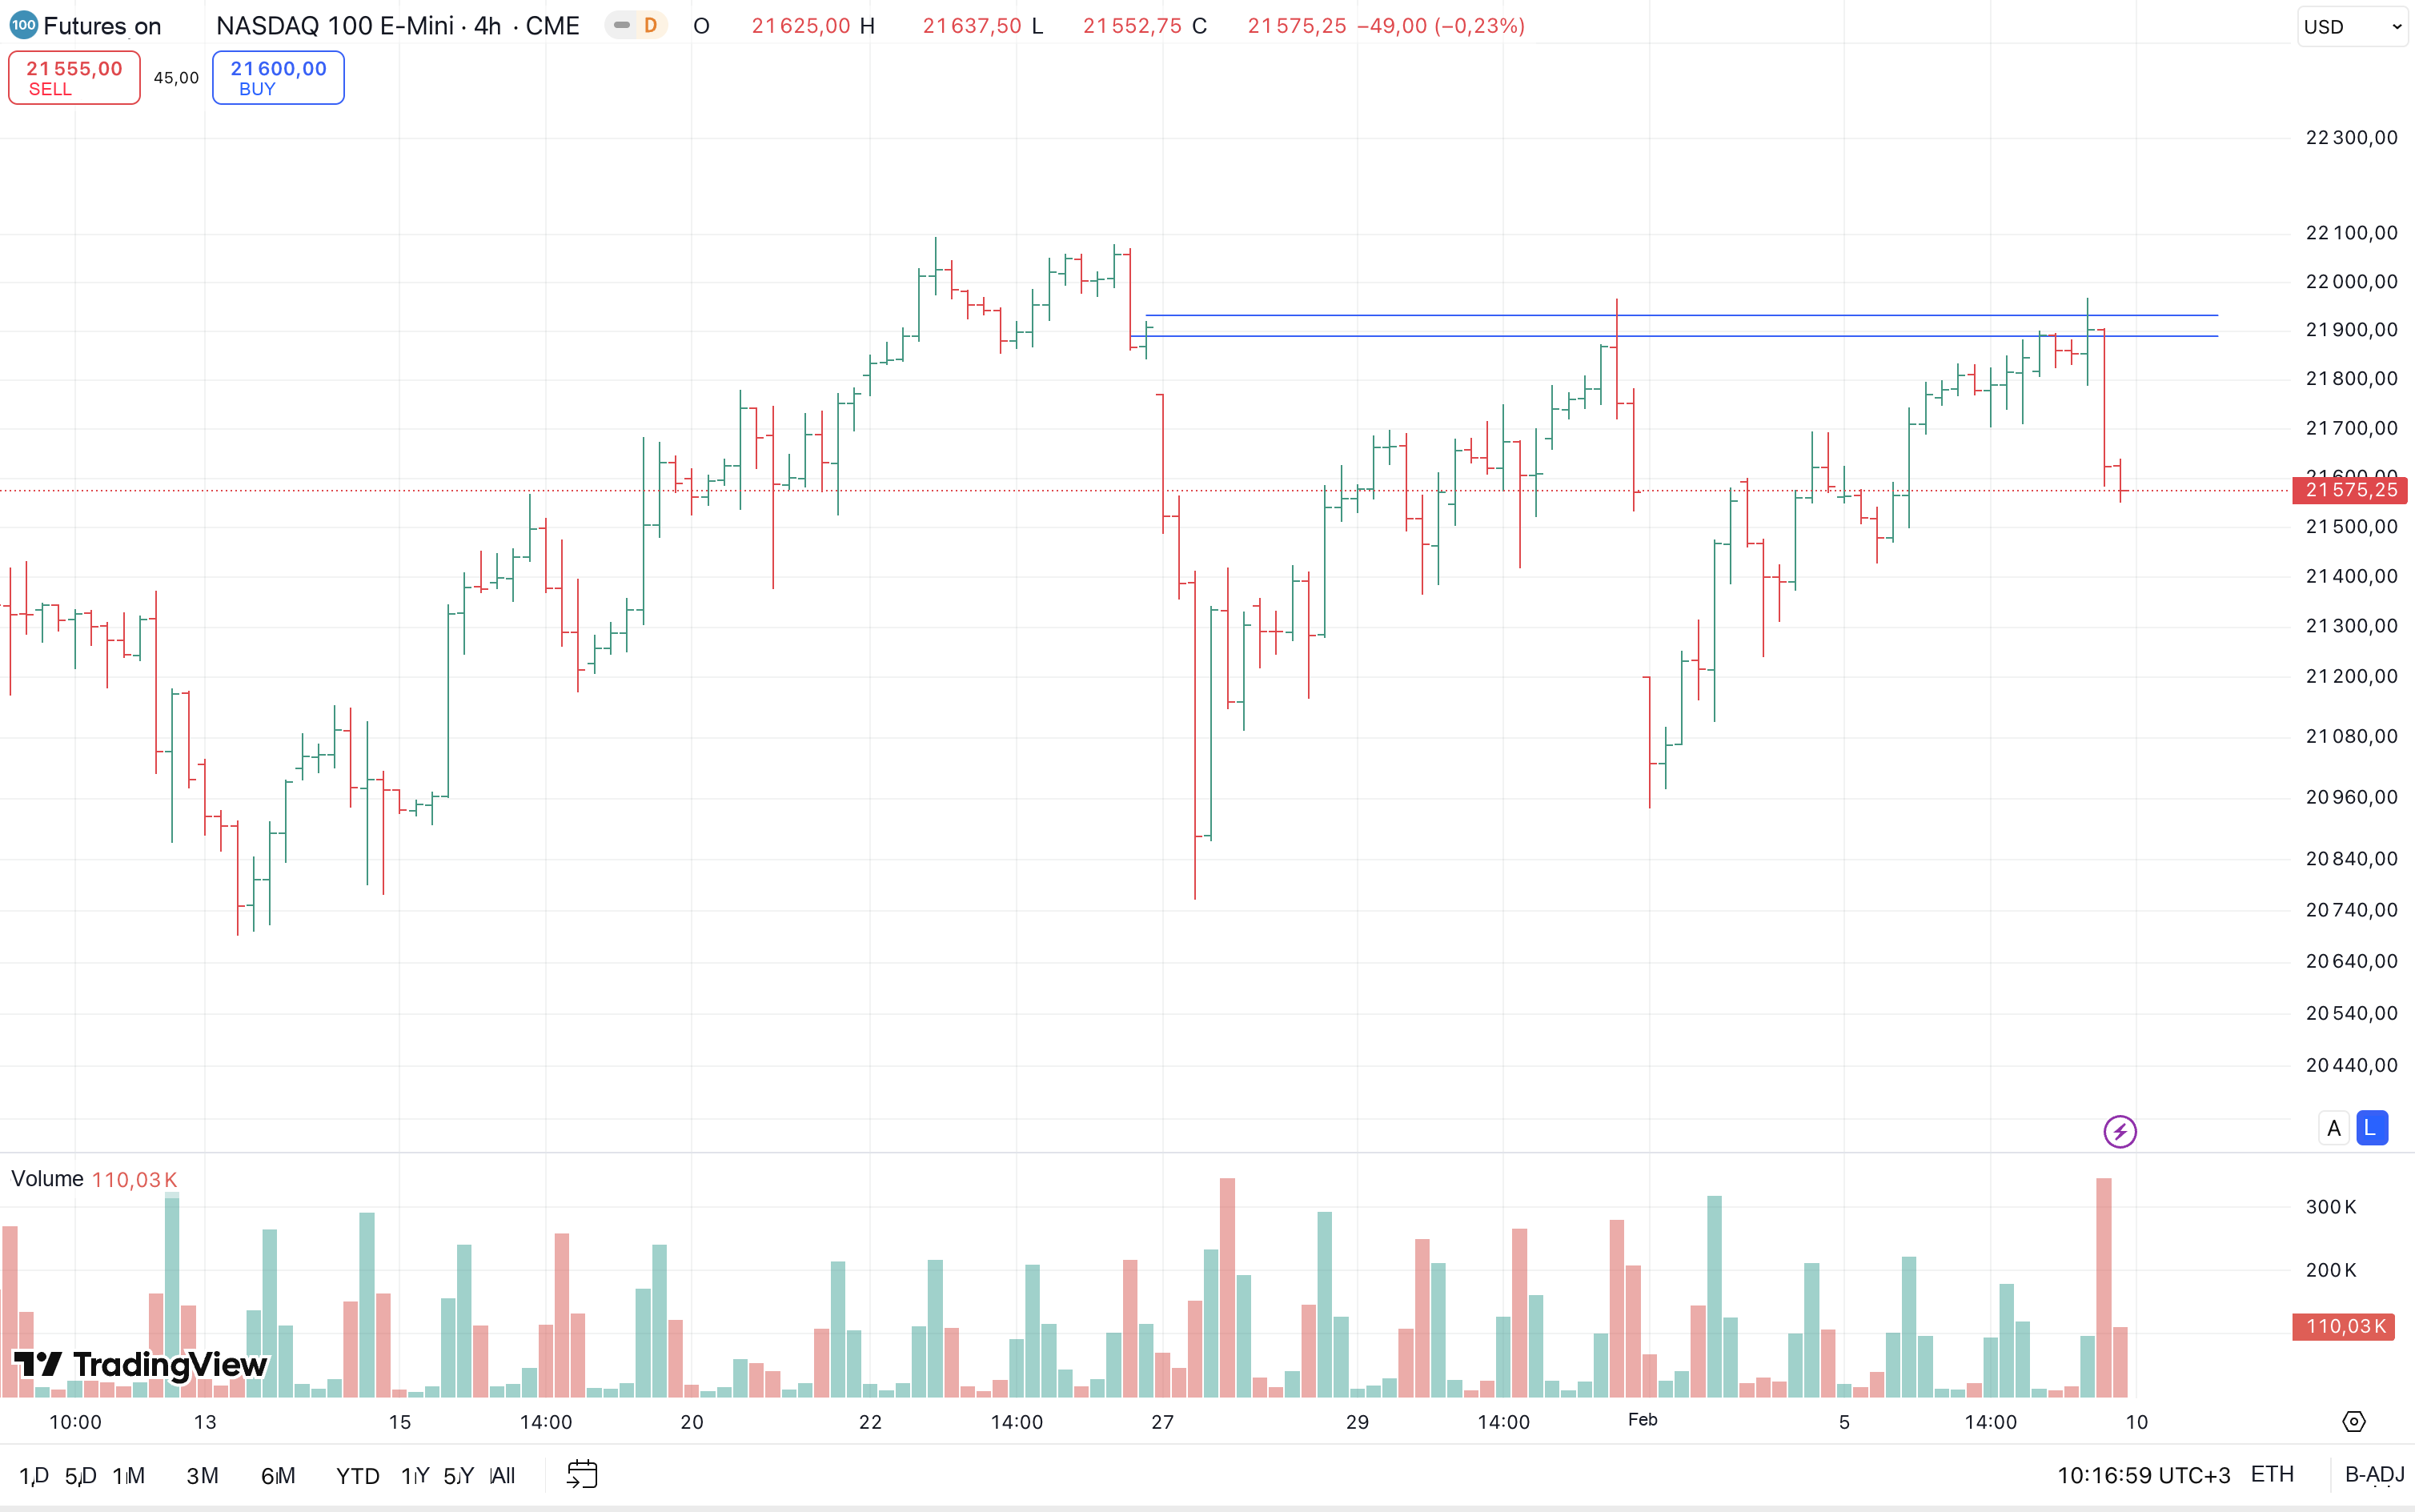
The four-hour chart shows E-mini Nasdaq-100 futures, a contract linked to the Nasdaq-100 index. The resistance area is around 21,900 index points, where earlier growth stalled. Resistance is an area that has interrupted price rises. At the next approach, I check whether price can continue higher. The marked zone is an observation area, not an instruction to sell immediately.
The fifteen-minute chart shows a move above the boundary followed by a return below it. Volume increases around point 3, but the rise does not continue. Point 4 marks the subsequent downward move used as the sell condition. Stop 5 is above the high, while target 6 lies near the lower chart area.
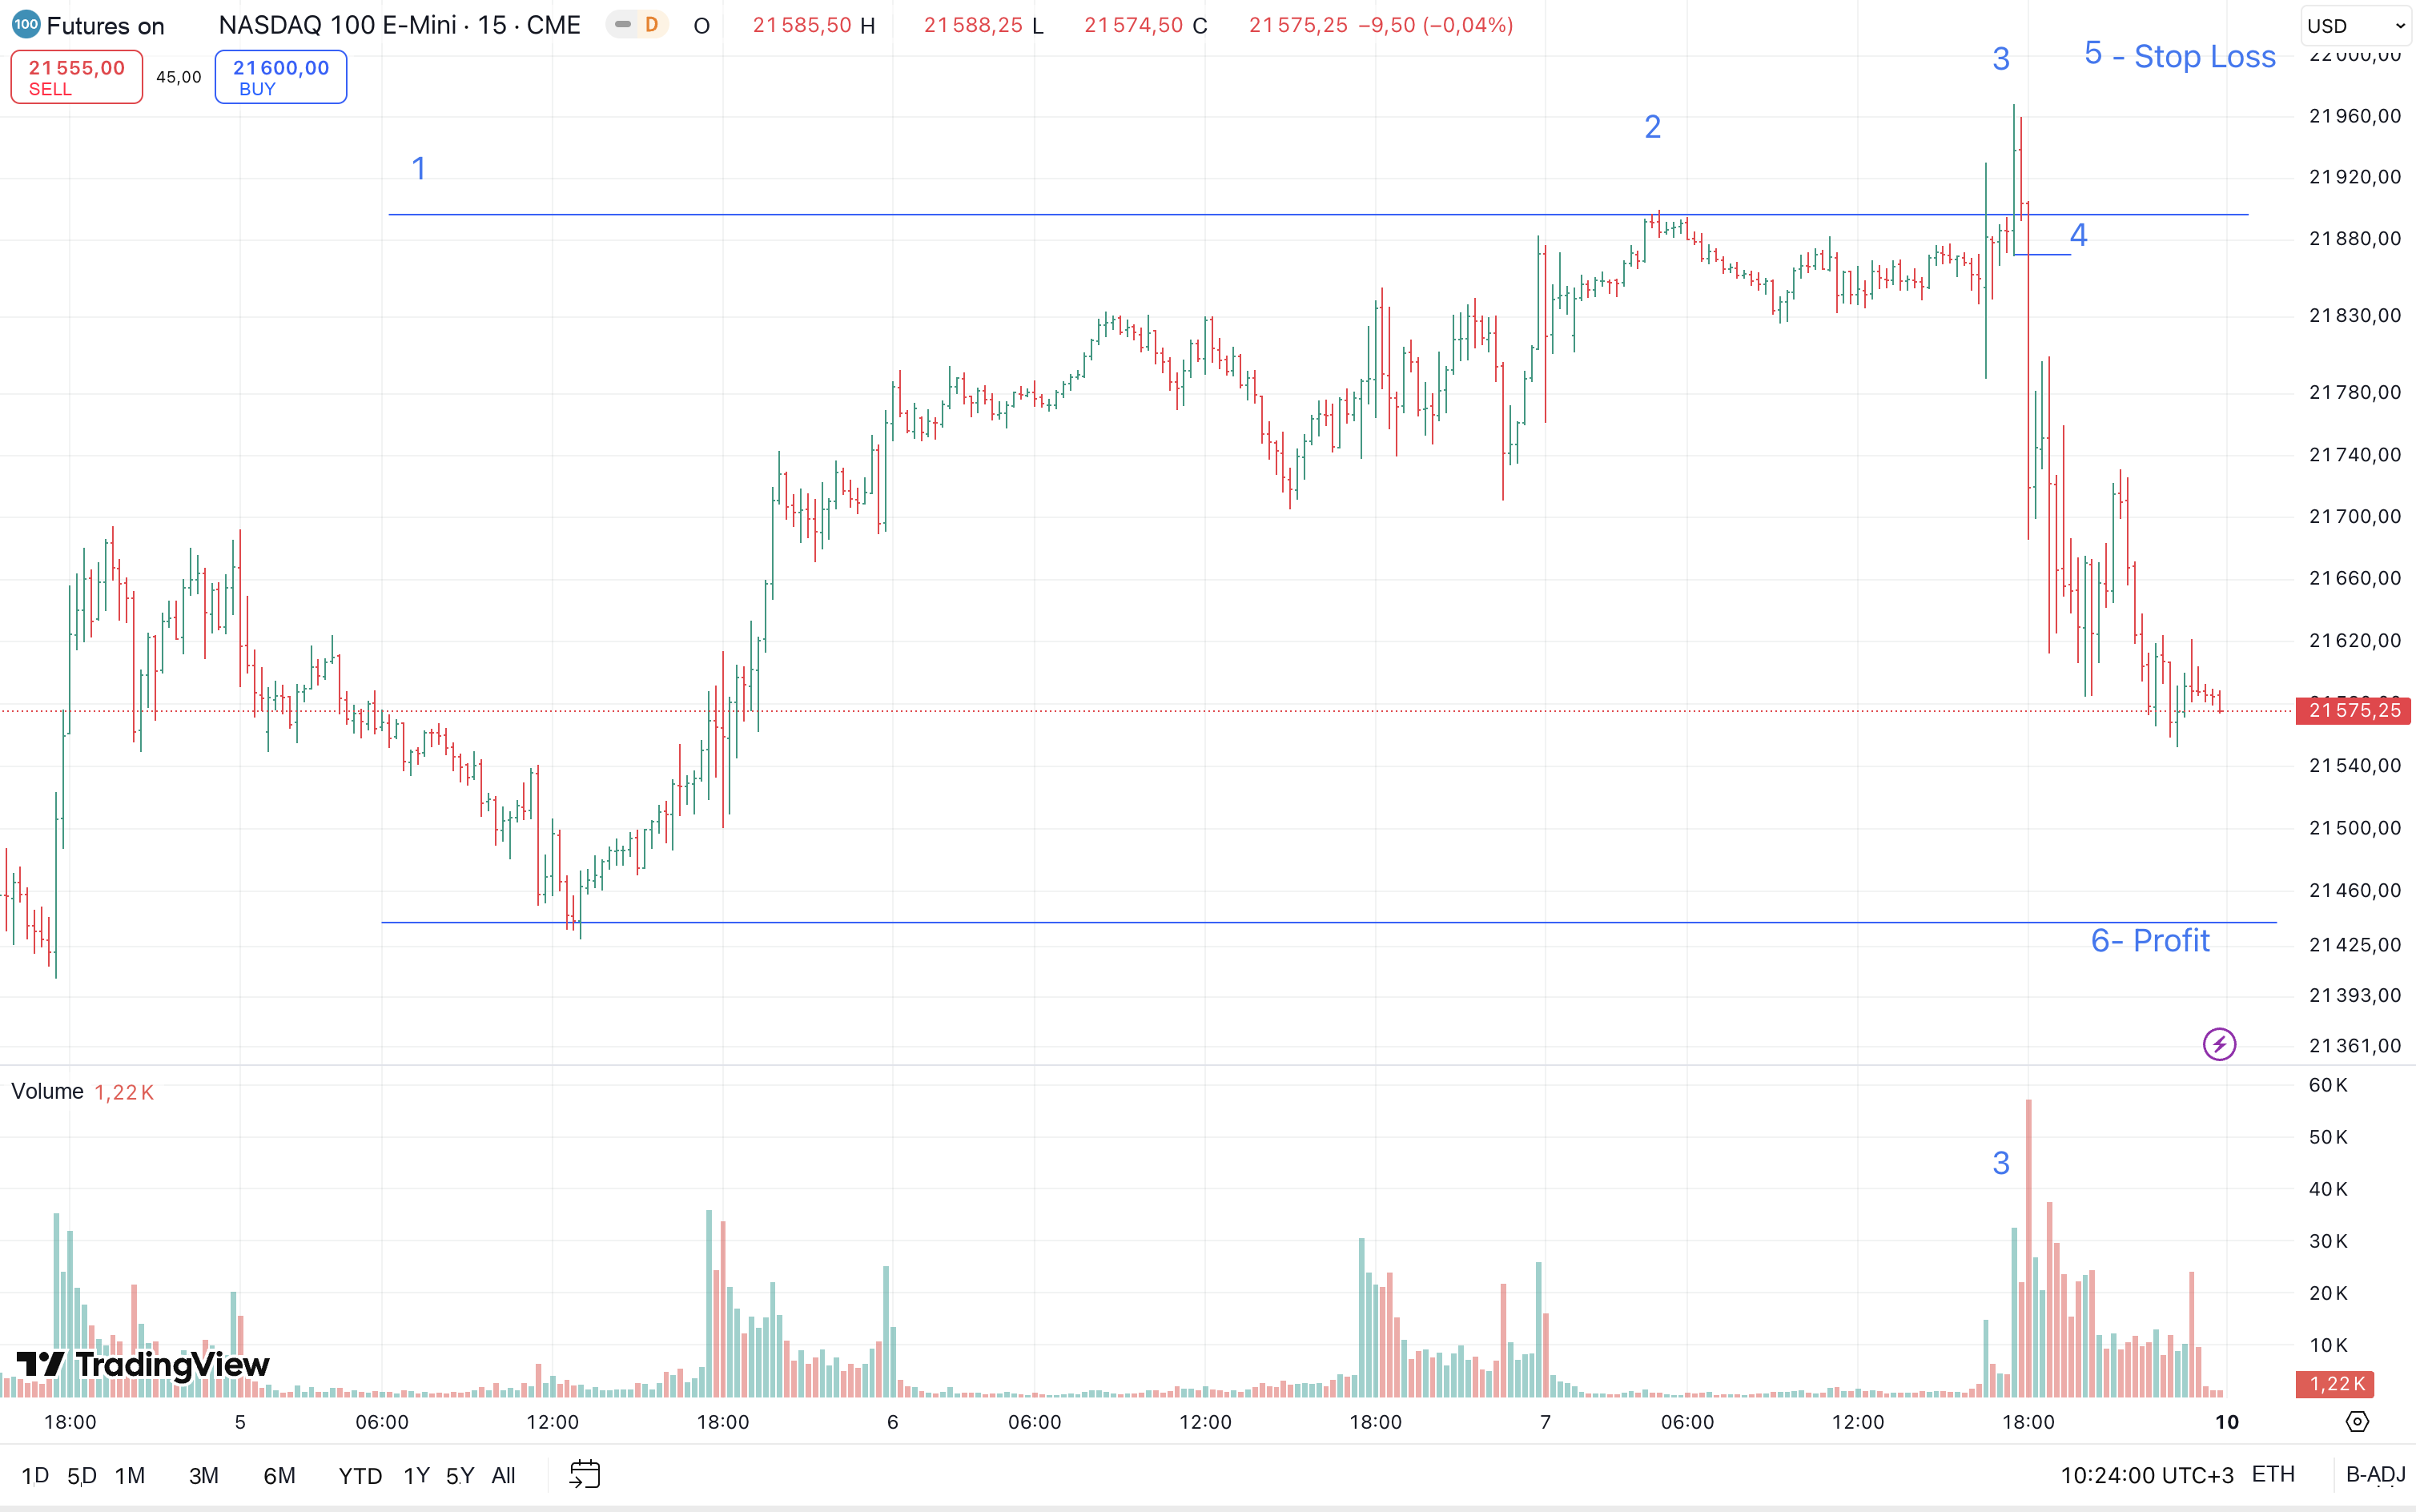
The later bars show a decline, but the displayed part of the chart has not reached target 6. It cannot establish that an order to take profit was filled. When reproducing the case, record the actual entry price and check whether the required distance to the target was still available at that moment.
2. Bitcoin: An Unsuccessful Attempt Above Resistance
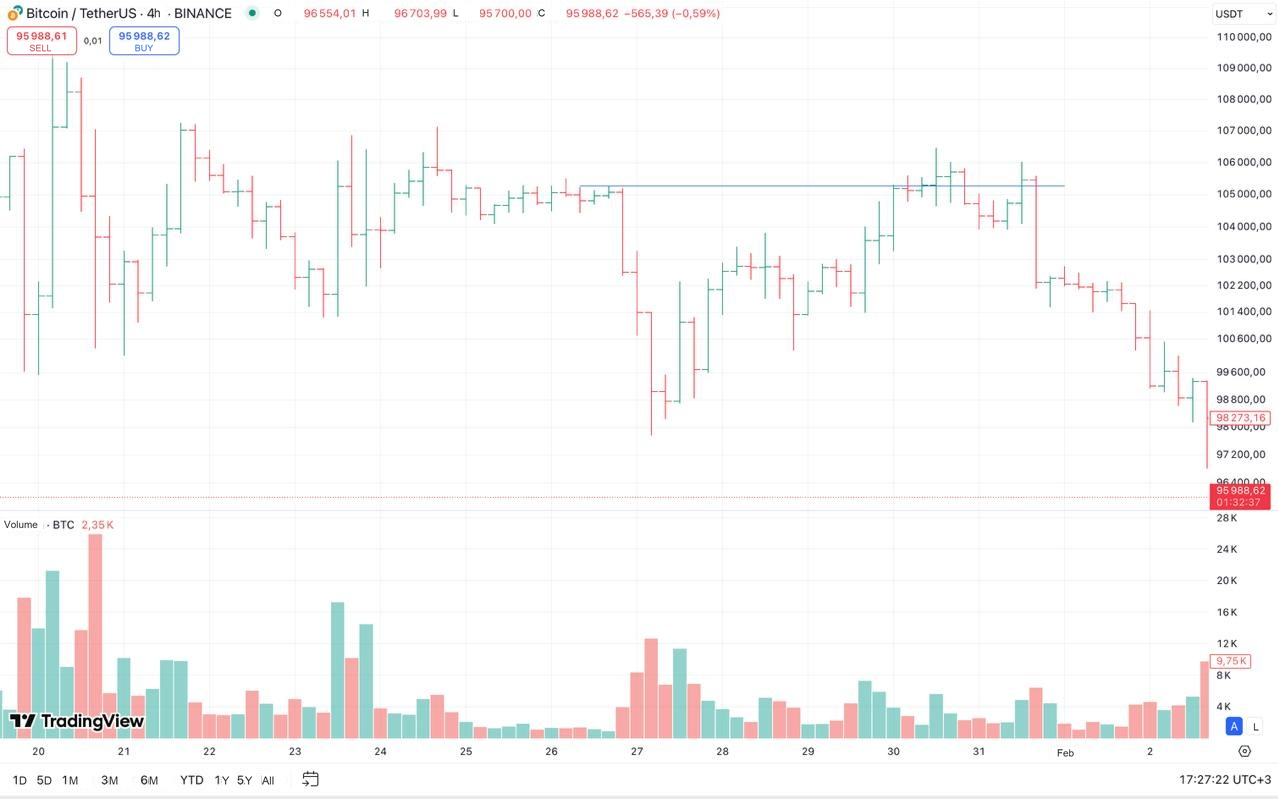
The four-hour BTCUSDT chart uses Binance data. BTCUSDT expresses Bitcoin's price in USDT, a token intended to track the US dollar. On the smaller interval, I check the same sequence: approach the marked boundary, attempt to continue higher, then respond to the failure of that attempt.
The fifteen-minute annotations show a new local high at point 3 and then a decline toward entry condition 4. Stop 5 is above the scenario's high; target 6 refers to the earlier lower area. If price instead holds above that high, the decline idea has not been confirmed. Do not move the protection farther away merely to wait for a return.
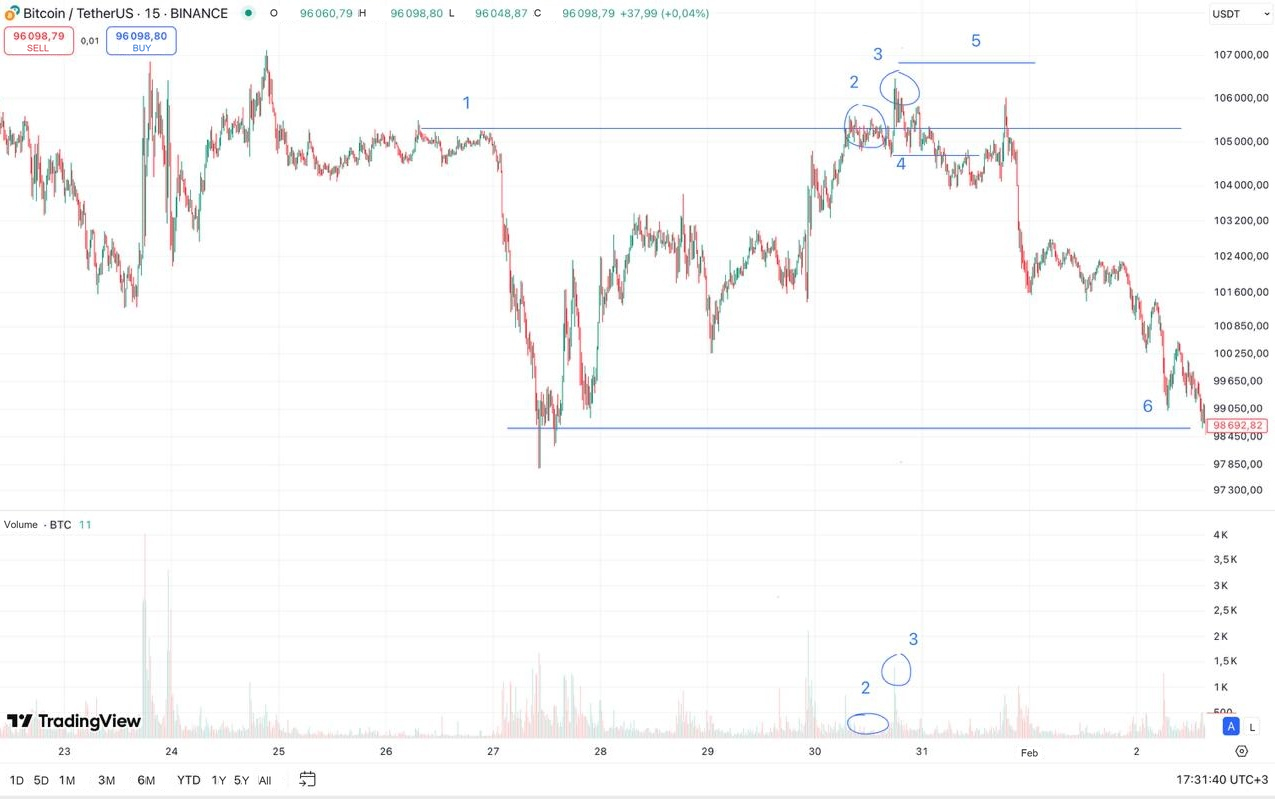
The volume belongs to this selected Bitcoin source, not every Bitcoin market combined. Compare higher and lower bars within that series. A large bar alone does not show that a particular fund sold or another identifiable participant entered.
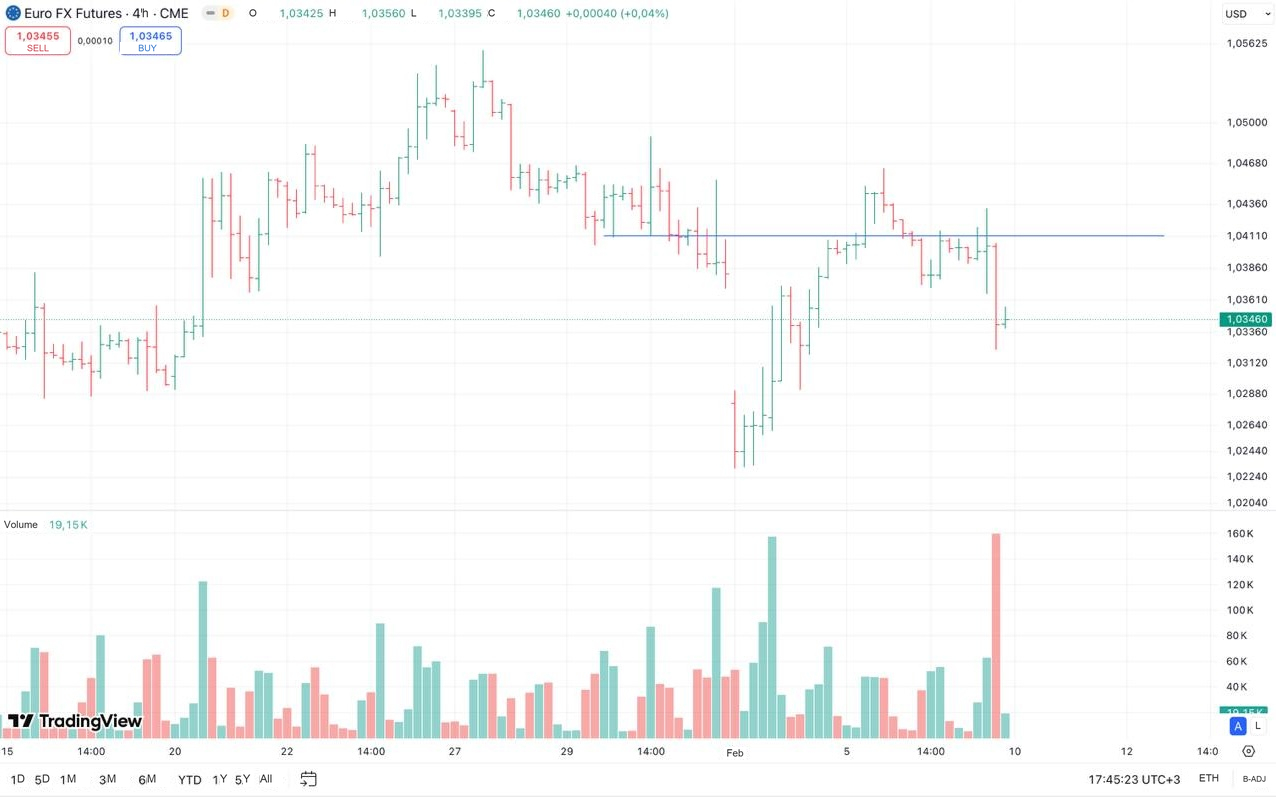
3. Euro FX Futures: Confirmation After the Move Above the Boundary
The four-hour Euro FX chart shows a CME futures contract, not any broker's EURUSD quotation. I watch how the repeated rise develops near the marked boundary. Preserve the instrument name in your own review: chart data, the monetary value of a price movement and execution rules must refer to the chosen contract.
On the fifteen-minute chart, the attempt to rise at point 3 is followed by a decline toward 4. In this annotation, that is the sell condition. Point 5 marks protection above the high; 6 marks the lower target area. Target 6 has not been reached in the visible portion. This is preparation for a possible trade, not proof of a profitable exit.
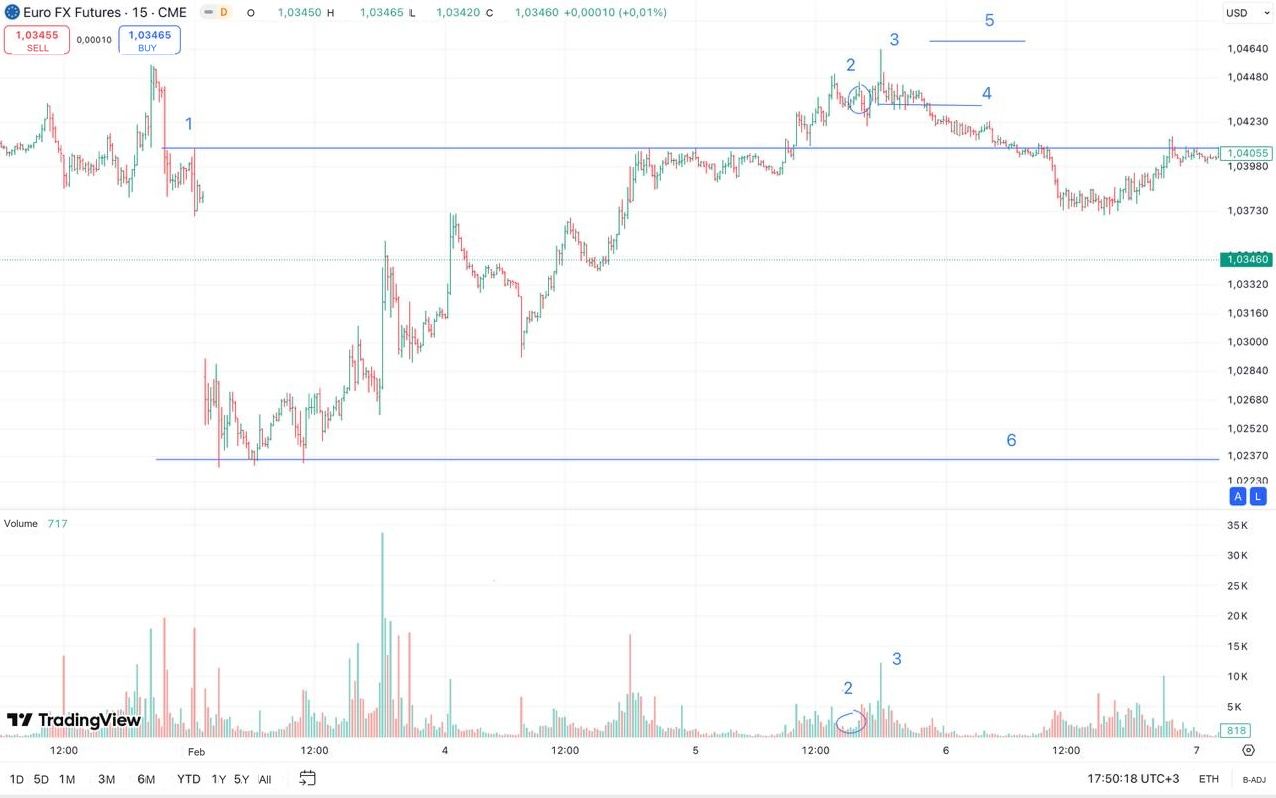
I first identify the high and proposed protective exit, then check the distance to the target. After choosing the acceptable monetary loss, I determine the contract quantity. Similar-looking charts do not justify transferring a Bitcoin position size to a Euro FX futures contract.
4. Bitcoin: Checking the Entry on a One-Hour Chart
The next four-hour Bitcoin chart marks a different resistance area. I consider the earlier price movement before switching to the one-hour chart. The smaller interval in this case is one hour, not fifteen minutes.
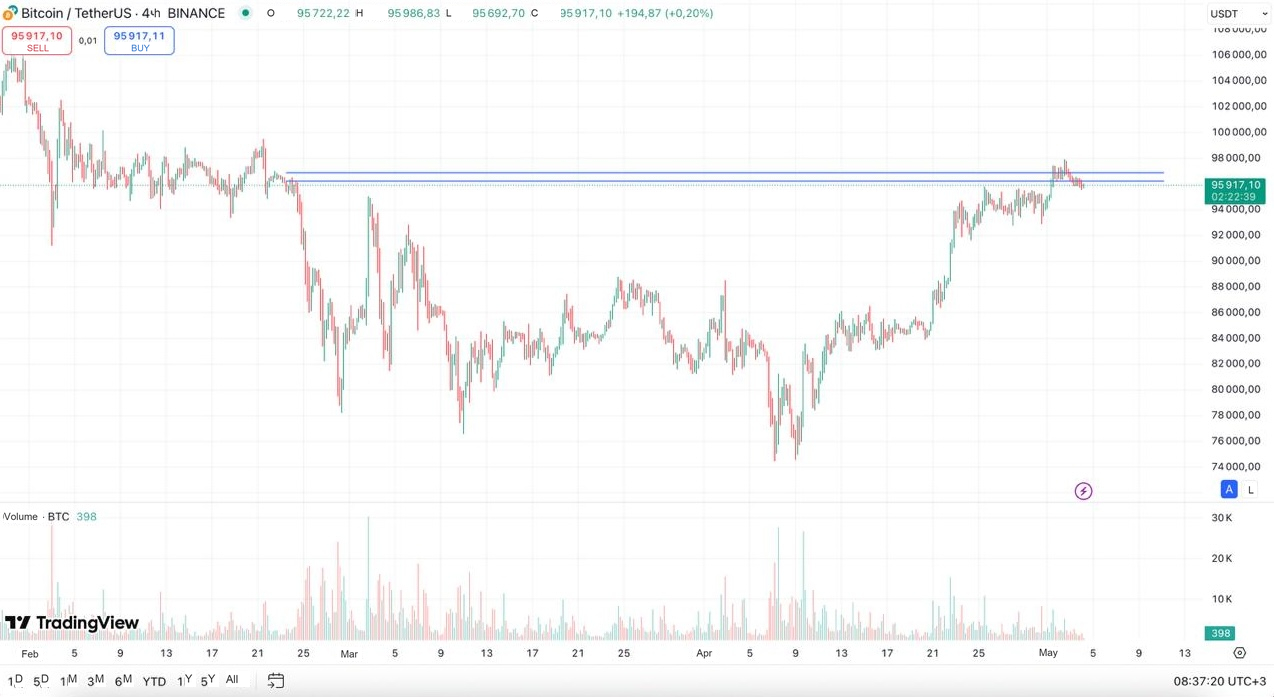
On the one-hour chart, points 2 and 3 show repeated attempts to rise. After the move above the boundary, price falls toward condition 4. Stop 5 and target 6 remain separate parts of the plan: an entry condition does not establish that the target will be reached. The later outcome is not complete in this image.
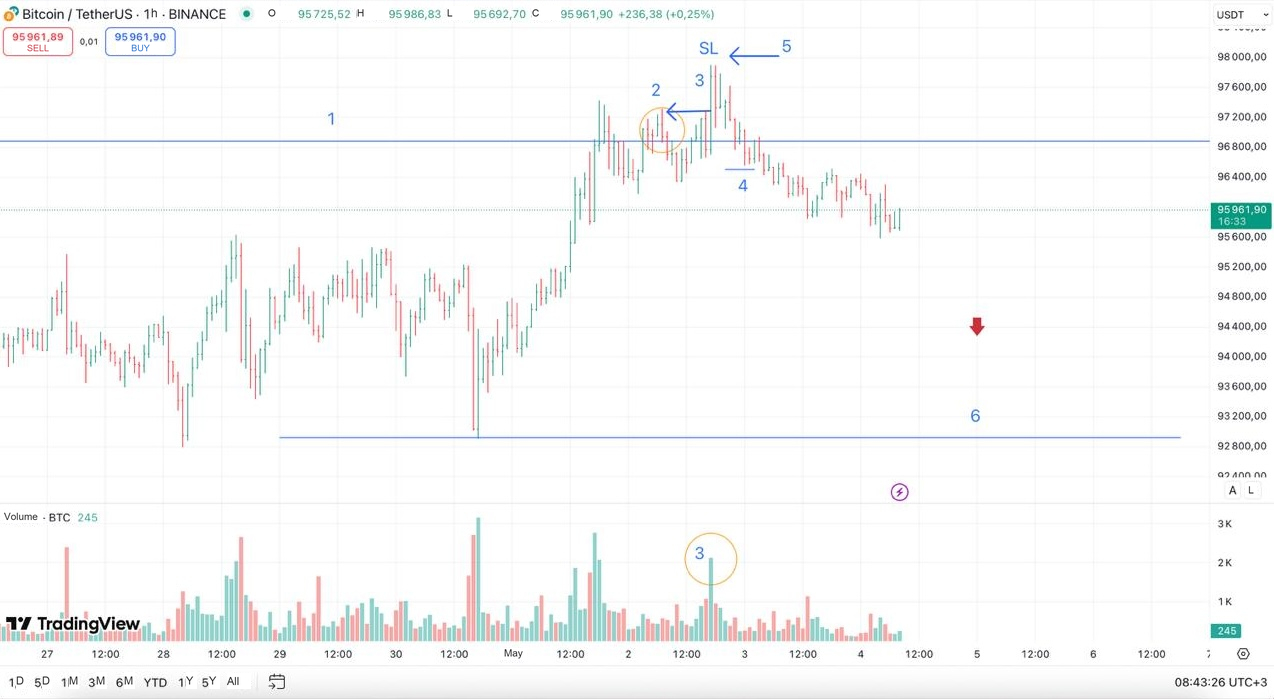
Hide the later bars and write down the decision available at point 4. If the reason to sell appears only after you have seen the decline, the exercise does not test your ability to decide beforehand. The trading-system guide explains how to record decisions and separate observations from later results.
5. Nasdaq Futures: When I Skip a Trade
This image is a two-hour E-mini Nasdaq-100 chart. The two upper turning points resemble a double top, where price stalls twice near the upper area. The shape still does not replace checking the entry, protective exit and target.
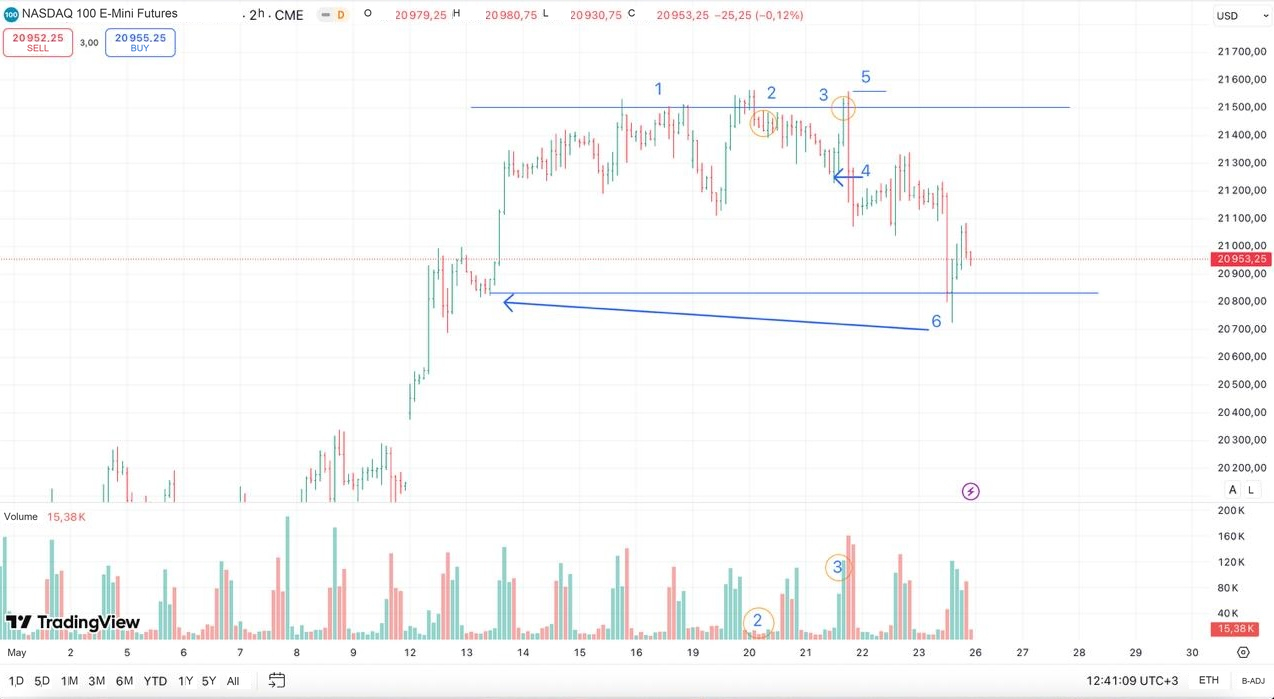
I skip this case because the selected entry and stop leave insufficient planned reward for the required 1:3 ratio before the nearest target. The later decline does not turn the skip into a mistake. Assess the decision using the conditions available before entering, rather than the movement that followed.
How to Read the Student Practice Report
The source material presents this student's report as demo-account practice. Demo trading uses simulated money. The screenshot shows summary figures but does not independently establish the account type, the complete observation period or every transaction. It is an exercise in reading results, not a promise of the outcome of training.
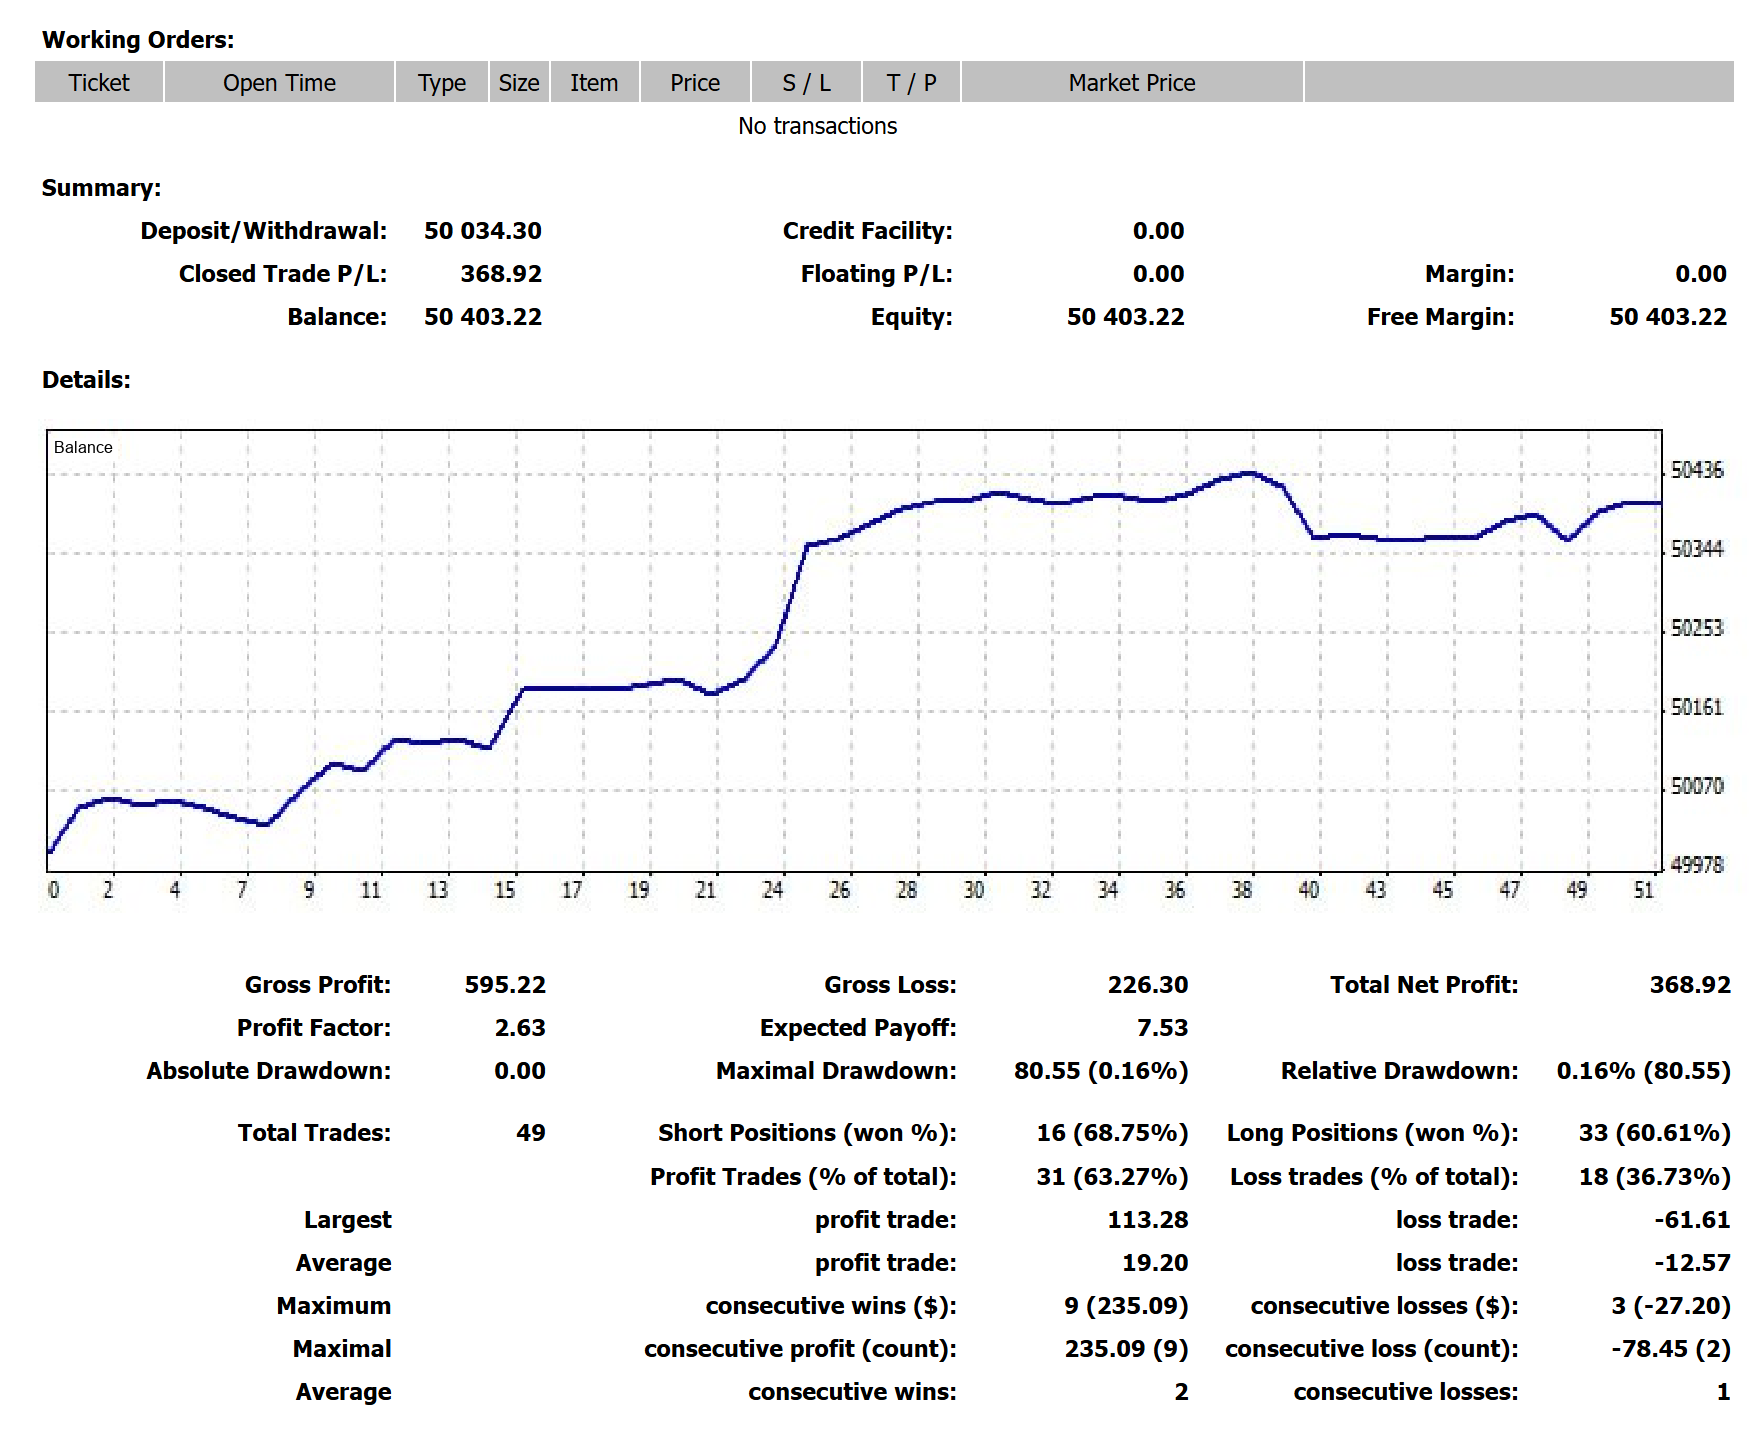
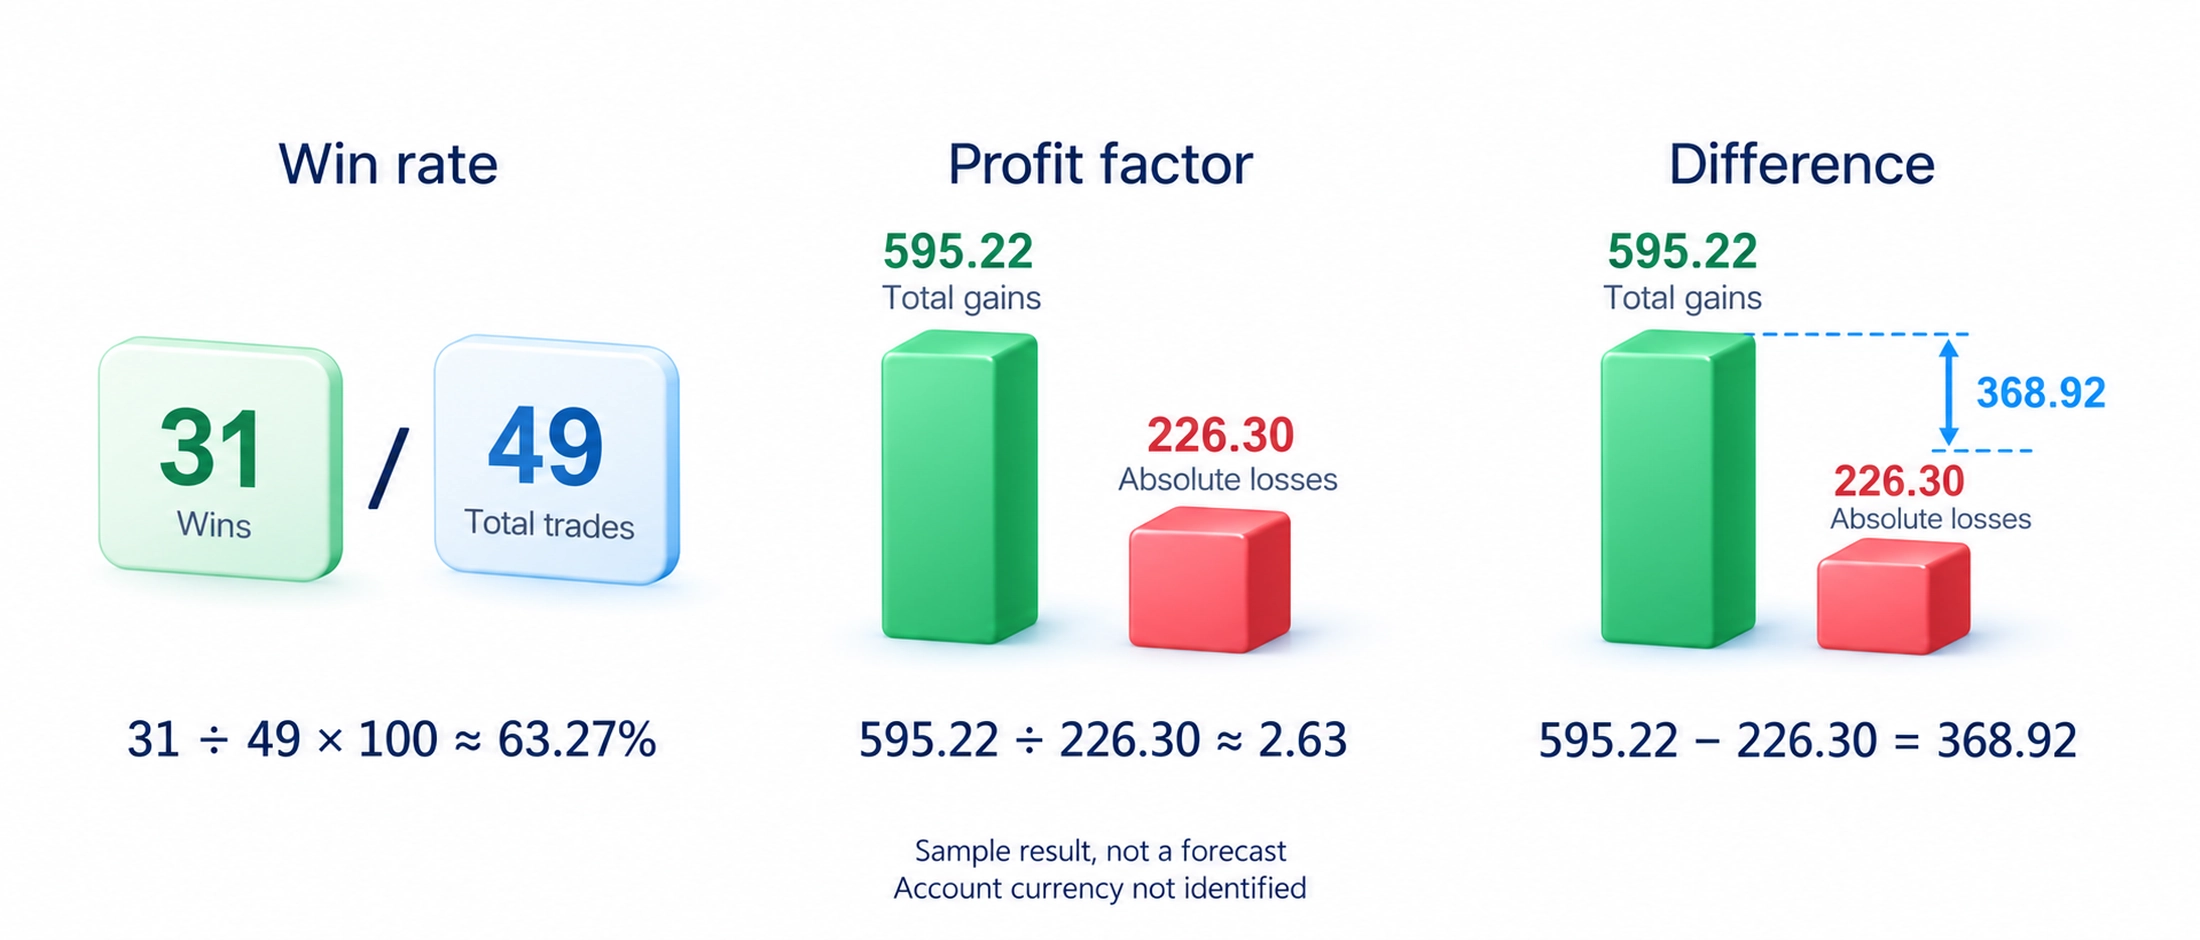
There are 49 trades, including 31 profitable trades. Win rate means the proportion of trades closed at a profit: 31 ÷ 49 × 100 ≈ 63.27%. This is a proportion in the displayed sample, not the probability of the next entry succeeding. Assessing repeatability requires other periods and records made under the same selection rules.
Profit factor divides the total profit of winning trades by the absolute total loss of losing trades. Here, 595.22 ÷ 226.30 ≈ 2.63. The difference is 368.92 in the account's currency units; the screenshot does not identify that currency. Win rate measures how often trades finished profitably. Profit factor compares the aggregate gains and losses. Many small winners can be outweighed by fewer, larger losses; costs also affect the final result.
The planned 1:3 ratio is not the realized ratio of average wins to average losses. The report shows an average profitable trade of 19.20 and an average losing trade of 12.57 in absolute value. These are figures from completed trades. Partial exits, execution and costs can make the final result differ from the original target.
For practice with this strategy, I ask for at least 40 demo trades under unchanged rules, with the charts saved. That is a learning assignment, not a statistical threshold that guarantees profitability. Record skipped entries and violations as well: a favorable total can otherwise hide trades that did not follow the system.
The risk-and-results lesson in my course connects the planned risk/reward ratio with the results of a series. The optional false-breakout example offers a practical illustration. First reproduce the conditions on a practice chart, then compare the recorded plan with the actual result, including costs and departures from the rules. The written examples here can be studied without watching the video.
Frequently asked questions
It connects a level, the price's response, an entry condition, a planned loss exit and a planned profit exit. The annotations describe a plan; they do not by themselves establish that the orders were executed.
No. After moving beyond a marked boundary and returning inside it, price can later resume its previous direction. That return does not by itself establish a reversal.
In these practice scenarios, even when price has stalled twice near the upper area, the trade can be skipped if the nearest target leaves a planned gain of less than three times the planned loss, before costs. Later movement does not change the conditions available before the entry.
Win rate is the percentage of profitable trades. Profit factor divides the total profits from winning trades by the absolute total losses from losing trades. They describe different aspects of the same sample; a high win rate alone does not guarantee profit.
No. It is the observed proportion of 31 profitable trades among 49 in this report. It does not establish repeatability in another period or the probability of an individual future trade.
No. The result depends on realized gains and losses, execution and costs. The planned target can differ from the outcome of completed trades.
About the author
Igor Arapov, a practicing trader since 2013 and author of the ArapovTrade library. ORCID: 0009-0003-0430-778X.




