Bitcoin dominance is Bitcoin's percentage share of the cryptocurrency market value measured by a particular data provider. You may see it labelled BTC.D on a chart. It compares Bitcoin's relative weight with the provider's other assets; it does not tell you tomorrow's BTC price or where investors have transferred their money.
To interpret a change, check what the provider includes and compare the share with the underlying prices. The same rise in dominance can occur while Bitcoin rises, while it falls, or when the list of assets changes.
How Bitcoin dominance is calculated
Market capitalisation is the current price multiplied by the quantity the provider counts as circulating. It values that supply at a current price; it is not a total of all the money ever invested. Bitcoin explained covers the asset itself rather than this market-share calculation.
Divide Bitcoin's market capitalisation by the total for the selected market, including Bitcoin, then multiply by 100%. Use the same provider, time and currency for both amounts. A numerator from one service and a denominator from another may not describe a consistent market.
For a hypothetical example, Bitcoin is valued at USD 600 billion and the selected total at USD 1 trillion, or 1,000 billion. Its dominance is 600 divided by 1,000 times 100, which is 60%. This is a share of estimated market value, not a share of transactions, wallets or cash deposited.
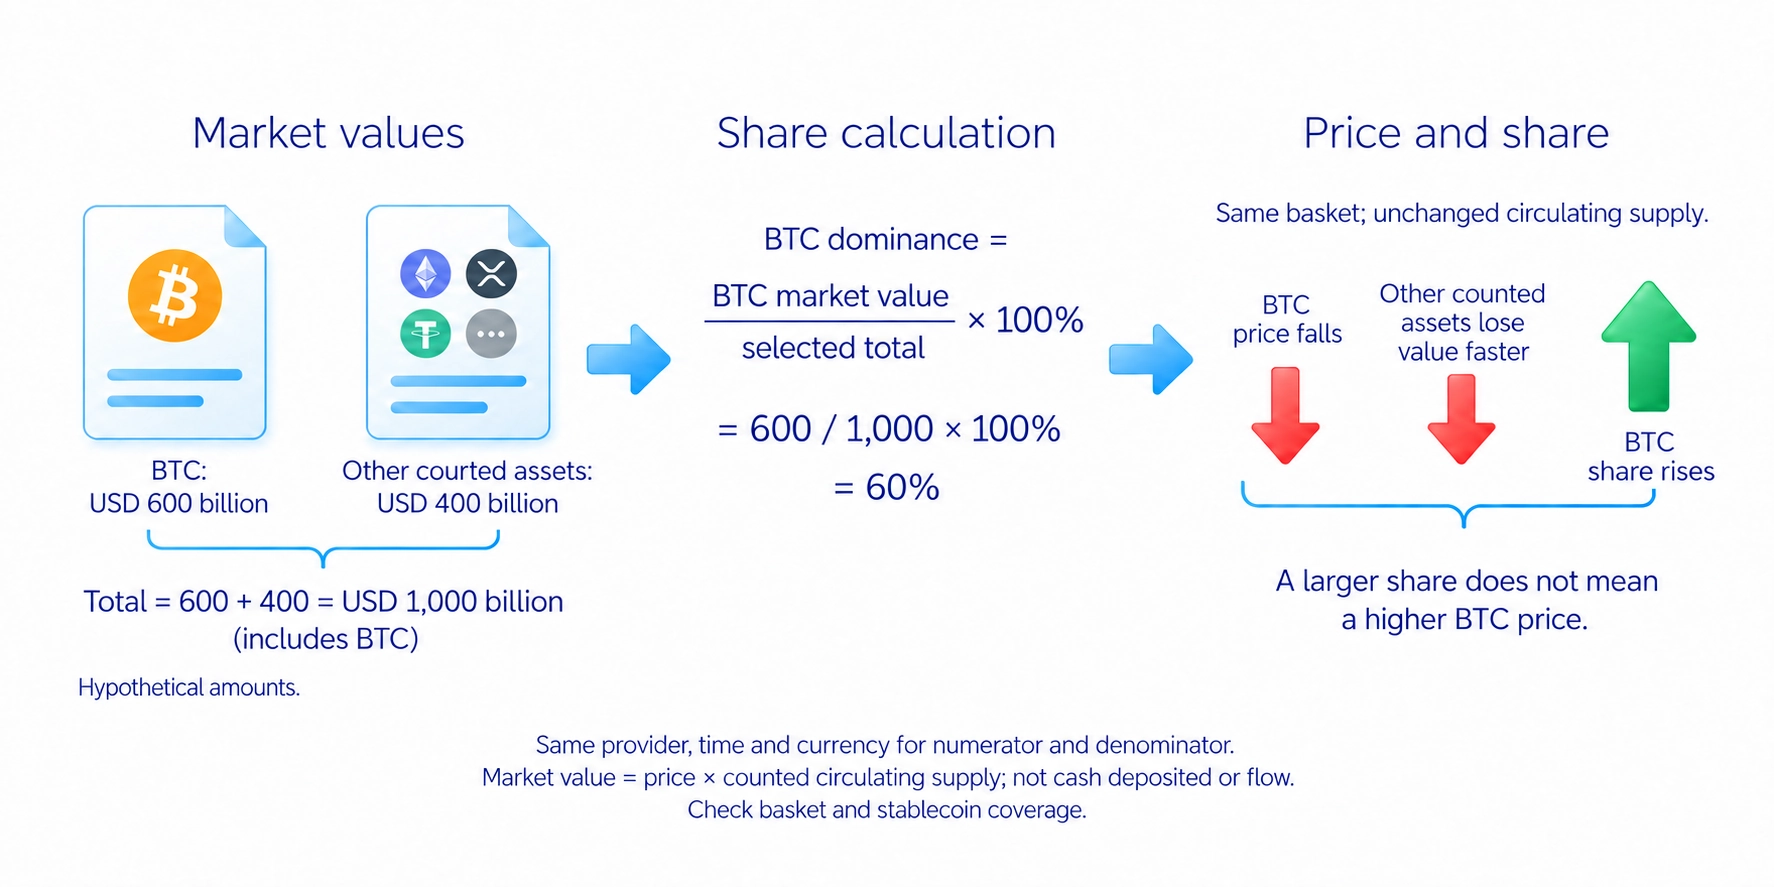
Market value changes with price and the counted supply. A new price is applied to all counted coins even though they were not all sold at that price. An increase in the estimated total therefore does not establish an equal cash inflow.
Why data providers show different values
The phrase whole crypto market needs a defined basket. TradingView's published methodology calculates BTC.D using Bitcoin's capitalisation and its TOTAL index, which currently covers the top 125 cryptocurrencies in its screener. CoinGecko's global total adds the values of the projects it tracks. Check the current rules before comparing providers rather than assuming their totals include the same assets.
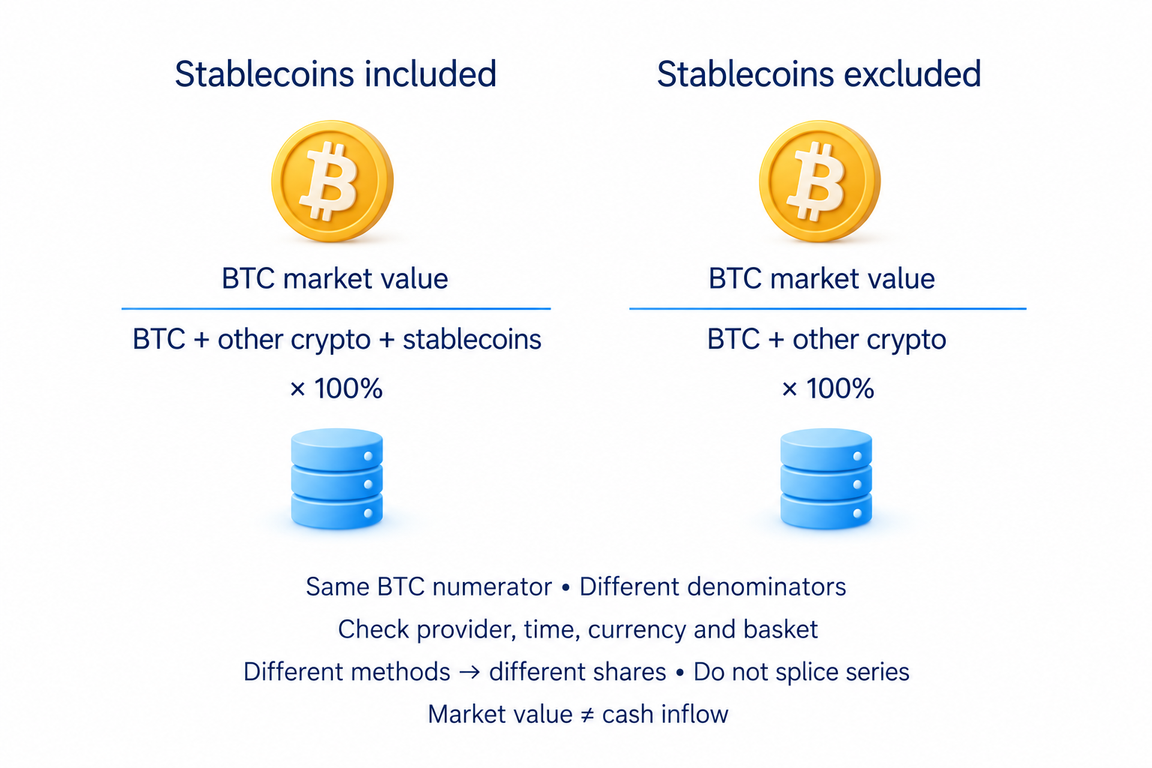
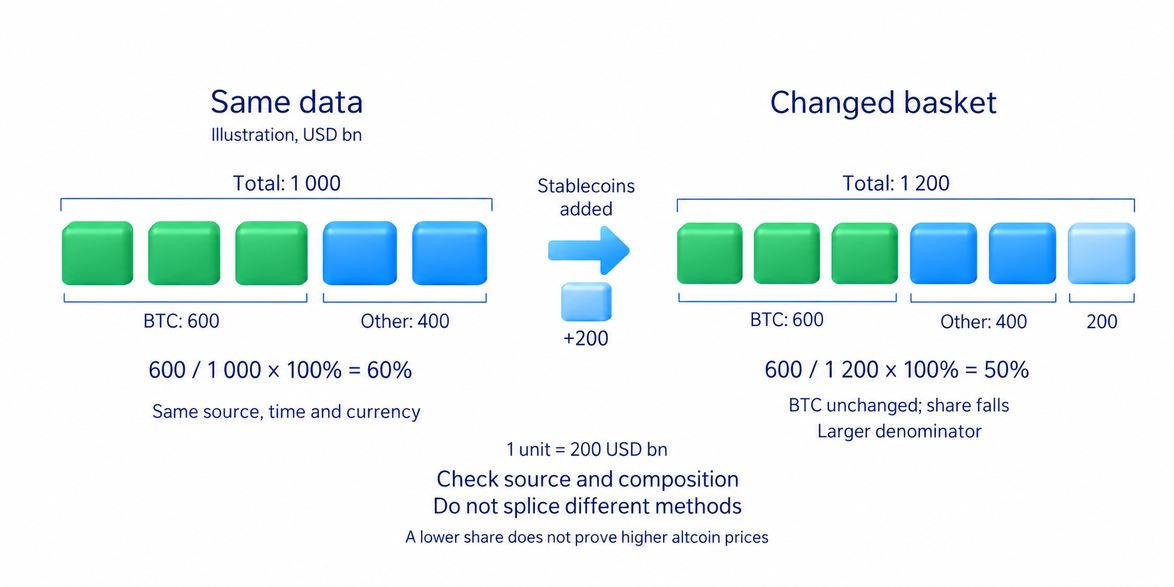
Stablecoins, tokens intended to follow another asset's price, may be included in the denominator. An increase in their counted supply can reduce Bitcoin's share without ordinary altcoin prices rising. Altcoin usually means a cryptocurrency other than Bitcoin. For a comparison of speculative coins, a group excluding stablecoins answers a different question. Stablecoins and Tether explains their underlying arrangements.
TradingView also provides totals that exclude stablecoins. A share calculated using one of those totals is different from ordinary BTC.D. Do not splice the two into a single continuous series. For historical comparisons, check whether the basket and exclusions were calculated consistently throughout the period.
A coin entering or leaving the basket can alter the total. A provider can also revise a circulating-supply estimate. If dominance jumps unusually sharply, check composition and data changes before interpreting it as evidence of investors changing their behaviour.
Use the market value of circulating supply in both parts of the ratio. A value based on all possible future coins is a different measure. Mixing it into the denominator makes the result unlike the published dominance series.
What rising or falling dominance means
Rising dominance means Bitcoin's relative weight has increased. BTC may be rising faster than the other counted assets, but the same percentage move can occur while it falls if the others lose value faster. A rising share is neither proof of a rising Bitcoin price nor a reason to call a BTC purchase safe.
Falling dominance means Bitcoin's relative weight has decreased. Other assets may have risen faster, stablecoin supply may have increased, or Bitcoin may have fallen more. The direction of the ratio alone does not distinguish these explanations.
In the earlier example, Bitcoin accounted for 60% of the total. Keep its USD 600 billion valuation unchanged while the value of the other counted assets increases. Bitcoin's share becomes smaller even though its own price need not have changed. Comparing both parts of the ratio reveals what the percentage alone hides.
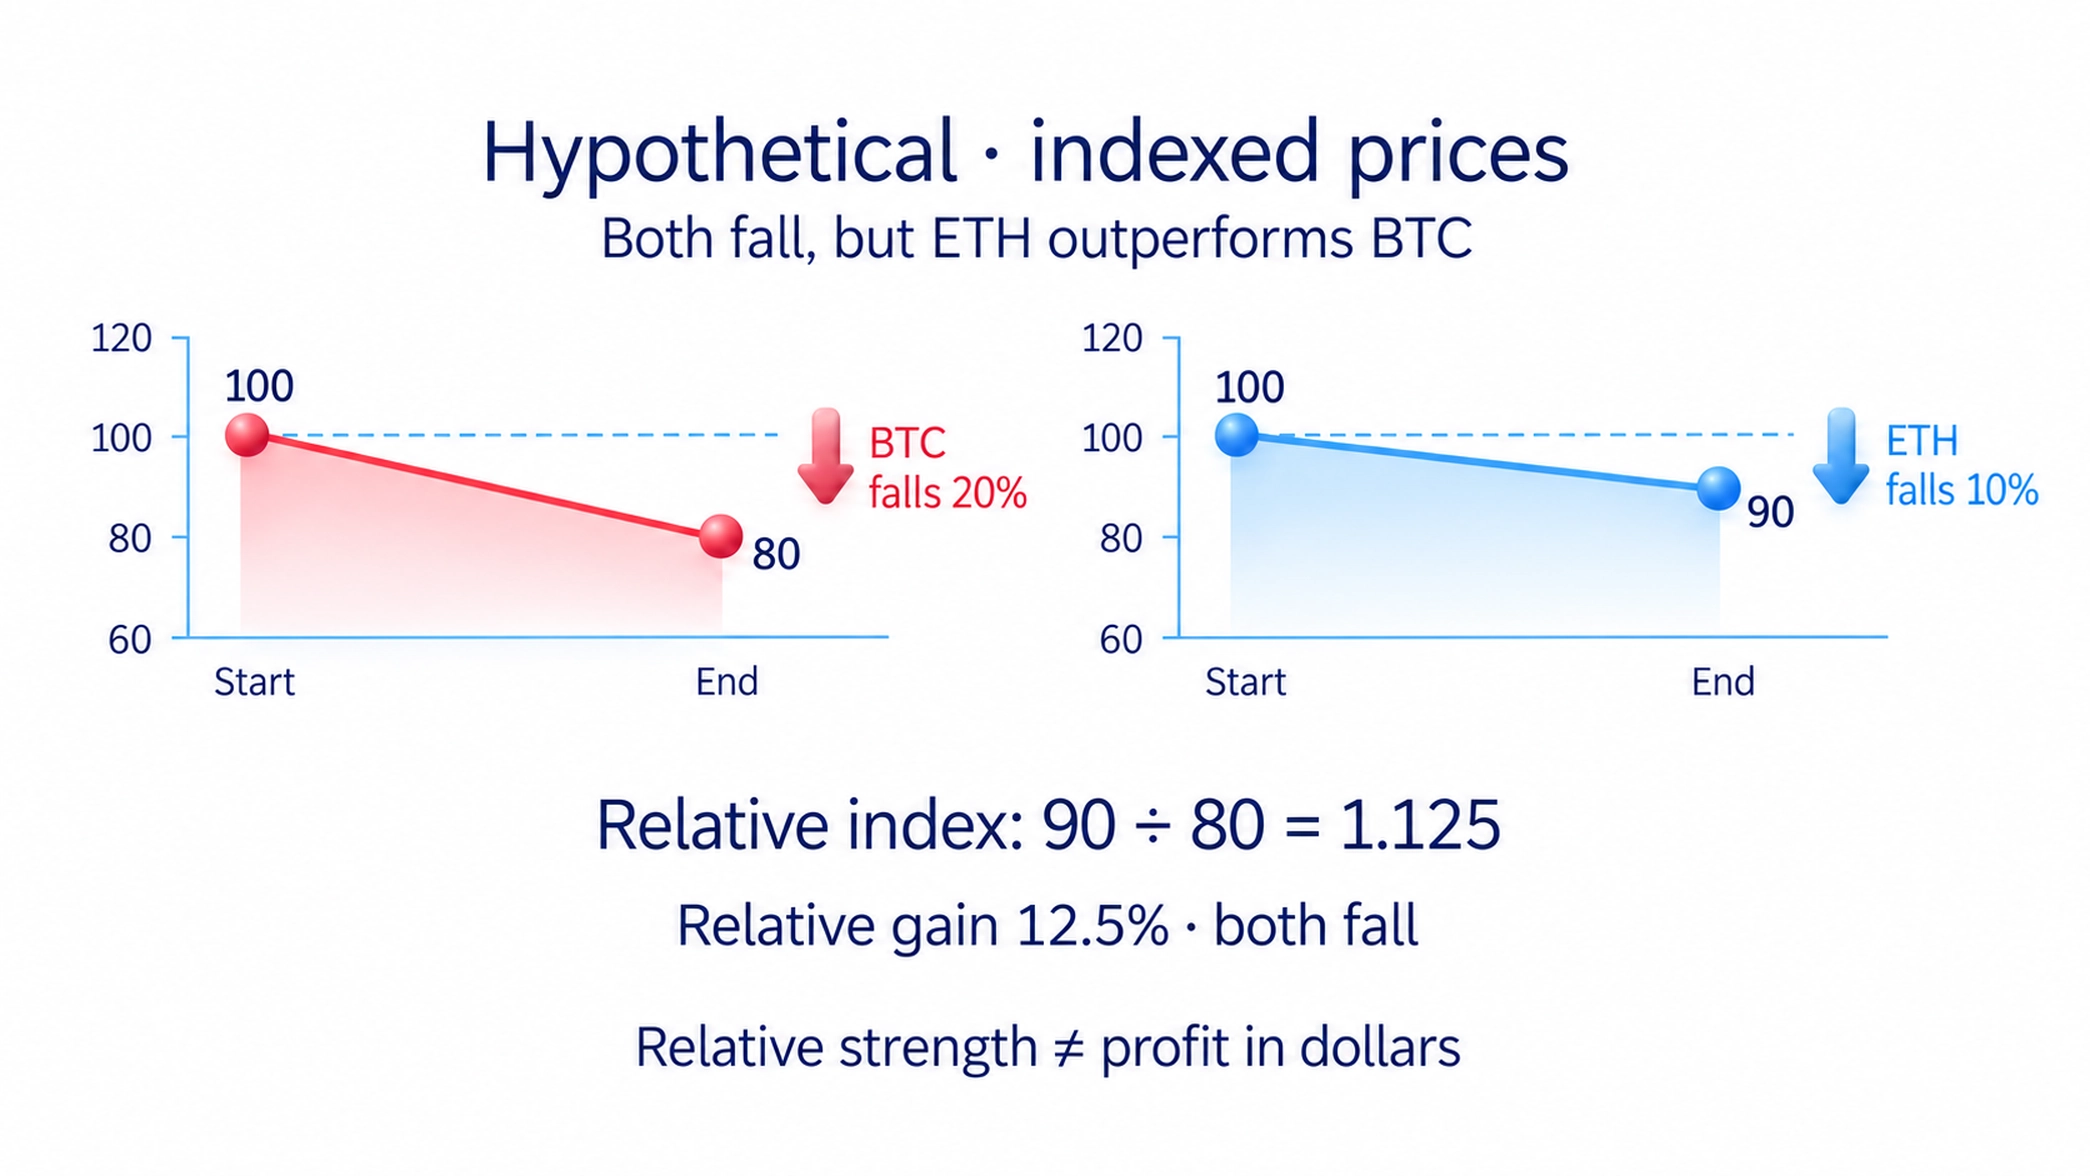
Compare dominance with Bitcoin's dollar price over the same period. Then examine the relevant altcoin group and its composition. ETH/BTC is the price of one ETH in Bitcoin: it can rise while both dollar prices fall, if ETH loses less. Ethereum explained covers the asset behind that separate price comparison.
Market value, dominance and trading volume measure different things. Volume records completed trading over a period; dominance compares asset valuations. Neither identifies the buyers or proves their intentions. A rising BTC share does not establish that particular holders moved money out of altcoins. Bitcoin ETF shares also provide a separate way to obtain a Bitcoin-linked result, with their own rights and flow measures.
Bitcoin dominance versus altcoin-season breadth
Altcoin season usually describes a period in which many altcoins outperform Bitcoin. It is relative performance, not a promise that every coin rises. If you buy in dollars, check the dollar return too: an asset can fall less than Bitcoin and still outperform it.
An altcoin-season index tests how widespread that outperformance is. BlockchainCenter, for example, compares 50 eligible coins with Bitcoin over 90 days and uses a 75% threshold. It excludes stablecoins and tokens representing other assets. Other providers use different eligible groups, so check the particular index rather than assuming the same result.
That 75% is a threshold in an index's method. It is not a Bitcoin-dominance level or the probability of a profitable trade. The index describes a past period; it does not establish that the same coins will keep outperforming.
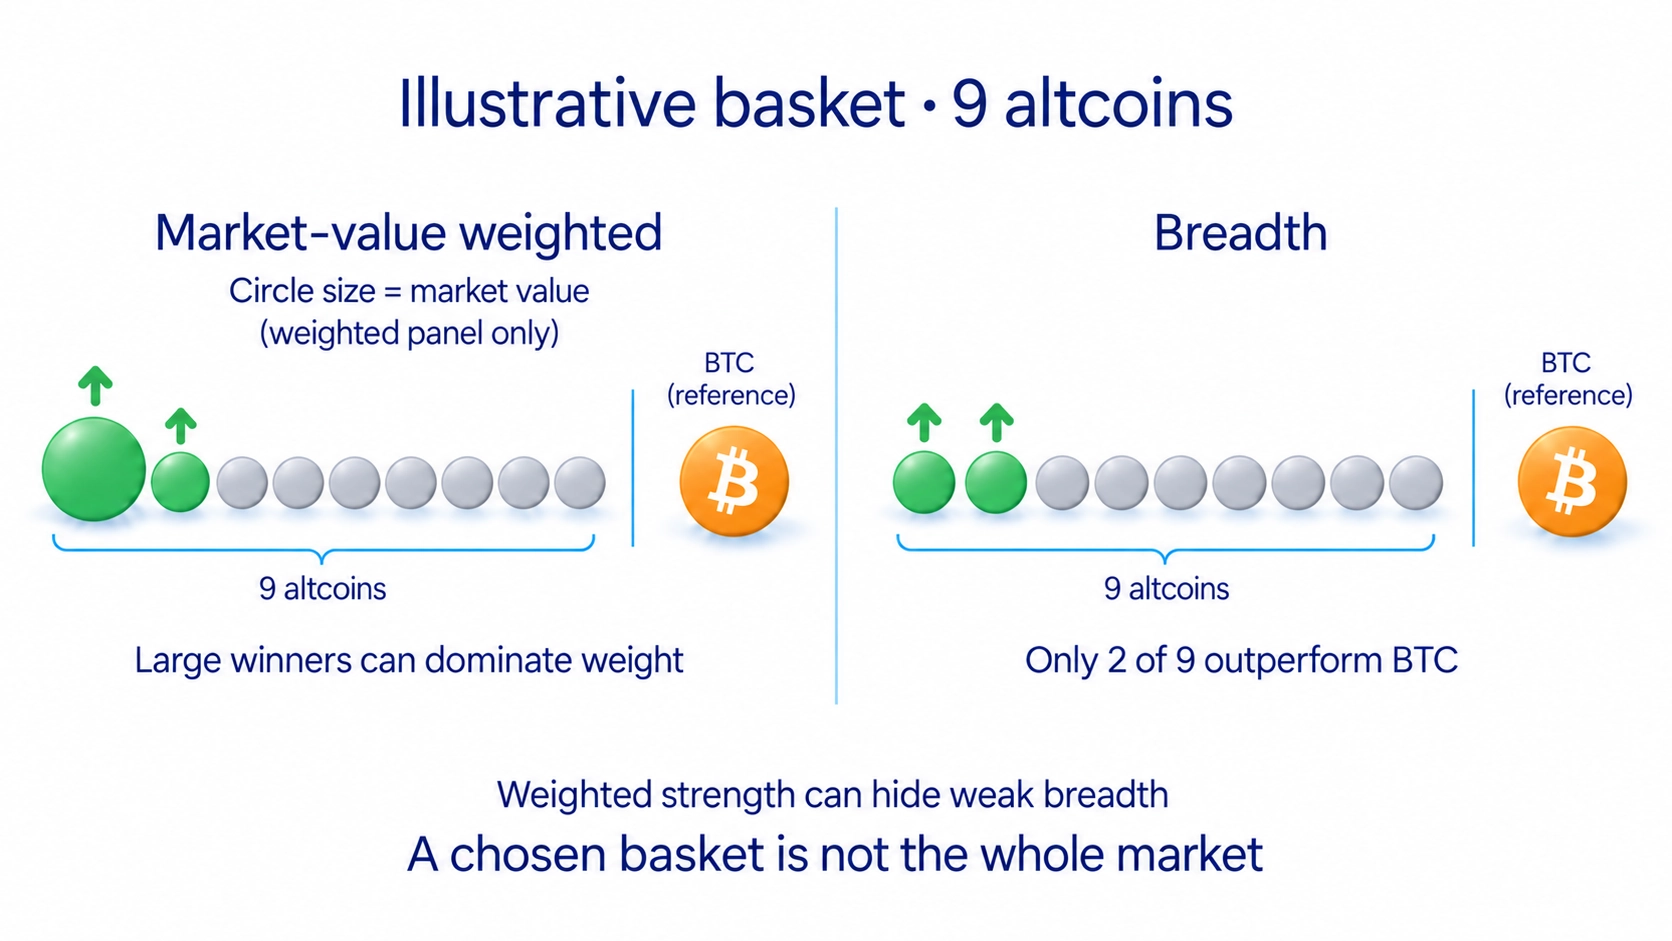
Dominance gives more weight to assets with larger market values. An altcoin-season index counts how many eligible coins beat Bitcoin. A few large coins can therefore reduce BTC.D even when most of the other coins do not improve. A falling share cannot replace a check of how broad the movement is.
Checking a dominance conclusion before a trade
Record the provider, basket and comparison period. Open Bitcoin's price and the relevant altcoin group over that same interval. Ask whether the share changed because of prices, supply estimates or basket composition. Those are checkable explanations; a story about an inevitable chain of money transfers is not.
For a possible purchase, inspect the chosen coin's own chart. A fall in BTC.D does not specify an entry price, where the trade idea becomes invalid, or whether your order can execute. If that chart fails your system's conditions, the aggregate percentage does not fix it.
The market-structure section of my course starts with successive highs and lows on the instrument being examined. A change in that sequence helps identify the direction before the system's further conditions are checked. This is a way to examine a chart, not a separate personal strategy for trading BTC.D.
Cryptocurrency for beginners explains the assets and ways of holding or trading them. For this dominance check, the result is narrower: you should be able to explain which part of the ratio changed and assess the chosen coin separately. If the explanation ends at dominance fell, therefore buy, the entry conditions are still missing.
Frequently asked questions
It is Bitcoin's share of the market value counted by a provider, expressed as a percentage. The result depends on the basket and valuation data. It is not the BTC price or a total of invested money.
No. Bitcoin's share can rise while its price falls if the other counted assets fall more. Compare dominance and Bitcoin's price over the same period.
Providers may use different baskets, prices and circulating-supply estimates. Check the provider, calculation time and stablecoin coverage. Do not join different methodologies into a single series.
No. A few large coins, supply changes or basket changes can reduce Bitcoin's share. An altcoin-season index separately tests how many eligible assets outperform BTC over a chosen period.
There is no universal required value. The percentage depends on the basket and relative valuations. One fixed threshold cannot identify when altcoins will rise.
A change in dominance alone is insufficient. Check the chosen coin's price, chart, system conditions and potential loss. The aggregate share does not define an entry or the point that invalidates the idea.
About the author
Igor Arapov, a practicing trader since 2013 and author of the ArapovTrade library. ORCID: 0009-0003-0430-778X.




